Home
2024
Election Results
Election Info
Weblog
Forum
Wiki
Search
Email
Login
Site Info
Store
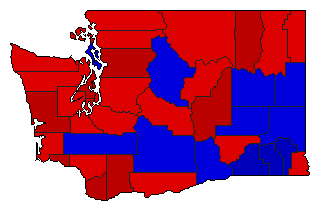
1950 Senatorial General Election Results - Washington
Note: The Google advertisement links below may advocate political positions that this site does not endorse.
Data for this Contest was Contributed by on 2009-10-05
Senatorial
Candidate
Political
Party
Popular Vote
Warren G. Magnuson
Democratic
397,719
53.40%
Walter Williams
Republican
342,464
45.98%
Herbert J. Phillips
Independent Party
3,120
0.42%
H. J. Churchward
Socialist Labor
1,480
0.20%
Map Key
> 40%
> 50%
> 60%
> 70%
Turnout
Maps
Demographic Data
1950 Population:
2,378,963
Enum.
1950 Population Density:
13.8
persons/km
2
1940 Population:
1,736,191
Enum.
1940 Population Density:
10.1
persons/km
2
Land Area (2000):
172,348
km
2
Annual Pop Growth Rate:
3.2
%
Election Data and Statistics:
County Data (Table)
(m)
County Data (Graphs)
(m)
Compare State Data by Year (Table)
Compare State Data by Year (Graphs)
View All 1950 Washington Data
Compare State Maps by Year
View All 1950 Washington Maps
Election Tools
Atlas Forum
Image Code for Maps:
County
Data Sources:
Source for Popular Vote data: Washington Secretary of State,
Abstract of Vote State General Election November 7th., 1950
(Olympia, 1950)
Source for Population data: U.S. Census Bureau.
Results for and Individual County:
(m)
Choose Year
2022
2018
2016
2012
2010
2006
2004
2000
1998
1994
1992
1988
1986
1983
1982
1980
1976
1974
1970
1968
1964
1962
1958
1956
1952
1946
1944
1940
1938
1934
1932
1928
1926
1922
1920
1916
1914
Choose Office
S. J. R. No. 9
Choose State
Arizona
California
Colorado
Illinois
Indiana
Iowa
Kansas
Maryland
Nevada
New Hampshire
North Dakota
Oregon
Pennsylvania
Rhode Island
South Dakota
Utah
Wisconsin
1992 >
Washington Election Results Home
-
National Results for 1950
-
Use Frame Navigation
Login
Terms of Use
-
DCMA Policy
-
Privacy Policy and Cookies
©
Dave Leip's Atlas of U.S. Elections, LLC 2019 All Rights Reserved


