Home
2024
Election Results
Election Info
Weblog
Forum
Wiki
Search
Email
Login
Site Info
Store
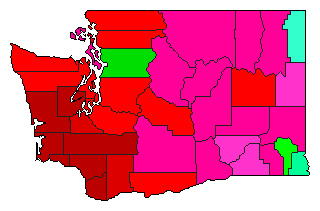
2000 Secretary of State Democratic Primary Election Results - Washington
Note: The Google advertisement links below may advocate political positions that this site does not endorse.
Data for this Contest was Contributed by on 2010-08-04
Secretary of State
Candidate
Political
Party
Popular Vote
Don L. Bonker
Democratic
239,843
42.82%
Bob Terwilliger
Democratic
140,766
25.13%
Charles Rolland
Democratic
86,315
15.41%
Rand Daley
Democratic
48,342
8.63%
Allen Norman
Democratic
44,896
8.01%
Map Key
> 20%
> 30%
> 40%
> 50%
> 60%
Turnout
Maps
Demographic Data
2000 Population:
5,894,121
Enum.
2000 Population Density:
34.2
persons/km
2
1990 Population:
4,866,669
Enum.
1990 Population Density:
28.2
persons/km
2
Land Area (2000):
172,348
km
2
Annual Pop Growth Rate:
1.9
%
Election Data and Statistics:
County Data (Table)
(m)
County Data (Graphs)
Purchase Detailed Data
Compare State Maps by Year
View All 2000 Washington Maps
Election Tools
Atlas Forum
Image Code for Maps:
County
,
Pop
Data Sources:
Source for Popular Vote data: Washington Secretary of State.
September 2000 Primary
, Washington Secretary of State (/www.sos.wa.gov/elections/results_report.aspx?e=18&c=&c2=&t=&t2=&p=&p2=&y=) (accessed 04 Aug 2010)
Source for Population data: U.S. Census Bureau.
Results for and Individual County:
Adams County
Asotin County
Benton County
Chelan County
Clallam County
Clark County
Columbia County
Cowlitz County
Douglas County
Ferry County
Franklin County
Garfield County
Grant County
Grays Harbor County
Island County
Jefferson County
King County
Kitsap County
Kittitas County
Klickitat County
Lewis County
Lincoln County
Mason County
Okanogan County
Pacific County
Pend Oreille County
Pierce County
San Juan County
Skagit County
Skamania County
Snohomish County
Spokane County
Stevens County
Thurston County
Wahkiakum County
Walla Walla County
Whatcom County
Whitman County
Yakima County
Choose Year
2012
2004
1980
1968
Choose Office
President
President
President
Senator
Governor
Lt. Governor
Choose State
Missouri
Oregon
West Virginia
Washington Election Results Home
-
National Results for 2000
-
Use Frame Navigation
Login
Terms of Use
-
DCMA Policy
-
Privacy Policy and Cookies
©
Dave Leip's Atlas of U.S. Elections, LLC 2019 All Rights Reserved


