Home
2024
Election Results
Election Info
Weblog
Forum
Wiki
Search
Email
Login
Site Info
Store
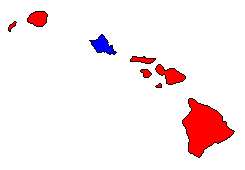
2002 Gubernatorial Democratic Primary Election Results - Hawaii
Note: The Google advertisement links below may advocate political positions that this site does not endorse.
Data for this Contest was Contributed by on 2007-02-15
Gubernatorial
Candidate
Political
Party
Popular Vote
Mazie K. Hirono
Democratic
76,709
41.24%
Ed Case
Democratic
74,096
39.84%
D. G. (Andy) Anderson
Democratic
33,384
17.95%
George Nitta, Jr.
Democratic
747
0.40%
Art P. Reyes
Democratic
568
0.31%
Joe Fernandez
Democratic
491
0.26%
Map Key
> 40%
> 50%
> 60%
> 70%
Turnout
Maps
Demographic Data
2010 Population:
1,360,301
Enum.
2010 Population Density:
81.9
persons/km
2
2002 Population:
1,239,613
Est.
2002 Population Density:
74.7
persons/km
2
2000 Population:
1,211,684
Enum.
2000 Population Density:
73.0
persons/km
2
Land Area (2000):
16,600
km
2
Annual Pop Growth Rate:
1.2
%
Election Data and Statistics:
County Data (Table)
(m)
County Data (Graphs)
Purchase Detailed Data
Compare State Maps by Year
View All 2002 Hawaii Maps
Election Tools
Atlas Forum
Image Code for Maps:
County
,
Pop
Data Sources:
Source for Popular Vote data: Hawaii Office of Elections.
Primary Election 2002 Results
, Hawaii Office of Elections (http://www.azsos.gov/results/2006/primary/REP-2000.htm) (accessed 14 Feb 2007)
Source for Population data: U.S. Census Bureau.
Results for and Individual County:
Hawaii County
Honolulu County
Kauai County
Maui County
Choose Year
2018
2014
2010
Choose Office
Choose State
Alabama
Arkansas
California
Florida
Idaho
Illinois
Michigan
Minnesota
Nebraska
Nevada
New Hampshire
New York
Oklahoma
Oregon
Pennsylvania
Texas
Wisconsin
Wyoming
Hawaii Election Results Home
-
National Results for 2002
-
Use Frame Navigation
Login
Terms of Use
-
DCMA Policy
-
Privacy Policy and Cookies
©
Dave Leip's Atlas of U.S. Elections, LLC 2019 All Rights Reserved


