Home
2024
Election Results
Election Info
Weblog
Forum
Wiki
Search
Email
Login
Site Info
Store
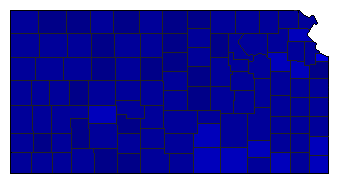
1998 Gubernatorial General Election Results - Kansas
Note: The Google advertisement links below may advocate political positions that this site does not endorse.
Gubernatorial
Candidate
Lt. Gubernatorial
Candidate
Political
Party
Popular Vote
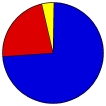
William Graves
Gary Sherrer
Republican
544,882
73.37%
Tom Sawyer
Elizabeth Baker
Democratic
168,243
22.65%
Kirt Poovey
Cedric Boehr
Taypayers
21,710
2.92%
Darrel King
Joyce Luschen
Reform
7,830
1.05%
Map Key
> 50%
> 60%
> 70%
> 80%
Turnout
Maps
Pop. (m)
Rep. (m)
Dem. (m)
Swg (m)
Tnd (m)
Demographic Data
2000 Population:
2,688,418
Enum.
2000 Population Density:
12.7
persons/km
2
1998 Population:
2,660,598
Est.
1998 Population Density:
12.6
persons/km
2
1990 Population:
2,477,588
Enum.
1990 Population Density:
11.7
persons/km
2
Land Area (2000):
211,900
km
2
Annual Pop Growth Rate:
0.8
%
Election Data and Statistics:
County Data (Table)
(m)
County Data (Graphs)
Purchase Detailed Data
Compare State Data by Year (Table)
Compare State Data by Year (Graphs)
View All 1998 Kansas Data
Compare State Maps by Year
View All 1998 Kansas Maps
Election Tools
Atlas Forum
Image Code for Maps:
County
,
Pop
,
Tnd
,
Swg
Data Sources:
Source for Popular Vote data: Kansas Secretary of State. Division of Elections and Legislative Matters.
1998 General Election Results
, Kansas Secretary of State. Division of Elections and Legislative Matters ( ) (accessed 23 Jun 1999)
Source for Population data: U.S. Census Bureau.
Results for and Individual County:
(m)
< 1994
Choose Year
2022
2018
2014
2010
2006
2002
1994
1990
1986
1982
1978
1974
1972
1970
1968
1966
1964
1962
1960
1958
1956
1954
1952
1950
1932
1930
1916
1914
1912
1910
1908
Choose Office
Senator
Secretary of State
State Treasurer
Attorney General
Insurance Commissioner
Choose State
Alabama
Alaska
Arizona
Arkansas
California
Colorado
Connecticut
Florida
Georgia
Hawaii
Idaho
Illinois
Iowa
Maine
Maryland
Massachusetts
Michigan
Minnesota
Nebraska
Nevada
New Hampshire
New Mexico
New York
Ohio
Oklahoma
Oregon
Pennsylvania
Rhode Island
South Carolina
South Dakota
Tennessee
Texas
Vermont
Wisconsin
Wyoming
2002 >
Kansas Election Results Home
-
National Results for 1998
-
Use Frame Navigation
Login
Terms of Use
-
DCMA Policy
-
Privacy Policy and Cookies
©
Dave Leip's Atlas of U.S. Elections, LLC 2019 All Rights Reserved


