Home
2024
Election Results
Election Info
Weblog
Forum
Wiki
Search
Email
Login
Site Info
Store
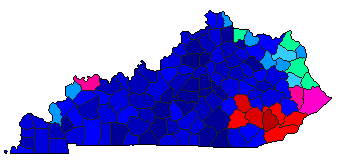
1975 Gubernatorial Republican Primary Election Results - Kentucky
Note: The Google advertisement links below may advocate political positions that this site does not endorse.
Data for this Contest was Contributed by on 2007-03-08
Gubernatorial
Candidate
Political
Party
Popular Vote
Robert E. Gable
Republican
38,113
51.34%
Elmer Begley, Jr.
Republican
16,855
22.70%
Tommy Klein
Republican
10,844
14.61%
Granville Thomas
Republican
8,426
11.35%
Map Key
> 20%
> 30%
> 40%
> 50%
> 60%
> 70%
> 80%
Turnout
Maps
Pop. (m)
Demographic Data
1980 Population:
3,660,324
Enum.
1980 Population Density:
35.6
persons/km
2
1975 Population:
0
Est.
1975 Population Density:
0.0
persons/km
2
1970 Population:
3,220,711
Enum.
1970 Population Density:
31.3
persons/km
2
Land Area (2000):
102,896
km
2
Annual Pop Growth Rate:
1.3
%
Election Data and Statistics:
County Data (Table)
(m)
County Data (Graphs)
Compare State Maps by Year
View All 1975 Kentucky Maps
Election Tools
Atlas Forum
Image Code for Maps:
County
,
Pop
Data Sources:
Source for Popular Vote data: Kentucky State Board of Elections.
Primary Election, May 27, 1975
, Kentucky State Board of Elections (http://elect.ky.gov/NR/rdonlyres/E9D2EDC3-A625-4971-A29C-4AB3307DB89E/6366/res_govltgov2.txt) (accessed 08 Mar 2007)
Source for Population data: U.S. Census Bureau.
Results for and Individual County:
(m)
Choose Year
2015
2011
2007
2003
1999
1995
1991
1987
1983
1979
Choose Office
Choose State
Kentucky Election Results Home
-
National Results for 1975
-
Use Frame Navigation
Login
Terms of Use
-
DCMA Policy
-
Privacy Policy and Cookies
©
Dave Leip's Atlas of U.S. Elections, LLC 2019 All Rights Reserved


