Home
2024
Election Results
Election Info
Weblog
Forum
Wiki
Search
Email
Login
Site Info
Store
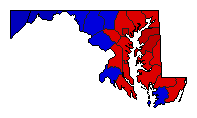
1946 Attorney General General Election Results - Maryland
Note: The Google advertisement links below may advocate political positions that this site does not endorse.
Data for this Contest was Contributed by on 2016-04-29
Attorney General
Candidate
Political
Party
Popular Vote
Hall Hammond
Democratic
245,772
55.72%
George Cochran Doub
Republican
195,273
44.28%
Map Key
> 40%
> 50%
> 60%
> 70%
Turnout
Maps
Election Notes:
Statewide vote the sum of county returns. Official source lists statewide Hammond vote as 245,782.
Demographic Data
1950 Population:
2,343,001
Enum.
1950 Population Density:
92.6
persons/km
2
1940 Population:
1,821,244
Enum.
1940 Population Density:
71.9
persons/km
2
Land Area (2000):
25,314
km
2
Annual Pop Growth Rate:
2.6
%
Election Data and Statistics:
County Data (Table)
(m)
County Data (Graphs)
(m)
Compare State Data by Year (Table)
Compare State Data by Year (Graphs)
View All 1946 Maryland Data
Compare State Maps by Year
View All 1946 Maryland Maps
Election Tools
Atlas Forum
Image Code for Maps:
County
Data Sources:
Source for Popular Vote data: Maryland Secretary of State.
Maryland Manual 1948-49
, Maryland Secretary of State (http://msa.maryland.gov/megafile/msa/speccol/sc2900/sc2908/000001/000162/pdf/am162--229.pdf) (accessed 5 Feb 2016)
Source for Population data: U.S. Census Bureau.
Results for and Individual County:
(m)
Choose Year
2022
2018
2014
2010
2006
2002
1998
1994
1990
1986
1982
1978
1974
1970
1966
1962
1958
1954
1950
1942
1938
1934
1930
1926
1923
1919
1915
Choose Office
Senator
Governor
Comptroller General
Choose State
Arizona
California
Colorado
Delaware
Minnesota
Nevada
New York
2022 >
Maryland Election Results Home
-
National Results for 1946
-
Use Frame Navigation
Login
Terms of Use
-
DCMA Policy
-
Privacy Policy and Cookies
©
Dave Leip's Atlas of U.S. Elections, LLC 2019 All Rights Reserved


