Home
2024
Election Results
Election Info
Weblog
Forum
Wiki
Search
Email
Login
Site Info
Store
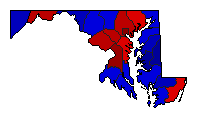
1998 Comptroller General General Election Results - Maryland
Note: The Google advertisement links below may advocate political positions that this site does not endorse.
Data for this Contest was Contributed by on 2011-02-24
Comptroller General
Candidate
Political
Party
Popular Vote
William Donald Schaefer
Democratic
924,053
62.01%
Larry M. Epstein
Republican
565,291
37.93%
Other (
+
)
-
856
0.06%
Map Key
> 50%
> 60%
> 70%
> 80%
Turnout
Maps
Pop. (m)
Demographic Data
2000 Population:
5,296,486
Enum.
2000 Population Density:
209.2
persons/km
2
1998 Population:
5,204,464
Est.
1998 Population Density:
205.6
persons/km
2
1990 Population:
4,780,753
Enum.
1990 Population Density:
188.9
persons/km
2
Land Area (2000):
25,314
km
2
Annual Pop Growth Rate:
1.0
%
Election Data and Statistics:
County Data (Table)
(m)
County Data (Graphs)
Purchase Detailed Data
Compare State Data by Year (Table)
Compare State Data by Year (Graphs)
View All 1998 Maryland Data
Compare State Maps by Year
View All 1998 Maryland Maps
Election Tools
Atlas Forum
Image Code for Maps:
County
,
Pop
Data Sources:
Source for Popular Vote data: Maryland State Board of Elections.
Comptroller Vote
, Maryland State Board of Elections (http://www.elections.state.md.us/elections/1998/results_1998/gacmp.html) (accessed 24 Feb 2011)
Source for Population data: U.S. Census Bureau.
Results for and Individual County:
(m)
Choose Year
2022
2018
2014
2010
2006
2002
1994
1990
1986
1982
1978
1974
1970
1966
1962
1958
1954
1950
1946
1942
1938
1934
1930
1926
1923
1921
1919
1917
1915
1913
Choose Office
Senator
Governor
Attorney General
Choose State
Connecticut
Florida
Illinois
New York
South Carolina
Texas
2022 >
Maryland Election Results Home
-
National Results for 1998
-
Use Frame Navigation
Login
Terms of Use
-
DCMA Policy
-
Privacy Policy and Cookies
©
Dave Leip's Atlas of U.S. Elections, LLC 2019 All Rights Reserved


