Home
2024
Election Results
Election Info
Weblog
Forum
Wiki
Search
Email
Login
Site Info
Store
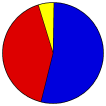
2010 Gubernatorial General Election Results
Note: The Google advertisement links below may advocate political positions that this site does not endorse.
Gubernatorial
Candidate
Political
Party
Popular Vote
Brian Sandoval
Republican
382,350
53.36%
Rory Reid
Democratic
298,171
41.61%
None of these Candidates
-
12,231
1.71%
Eugene DiSimone
Independent
6,403
0.89%
Floyd Fitzgibbons
Ind. Amercian
5,049
0.70%
Arthur F. Lampitt, Jr.
Libertarian
4,672
0.65%
David Scott Curtis
Green
4,437
0.62%
Aaron Y. Honig
Independent
3,216
0.45%
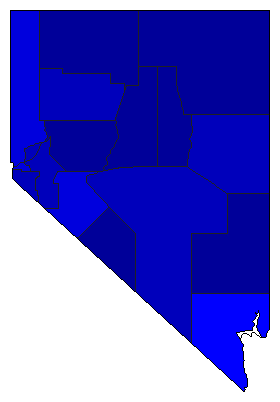
Map Key
> 40%
> 50%
> 60%
> 70%
Turnout
Maps
Demographic Data
2010 Population:
2,700,551
Enum.
2010 Population Density:
9.5
persons/km
2
2000 Population:
1,998,257
Enum.
2000 Population Density:
7.0
persons/km
2
Land Area (2000):
284,448
km
2
Annual Pop Growth Rate:
3.1
%
Election Data and Statistics:
County Data (Table)
(m)
County Data (Graphs)
Voter Registration & Turnout Data
(m)
Purchase Detailed Data
Compare State Data by Year (Table)
Compare State Data by Year (Graphs)
View All 2010 Nevada Data
Compare State Maps by Year
View All 2010 Nevada Maps
Election Tools
Atlas Forum
Image Code for Maps:
County
,
Pop
,
Tnd
,
Swg
Data Sources:
Source for Popular Vote data: Nevada Secretary of State.
2010 Official Statewide General Election Results November 2, 2010
, Nevada Secretary of State ( ) (accessed 25 Nov 2010)
Source for Population data: U.S. Census Bureau.
Results for and Individual County:
Churchill County
Clark County
Douglas County
Elko County
Esmeralda County
Eureka County
Humboldt County
Lander County
Lincoln County
Lyon County
Mineral County
Nye County
Pershing County
Storey County
Washoe County
White Pine County
Carson City City
The 2010 Campaign:
Pre-Election Polls
< 2006
Choose Year
2022
2018
2014
2006
2002
1998
1994
1990
1986
1982
1978
1974
1970
1966
1962
1958
1954
1950
1946
1942
1938
1934
1930
1926
1922
1918
1914
1910
1906
1902
1898
1894
1890
1886
1882
1878
1874
1870
1866
1864
Choose Office
Senator
Lt. Governor
Secretary of State
State Treasurer
Attorney General
Controller
Choose State
Alabama
Alaska
Arizona
Arkansas
California
Colorado
Connecticut
Florida
Georgia
Hawaii
Idaho
Illinois
Iowa
Kansas
Maine
Maryland
Massachusetts
Michigan
Minnesota
Nebraska
New Hampshire
New Mexico
New York
Ohio
Oklahoma
Oregon
Pennsylvania
Rhode Island
South Carolina
South Dakota
Tennessee
Texas
Utah
Vermont
Wisconsin
Wyoming
2014 >
Nevada Election Results Home
-
National Results for 2010
-
Use Frame Navigation
Login
Terms of Use
-
DCMA Policy
-
Privacy Policy and Cookies
©
Dave Leip's Atlas of U.S. Elections, LLC 2019 All Rights Reserved


