| |
Presidential
Candidate | Home State | Political
Party | Primary Vote | Delegates |
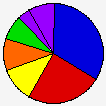
 | Paul E. Tsongas | Massachusetts | Democratic |
55,663 |
33.20% | 0 | 0.0% |
 | William J. Clinton | Arkansas | Democratic |
41,540 |
24.78% | 0 | 0.0% |
 | Robert Kerrey | Nebraska | Democratic |
18,584 |
11.08% | 0 | 0.0% |
 | Tom Harkin | Iowa | Democratic |
17,063 |
10.18% | 0 | 0.0% |
 | Edmund G. Brown | California | Democratic |
13,659 |
8.15% | 0 | 0.0% |
 | Write-ins | - | Democratic |
6,577 |
3.92% | 0 | 0.0% |
| Tom Laughlin | California | Democratic |
3,251 |
1.94% | 0 | 0.0% |
| Ralph Nader | Connecticut | Democratic |
3,054 |
1.82% | 0 | 0.0% |
| Charles Woods | Nevada | Democratic |
2,862 |
1.71% | 0 | 0.0% |
| Other (+) | - | Democratic |
5,411 |
3.23% | 0 | 0% |
 |
Map Key
| > 20% |
 |
 |
| > 30% |
 |
 |
| > 40% |
 |
|
| > 50% |
|
|
| > 60% |
|
|
| Turnout
 |  |  |
|
| Maps | 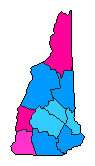 |  | | Pop. (m) | | Dem. (m) | | Dem. (m) | | Dem. (m) | | Dem. (m) | | Dem. (m) |
| |
| | Election Information: | | Contest Type: | State-run Primary | | Election Date: | 1992-02-18 | | Eligible Participants: | Closed (only members of the party) | | Delegates Awarded in this Contest: | 0 | | Delegates Total: | 0 | | Delegate Allocation Method: Statewide Winner-take-all |
|
| Demographic Data
| 2000 Population: | 1,235,786 | Enum. | 2000 Population Density: | 53.2 | persons/km2 | | 1992 Population: | 1,117,784 | Est. | 1992 Population Density: | 48.1 | persons/km2 | | 1990 Population: | 1,109,252 | Enum. | 1990 Population Density: | 47.8 | persons/km2 | | Total Delegates: | 0 | | Delegates Density: | | persons/Del | | Land Area (2000): | 23,227 | km2 | Annual Pop Growth Rate: | 1.1 | % |
| Election Data and Statistics:
| Election Tools
|
| |


