| |
Presidential
Candidate | Home State | Political
Party | Primary Vote | Delegates |
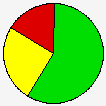
 | Mitt Romney | Massachusetts | Republican |
97,591 |
39.28% | 7 | 58.3% |
 | Ron Paul | Texas | Republican |
56,872 |
22.89% | 3 | 25.0% |
 | Jon Huntsman, Jr. | Utah | Republican |
41,964 |
16.89% | 2 | 16.7% |
 | Rick Santorum | Virginia | Republican |
23,432 |
9.43% | 0 | 0.0% |
 | Newt Gingrich | Virginia | Republican |
23,421 |
9.43% | 0 | 0.0% |
 | Rick Perry | Texas | Republican |
1,764 |
0.71% | 0 | 0.0% |
| Buddy Roemer | Louisiana | Republican |
950 |
0.38% | 0 | 0.0% |
| Other (+) | - | Republican |
2,481 |
1.00% | 0 | 0% |
 |
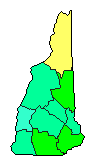
Map Key
| > 20% |
 |
|  | |
| > 30% |
|
|  |  |
| > 40% |
|
|  | |
| > 50% |
|
| | |
| > 60% |
|
| | |
| Turnout
 |  |  |
|
|
| | Election Information: | | Contest Type: | State-run Primary | | Election Date: | 2012-01-10 | | Eligible Participants: | Modified Open (members of the party or independents) | | Delegates Awarded in this Contest: | 12 | | Delegates Total: | 12 | | Statewide Delegates: Proportional - a 10% threshold is required to receive delegates. |
|
| Demographic Data
| 2012 Population: | 1,324,677 | Est. | 2012 Population Density: | 57.0 | persons/km2 | | 2010 Population: | 1,316,470 | Enum. | 2010 Population Density: | 56.7 | persons/km2 | | Total Delegates: | 12 | | Delegates Density: | 110,390 | persons/Del | | Land Area (2000): | 23,227 | km2 | Annual Pop Growth Rate: | 0.3 | % |
| Election Data and Statistics:
| Election Tools
|
| |


