Home
2024
Election Results
Election Info
Weblog
Forum
Wiki
Search
Email
Login
Site Info
Store
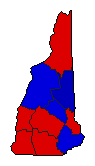
1974 Senatorial General Election Results - New Hampshire
Note: The Google advertisement links below may advocate political positions that this site does not endorse.
Data for this Contest was Contributed by on 2010-01-29
Senatorial
Candidate
Political
Party
Popular Vote
Louis Wyman
Republican
110,716
49.77%
John A. Durkin
Democratic
110,361
49.61%
Carmen C. Chimento
American Independent
1,327
0.60%
Scattering
-
35
0.02%
Map Key
> 40%
> 50%
> 60%
> 70%
Turnout
Maps
Pop. (m)
Election Notes:
Result prior to recounts.
Demographic Data
1980 Population:
920,610
Enum.
1980 Population Density:
39.6
persons/km
2
1974 Population:
0
Est.
1974 Population Density:
0.0
persons/km
2
1970 Population:
737,681
Enum.
1970 Population Density:
31.8
persons/km
2
Land Area (2000):
23,227
km
2
Annual Pop Growth Rate:
2.2
%
Election Data and Statistics:
County Data (Table)
(m)
County Data (Graphs)
Compare State Data by Year (Table)
Compare State Data by Year (Graphs)
View All 1974 New Hampshire Data
Compare State Maps by Year
View All 1974 New Hampshire Maps
Election Tools
Atlas Forum
Image Code for Maps:
County
,
Pop
Data Sources:
Source for Popular Vote data: New Hampshire Secretary of State.
New Hampshire Manual for the General Court, 1975
, New Hampshire Secretary of State (www.archive.org/details/manualforgeneral44newh) (accessed 29 Jan 2010)
Source for Population data: U.S. Census Bureau.
Results for and Individual County:
(m)
Choose Year
2022
2020
2016
2014
2010
2008
2004
2002
1998
1996
1992
1990
1986
1984
1980
1978
1972
1968
1966
1962
1960
1954
1950
1948
1942
1936
Choose Office
Governor
Choose State
Alabama
Alaska
Arizona
California
Colorado
Connecticut
Idaho
Illinois
Indiana
Iowa
Kansas
Kentucky
Maryland
Missouri
Nevada
North Dakota
Ohio
Oregon
Pennsylvania
South Carolina
South Dakota
Utah
Vermont
Washington
Wisconsin
1990 >
New Hampshire Election Results Home
-
National Results for 1974
-
Use Frame Navigation
Login
Terms of Use
-
DCMA Policy
-
Privacy Policy and Cookies
©
Dave Leip's Atlas of U.S. Elections, LLC 2019 All Rights Reserved


