Home
2024
Election Results
Election Info
Weblog
Forum
Wiki
Search
Email
Login
Site Info
Store
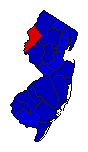
1969 Gubernatorial General Election Results - New Jersey
Note: The Google advertisement links below may advocate political positions that this site does not endorse.
Data for this Contest was Contributed by on 2013-02-26
Gubernatorial
Candidate
Political
Party
Popular Vote
William T. Cahill
Republican
1,411,905
59.66%
Robert B. Meyner
Democratic
911,003
38.49%
James E. Johnson
Independent
10,725
0.45%
Jack D. Alvino
Independent Candidate
10,149
0.43%
Winfred O. Perry
National Conservative
10,128
0.43%
Louis Vander Plate
Independent
6,611
0.28%
Julius Levin
Socialist Labor
6,085
0.26%
Map Key
> 40%
> 50%
> 60%
> 70%
Turnout
Maps
Demographic Data
1970 Population:
7,171,112
Enum.
1970 Population Density:
373.3
persons/km
2
1960 Population:
6,066,782
Enum.
1960 Population Density:
315.8
persons/km
2
Land Area (2000):
19,211
km
2
Annual Pop Growth Rate:
1.7
%
Election Data and Statistics:
County Data (Table)
(m)
County Data (Graphs)
Compare State Data by Year (Table)
Compare State Data by Year (Graphs)
View All 1969 New Jersey Data
Compare State Maps by Year
View All 1969 New Jersey Maps
Election Tools
Atlas Forum
Image Code for Maps:
County
Data Sources:
Source for Popular Vote data: New Jersey Secretary of State.
Results of the General Election Held November 4, 1969
, New Jersey Secretary of State (http://www.njelections.org/1920-1970-results/1969-general-election.pdf) (accessed 26 Feb 2013)
Source for Population data: U.S. Census Bureau.
Results for and Individual County:
(m)
Choose Year
2021
2017
2013
2009
2005
2001
1997
1993
1989
1985
1981
1977
1973
1965
1961
1957
1953
1949
1937
1934
1931
1928
1925
1907
1904
1901
1898
1895
1892
1889
1874
Choose Office
Choose State
Virginia
1993 >
New Jersey Election Results Home
-
National Results for 1969
-
Use Frame Navigation
Login
Terms of Use
-
DCMA Policy
-
Privacy Policy and Cookies
©
Dave Leip's Atlas of U.S. Elections, LLC 2019 All Rights Reserved


