| |
Presidential
Candidate | Vice Presidential
Candidate | Political
Party | Popular Vote | Electoral Vote |
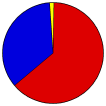
 | Barack H. Obama | Joseph R. Biden, Jr. | Democratic |
4,485,877 |
63.35% | 29 |
 | Willard Mitt Romney | Paul Ryan | Republican |
2,490,496 |
35.17% | 0 |
 | Gary Johnson | James P. Gray | Libertarian |
47,256 |
0.67% | 0 |
| Jill Stein | Cheri Honkala | Green |
39,984 |
0.56% | 0 |
| Other (+) | - | - |
17,923 |
0.25% | 0 |
 |
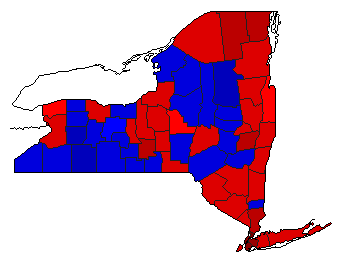
Map Key
| > 40% |
 |
 |
| > 50% |
 |
 |
| > 60% |
 |
 |
| > 70% |
 |
 |
| > 80% |
 |
|
| > 90% |
 |
|
| Turnout
 |  |  |
|
|
| Election Notes:
- Obama Vote is the Fusion of Democratic and Working Families Parties
- Romney Vote is the Fusion of Republican and Conservative Parties
- Vote totals are corrected from from Official Totals based on amended results in Rockland County (source: Rockland County Boards of Elections)
| Demographic Data
| 2012 Population: | 19,574,362 | Est. | 2012 Population Density: | 160.1 | persons/km2 | | 2010 Population: | 19,378,102 | Enum. | 2010 Population Density: | 158.5 | persons/km2 | | Total Electoral Vote: | 29 | | Electoral Vote Density: | 674,978 | persons/EV | | Land Area (2000): | 122,283 | km2 | Annual Pop Growth Rate: | 0.5 | % |
| Election Data and Statistics:
| Election Tools
- Atlas Forum Image Code for Maps: County, CD, Town, Pop, Prc, Tnd, Swg
Data Sources:
- Source for Popular Vote data: New York State Board of Elections. 2012 Election Results General Election Results - (Certification amended July 29, 2013), New York State Board of Elections (http://www.elections.ny.gov/NYSBOE/elections/2012/General/President_07292013.pdf
) (accessed 07 Aug 2013)
- Source for Population data: U.S. Census Bureau.
| Results for and Individual County:
| | Primary Documentation:
|
| The 2012 Campaign:
|
|
| |


