Home
2024
Election Results
Election Info
Weblog
Forum
Wiki
Search
Email
Login
Site Info
Store
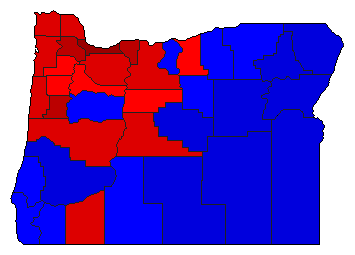
2016 Senatorial General Election Results
Note: The Google advertisement links below may advocate political positions that this site does not endorse.
Senatorial
Candidate
Political
Party
Popular Vote
Ronald L. Wyden
Democratic
1,105,119
56.60%
Mark Callahan
Republican
651,106
33.35%
Shanti S. Lewallen
Working Families
61,915
3.17%
Steven C. Reynolds
Independent
59,516
3.05%
Eric Navickas
Pacific Green
48,823
2.50%
Jim Lindsay
Libertarian
23,941
1.23%
Write-ins
-
2,058
0.11%
Map Key
> 40%
> 50%
> 60%
> 70%
Turnout
Maps
Election Data and Statistics:
County Data (Table)
(m)
County Data (Graphs)
Precinct Data
(m)
Precinct Data Search
(m)
Purchase Detailed Data
Compare State Data by Year (Table)
Compare State Data by Year (Graphs)
View All 2016 Oregon Data
Compare State Maps by Year
View All 2016 Oregon Maps
Election Tools
Atlas Forum
Image Code for Maps:
County
,
Pop
,
Prc
,
Tnd
,
Swg
Data Sources:
Source for Popular Vote data: Oregon Secretary of State Elections Division, "US Senator,"
November 8, 2016, General Election Abstract of Votes
(Salem, 2016)
Source for Population data: U.S. Census Bureau.
Results for and Individual County:
Baker County
Benton County
Clackamas County
Clatsop County
Columbia County
Coos County
Crook County
Curry County
Deschutes County
Douglas County
Gilliam County
Grant County
Harney County
Hood River County
Jackson County
Jefferson County
Josephine County
Klamath County
Lake County
Lane County
Lincoln County
Linn County
Malheur County
Marion County
Morrow County
Multnomah County
Polk County
Sherman County
Tillamook County
Umatilla County
Union County
Wallowa County
Wasco County
Washington County
Wheeler County
Yamhill County
The 2016 Campaign:
Pre-Election Polls
< 2014
Choose Year
2022
2020
2014
2010
2008
2004
2002
1998
1996
1992
1990
1986
1984
1980
1978
1974
1972
1968
1966
1962
1960
1956
1954
1950
1948
1944
1942
1938
1936
1932
1930
1926
1924
1920
1918
1914
1912
1908
1906
Choose Office
President
Governor
Secretary of State
State Treasurer
Attorney General
Choose State
Alabama Class 3
Alaska Class 3
Arizona Class 3
Arkansas Class 3
California Class 3
Colorado Class 3
Connecticut Class 3
Florida Class 3
Georgia Class 3
Hawaii Class 3
Idaho Class 3
Illinois Class 3
Indiana Class 3
Iowa Class 3
Kansas Class 3
Kentucky Class 3
Louisiana Class 3
Maryland Class 3
Missouri Class 3
Nevada Class 3
New Hampshire Class 3
New York Class 3
North Carolina Class 3
North Dakota Class 3
Ohio Class 3
Oklahoma Class 3
Pennsylvania Class 3
South Carolina Class 3
South Dakota Class 3
Utah Class 3
Vermont Class 3
Washington Class 3
Wisconsin Class 3
2020 >
Oregon Election Results Home
-
National Results for 2016
-
Use Frame Navigation
View Large Map Page for This Contest
Login
Terms of Use
-
DCMA Policy
-
Privacy Policy and Cookies
©
Dave Leip's Atlas of U.S. Elections, LLC 2019 All Rights Reserved


