| |
Presidential
Candidate | Home State | Political
Party | Primary Vote | Delegates |
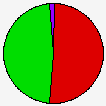
 | Hillary Clinton | New York | Democratic |
1,462,734 |
50.88% | 65 | 40.4% |
 | Barack Obama | Illinois | Democratic |
1,362,476 |
47.39% | 61 | 37.9% |
 | John Edwards | North Carolina | Democratic |
29,936 |
1.04% | 0 | 0.0% |
| Bill Richardson | New Mexico | Democratic |
10,773 |
0.37% | 0 | 0.0% |
| Other (+) | - | Democratic |
9,067 |
0.32% | 0 | 0% |
 | Unallocated | - | Democratic |
- |
- | 35 | 21.7% |
 |
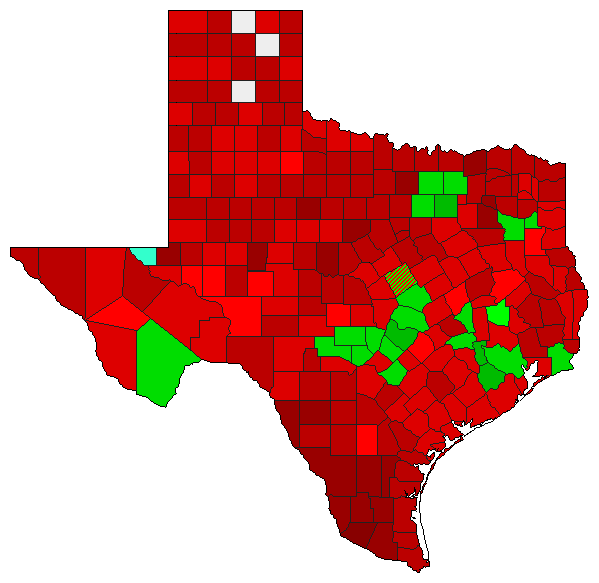
Map Key
| > 40% |
 |
 |  |
| > 50% |
 |
|  |
| > 60% |
 |
|  |
| > 70% |
 |
| |
| > 80% |
 |
| |
| Turnout
 |  |  |
|
|
| | Election Information: | | Contest Type: | State-run Primary | | Election Date: | 2008-03-04 | | Eligible Participants: | Open (all voters) | | Delegates Awarded in this Contest: | 126 | | Delegates Total: | 228 | | Delegate Allocation Method: Proportional - the candidates are awarded delegates in proportion to the percentage of votes received. A 15% threshold is required to receive delegates. |
- 126 district delegates (State Senate districts)
- 67 at-large delegates are chosen at the State Convention June 6-7
- 35 unpledged delegates
- 2 delegates from SD 31
- 3 delegates from SDs 6, 7, 8, 9, 24, 28
- 4 delegates from SDs 1, 2, 3, 4, 5, 11, 12, 15, 16, 17, 18, 19, 22, 25, 27, 29, 30
- 5 delegates from SDs 10, 20, 21, 26
- 6 delegates from SDs 14, 23
- 7 delegates from SD 13
|
|
| Demographic Data
| 2010 Population: | 25,145,561 | Enum. | 2010 Population Density: | 37.1 | persons/km2 | | 2008 Population: | 24,309,039 | Est. | 2008 Population Density: | 35.9 | persons/km2 | | 2000 Population: | 20,851,820 | Enum. | 2000 Population Density: | 30.8 | persons/km2 | | Total Delegates: | 161.0 | | Delegates Density: | 150,988 | persons/Del | | Land Area (2000): | 678,051 | km2 | Annual Pop Growth Rate: | 1.9 | % |
| Election Data and Statistics:
| Election Tools
|
| |
| |
Presidential
Candidate | Home State | Political
Party | Caucus Result | Delegates |
| Barack Obama | Illinois | Democratic |
23,907 |
56.18% | 0 | 0.0% |
| Hillary Clinton | New York | Democratic |
18,603 |
43.72% | 0 | 0.0% |
| Other (+) | - | Democratic |
44 |
0.10% | 0 | 0% |
|
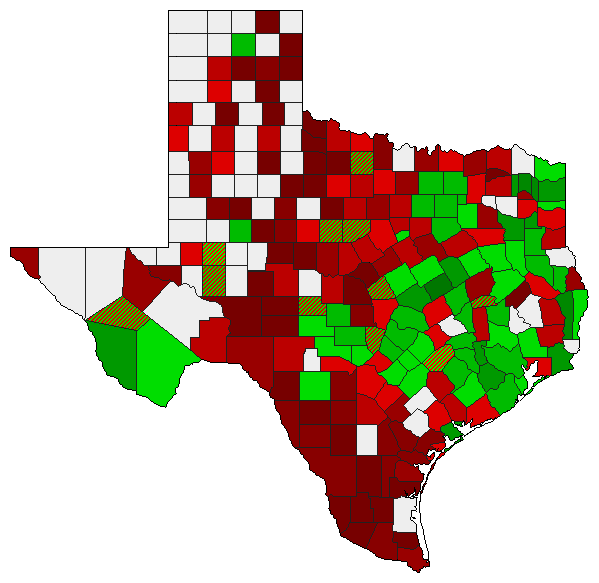
Map Key
| > 40% |
|
| |
| > 50% |
|
| |
| > 60% |
|
| |
| > 70% |
|
|  |
| > 80% |
|
|  |
| > 90% |
 |
|  |
| Turnout
|  |  |
|
|
| | Election Information: | | Contest Type: | Party-run Caucus/Convention | | Caucus Date: | 2008-03-04 | | Eligible Participants: | Open (all voters) | | Delegates Awarded in this Contest: | 0 | | Delegates Total: | 228 | | Delegate Allocation Method: Proportional - the candidates are awarded delegates in proportion to the percentage of votes received. A 15% threshold is required to receive delegates. |
|
| Demographic Data
| 2010 Population: | 25,145,561 | Enum. | 2010 Population Density: | 37.1 | persons/km2 | | 2008 Population: | 24,309,039 | Est. | 2008 Population Density: | 35.9 | persons/km2 | | 2000 Population: | 20,851,820 | Enum. | 2000 Population Density: | 30.8 | persons/km2 | | Total Delegates: | 0.0 | | Delegates Density: | 150,988 | persons/Del | | Land Area (2000): | 678,051 | km2 | Annual Pop Growth Rate: | 1.9 | % |
| Election Data and Statistics:
| Election Tools
|
| |
| |
Presidential
Candidate | Home State | Political
Party | County Convention
Vote | Delegates |
| Barack Obama | Illinois | Democratic |
3,982 |
54.94% | 37 | 55.2% |
| Hillary Clinton | New York | Democratic |
3,252 |
44.87% | 30 | 44.8% |
| Uncommitted | - | Democratic |
14 |
0.19% | 0 | 0.0% |
|
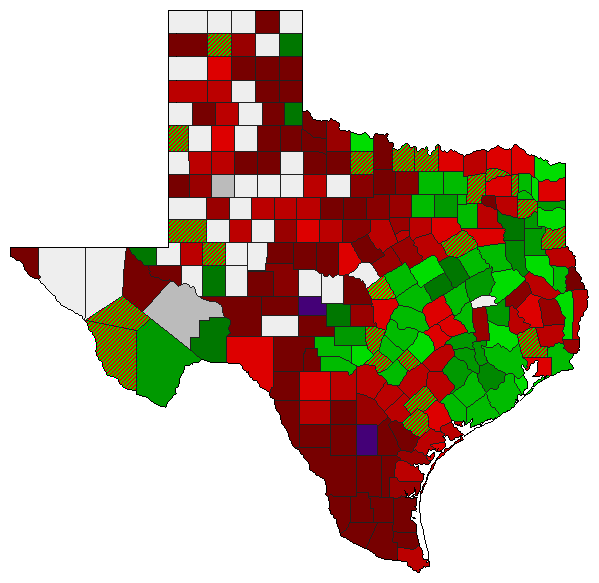
Map Key
| > 40% |
|
| |
| > 50% |
|
| |
| > 60% |
|
| |
| > 70% |
|
| |
| > 80% |
|
| |
| > 90% |
|
| |
| Turnout
|  |  |
|
|
| | Election Information: | | Contest Type: | Party-run County Conventions | | Eligible Participants: | Open (all voters) | | Delegates Awarded in this Contest: | 67 | | Delegates Total: | 228 | | Delegate Allocation Method: Proportional - the candidates are awarded delegates in proportion to the percentage of votes received. A 15% threshold is required to receive delegates. |
|
| Demographic Data
| 2010 Population: | 25,145,561 | Enum. | 2010 Population Density: | 37.1 | persons/km2 | | 2008 Population: | 24,309,039 | Est. | 2008 Population Density: | 35.9 | persons/km2 | | 2000 Population: | 20,851,820 | Enum. | 2000 Population Density: | 30.8 | persons/km2 | | Total Delegates: | 67.0 | | Delegates Density: | 362,821 | persons/Del | | Land Area (2000): | 678,051 | km2 | Annual Pop Growth Rate: | 1.9 | % |
| Election Data and Statistics:
| Election Tools
|
| |
|


