Home
2024
Election Results
Election Info
Weblog
Forum
Wiki
Search
Email
Login
Site Info
Store
1996 Gubernatorial General Election Results - Utah
Note: The Google advertisement links below may advocate political positions that this site does not endorse.
Gubernatorial
Candidate
Lt. Gubernatorial
Candidate
Political
Party
Popular Vote
Leavitt
Walker
Republican
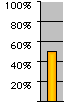
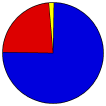
503,693
74.97%
Bradly
Holweg
Democratic
156,616
23.31%
Larsen
Harris
Independent American
4,741
0.71%
Richards
Little
Independent
3,845
0.57%
Lesh
Shields
Natural Law
2,969
0.44%
Metzger
Agin
Write-in
15
0.00%
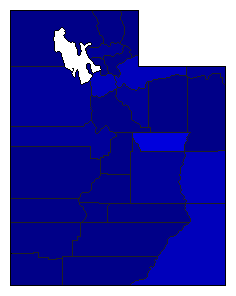
Map Key
> 50%
> 60%
> 70%
> 80%
Turnout
Maps
Pop. (m)
Rep. (m)
Dem. (m)
Swg (m)
Tnd (m)
Demographic Data
2000 Population:
2,233,169
Enum.
2000 Population Density:
10.5
persons/km
2
1996 Population:
2,067,976
Est.
1996 Population Density:
9.7
persons/km
2
1990 Population:
1,722,850
Enum.
1990 Population Density:
8.1
persons/km
2
Land Area (2000):
212,751
km
2
Annual Pop Growth Rate:
2.6
%
Election Data and Statistics:
County Data (Table)
(m)
County Data (Graphs)
Voter Registration & Turnout Data
(m)
Purchase Detailed Data
Compare State Data by Year (Table)
Compare State Data by Year (Graphs)
View All 1996 Utah Data
Compare State Maps by Year
View All 1996 Utah Maps
Election Tools
Atlas Forum
Image Code for Maps:
County
,
Pop
,
Tnd
,
Swg
Data Sources:
Source for Popular Vote data: Utah State Elections Office, "Governor & Lt. Governor,"
Official Results State of Utah General Election November 5, 1996
(Salt Lake City, 1996)
Source for Population data: U.S. Census Bureau.
Results for and Individual County:
(m)
< 1992
Choose Year
2020
2016
2012
2010
2008
2004
2000
1992
1988
1984
1980
1976
1972
1968
1964
1960
1948
1944
1940
1928
1924
1920
1916
1912
1908
Choose Office
President
State Treasurer
Attorney General
State Auditor
Choose State
Delaware
Indiana
Missouri
Montana
New Hampshire
North Carolina
North Dakota
Vermont
Washington
West Virginia
2000 >
Utah Election Results Home
-
National Results for 1996
-
Use Frame Navigation
Login
Terms of Use
-
DCMA Policy
-
Privacy Policy and Cookies
©
Dave Leip's Atlas of U.S. Elections, LLC 2019 All Rights Reserved


