Home
2024
Election Results
Election Info
Weblog
Forum
Wiki
Search
Email
Login
Site Info
Store
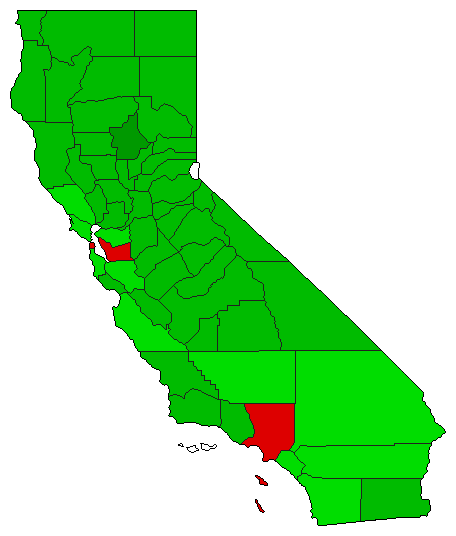
1986 Referendum General Election Results - California
Note: The Google advertisement links below may advocate political positions that this site does not endorse.
Data for this Contest was Contributed by on 2009-09-20
Referendum: Proposition 49 (Parties not allowed to endorse candidates for non-partisan offices)
Popular Vote
Yes
2,292,678
55.95%
No
1,805,305
44.05%
Map Key
> 40%
> 50%
> 60%
> 70%
Turnout
Maps
Pop. (m)
Demographic Data
1990 Population:
29,785,857
Enum.
1990 Population Density:
73.7
persons/km
2
1986 Population:
0
Est.
1986 Population Density:
0.0
persons/km
2
1980 Population:
23,667,765
Enum.
1980 Population Density:
58.6
persons/km
2
Land Area (2000):
403,933
km
2
Annual Pop Growth Rate:
2.3
%
Election Data and Statistics:
County Data (Table)
(m)
County Data (Graphs)
Purchase Detailed Data
Compare State Data by Year (Table)
Compare State Data by Year (Graphs)
View All 1986 California Data
Compare State Maps by Year
View All 1986 California Maps
Election Tools
Atlas Forum
Image Code for Maps:
County
,
Pop
Data Sources:
Source for Popular Vote data: California Secretary of State,
California Statement of Vote June 3, 1986
(Sacramento, 1986)
Source for Population data: U.S. Census Bureau.
Results for and Individual County:
(m)
Choose Year
2022
2022
2022
2022
2022
2018
2018
2018
2018
2018
2018
2016
2016
2016
2016
2008
2008
2008
2008
2006
2006
2002
2002
2002
2000
1998
1998
1998
1998
1990
1990
1990
1990
1990
1916
1916
1916
1908
1859
Choose Office
Senator
Governor
Lt. Governor
Secretary of State
State Treasurer
Attorney General
Controller
Choose State
Florida
Idaho
Idaho
Idaho
Idaho
Kentucky
Kentucky
Washington
California Election Results Home
-
National Results for 1986
-
Use Frame Navigation
Login
Terms of Use
-
DCMA Policy
-
Privacy Policy and Cookies
©
Dave Leip's Atlas of U.S. Elections, LLC 2019 All Rights Reserved


