| |
Presidential
Candidate | Vice Presidential
Candidate | Political
Party | Popular Vote | Electoral Vote |
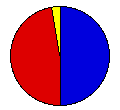
 | Herbert Hoover | Charles Curtis | Republican |
2,193,344 |
49.79% | 45 |
 | Alfred Smith | Joseph Robinson | Democrat |
2,089,863 |
47.44% | 0 |
 | Norman Thomas | James Maurer | Socialist |
107,332 |
2.44% | 0 |
| Other (+) | - | - |
15,087 |
0.34% | 0 |
 |
Map Key
| Turnout
 |  |  |
|
| Maps | County Map (m) |  | | Rep. (m) | | Dem. (m) | | Swg (m) | | Tnd (m) |
| |
| Demographic Data
| 1930 Population: | 12,588,066 | Enum. | 1930 Population Density: | 102.9 | persons/km2 | | 1920 Population: | 10,385,227 | Enum. | 1920 Population Density: | 84.9 | persons/km2 | | Total Electoral Vote: | 45 | | | Land Area (2000): | 122,283 | km2 | Annual Pop Growth Rate: | 1.9 | % |
| Election Data and Statistics:
- County Data (Table) (m)
- County Data (Graphs) (m)
|
| | Election Tools
- Atlas Forum Image Code for Maps: County, Tnd, Swg
Data Sources:
- Source for Popular Vote data: New York State Department of State, "Presidential Vote, New York State By Counties, November 6, 1928," Manual for the Use of the Legislature of the State of New York 1929 (Albany, 1929)
- Source for Population data: U.S. Census Bureau.
| Results for and Individual County:
|
|
| |


