Home
2024
Election Results
Election Info
Weblog
Forum
Wiki
Search
Email
Login
Site Info
Store
1992 Senatorial General Election Results - Wisconsin
Note: The Google advertisement links below may advocate political positions that this site does not endorse.
Senatorial
Candidate
Political
Party
Popular Vote
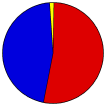
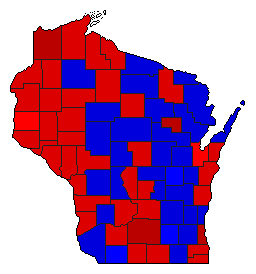
Russell D. Feingold
Democratic
1,290,662
52.57%
Robert W. Kasten, Jr.
Republican
1,129,599
46.01%
Patrick W. Johnson
For the Little Guy
16,513
0.67%
William Bittner
Libertarian
9,147
0.37%
Other (
+
)
-
9,203
0.37%
Map Key
> 40%
> 50%
> 60%
> 70%
Turnout
Maps
Pop. (m)
Dem. (m)
Rep. (m)
Demographic Data
2000 Population:
5,363,675
Enum.
2000 Population Density:
38.1
persons/km
2
1992 Population:
5,025,398
Est.
1992 Population Density:
35.7
persons/km
2
1990 Population:
4,891,769
Enum.
1990 Population Density:
34.8
persons/km
2
Land Area (2000):
140,663
km
2
Annual Pop Growth Rate:
0.9
%
Election Data and Statistics:
County Data (Table)
(m)
County Data (Graphs)
Purchase Detailed Data
Compare State Data by Year (Table)
Compare State Data by Year (Graphs)
View All 1992 Wisconsin Data
Compare State Maps by Year
View All 1992 Wisconsin Maps
Election Tools
Atlas Forum
Image Code for Maps:
County
,
Pop
Data Sources:
Source for Popular Vote data: Wisconsin Legislative Reference Bureau, "General Election, November 3, 1992 Vote for United States Senator, By County,"
State of Wisconsin Blue Book 1993-1994
(Madison, 1993)
Source for Population data: U.S. Census Bureau.
Results for and Individual County:
(m)
Choose Year
2022
2018
2016
2012
2010
2006
2004
2000
1998
1994
1988
1986
1982
1980
1976
1974
1970
1968
1964
1958
1956
1952
1950
1946
1944
1938
1934
1922
1920
Choose Office
President
Choose State
Alabama Class 3
Alaska Class 3
Arizona Class 3
Arkansas Class 3
California Class 1
California Class 3
Colorado Class 3
Connecticut Class 3
Florida Class 3
Georgia Class 3
Hawaii Class 3
Idaho Class 3
Illinois Class 3
Indiana Class 3
Iowa Class 3
Kansas Class 3
Kentucky Class 3
Louisiana Class 3
Maryland Class 3
Missouri Class 3
Nevada Class 3
New Hampshire Class 3
New York Class 3
North Carolina Class 3
North Dakota Class 1
North Dakota Class 3
Ohio Class 3
Oklahoma Class 3
Oregon Class 3
Pennsylvania Class 3
South Carolina Class 3
South Dakota Class 3
Utah Class 3
Vermont Class 3
Washington Class 3
1994 >
Wisconsin Election Results Home
-
National Results for 1992
-
Use Frame Navigation
Login
Terms of Use
-
DCMA Policy
-
Privacy Policy and Cookies
©
Dave Leip's Atlas of U.S. Elections, LLC 2019 All Rights Reserved


