Home
2024
Election Results
Election Info
Weblog
Forum
Wiki
Search
Email
Login
Site Info
Store
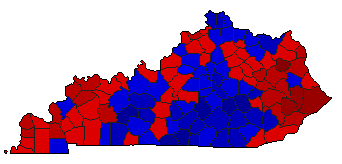
1995 Gubernatorial General Election Results - Kentucky
Note: The Google advertisement links below may advocate political positions that this site does not endorse.
Gubernatorial
Candidate
Lt. Gubernatorial
Candidate
Political
Party
Popular Vote
Paul Patton
Stephen Henry
Democrat
500,605
50.88%
Larry Forgy
Tom Handy
Republican
479,227
48.71%
G. Galbraith
Jerry Hammond
Write-in
3,965
0.40%
Map Key
> 40%
> 50%
> 60%
> 70%
> 80%
Turnout
Maps
Pop. (m)
Dem. (m)
Rep. (m)
Swg (m)
Tnd (m)
Demographic Data
2000 Population:
4,041,769
Enum.
2000 Population Density:
39.3
persons/km
2
1995 Population:
3,887,427
Est.
1995 Population Density:
37.8
persons/km
2
1990 Population:
3,686,892
Enum.
1990 Population Density:
35.8
persons/km
2
Land Area (2000):
102,896
km
2
Annual Pop Growth Rate:
0.9
%
Election Data and Statistics:
County Data (Table)
(m)
County Data (Graphs)
Purchase Detailed Data
Compare State Data by Year (Table)
Compare State Data by Year (Graphs)
View All 1995 Kentucky Data
Compare State Maps by Year
View All 1995 Kentucky Maps
Election Tools
Atlas Forum
Image Code for Maps:
County
,
Pop
,
Tnd
,
Swg
Data Sources:
Source for Popular Vote data: Kentucky State Board of Elections.
1995 General Election Results Governor/Lt/Governor
, Kentucky State Board of Elections ( ) (accessed 17 Nov 2005)
Source for Population data: U.S. Census Bureau.
Results for and Individual County:
(m)
< 1991
Choose Year
2023
2019
2015
2011
2007
2003
1999
1991
1987
1983
1979
1975
1971
1967
1899
Choose Office
Secretary of State
State Treasurer
Attorney General
State Auditor
Agriculture Commissioner
Choose State
Louisiana
Mississippi
1999 >
Kentucky Election Results Home
-
National Results for 1995
-
Use Frame Navigation
Login
Terms of Use
-
DCMA Policy
-
Privacy Policy and Cookies
©
Dave Leip's Atlas of U.S. Elections, LLC 2019 All Rights Reserved


