Home
2024
Election Results
Election Info
Weblog
Forum
Wiki
Search
Email
Login
Site Info
Store
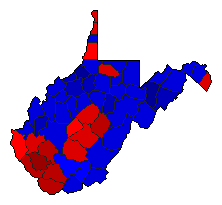
1996 Gubernatorial General Election Results - West Virginia
Note: The Google advertisement links below may advocate political positions that this site does not endorse.
Gubernatorial
Candidate
Political
Party
Popular Vote
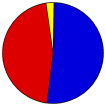
Cecil H. Underwood
Republican
324,518
51.63%
Charlotte Pritt
Democratic
287,870
45.80%
Wallace Johnson
Libertarian
16,171
2.57%
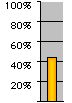
Map Key
> 40%
> 50%
> 60%
> 70%
Turnout
Maps
Pop. (m)
Rep. (m)
Dem. (m)
Swg (m)
Tnd (m)
Demographic Data
2000 Population:
1,808,344
Enum.
2000 Population Density:
29.0
persons/km
2
1996 Population:
1,822,808
Est.
1996 Population Density:
29.2
persons/km
2
1990 Population:
1,793,477
Enum.
1990 Population Density:
28.8
persons/km
2
Land Area (2000):
62,361
km
2
Annual Pop Growth Rate:
0.1
%
Election Data and Statistics:
County Data (Table)
(m)
County Data (Graphs)
Voter Registration & Turnout Data
(m)
Purchase Detailed Data
Compare State Data by Year (Table)
Compare State Data by Year (Graphs)
View All 1996 West Virginia Data
Compare State Maps by Year
View All 1996 West Virginia Maps
Election Tools
Atlas Forum
Image Code for Maps:
County
,
Pop
,
Tnd
,
Swg
Data Sources:
Source for Popular Vote data: West Virginia Secretary of State.
1996 Gubernatorial General
, West Virginia Secretary of State ( ) (accessed X)
Source for Population data: U.S. Census Bureau.
Results for and Individual County:
(m)
< 1992
Choose Year
2020
2016
2012
2011
2008
2004
2000
1992
1988
1984
1980
1976
1972
1968
1964
1960
1956
1952
1912
Choose Office
President
Senator
Secretary of State
Agriculture Commissioner
Choose State
Delaware
Indiana
Missouri
Montana
New Hampshire
North Carolina
North Dakota
Utah
Vermont
Washington
2000 >
West Virginia Election Results Home
-
National Results for 1996
-
Use Frame Navigation
Login
Terms of Use
-
DCMA Policy
-
Privacy Policy and Cookies
©
Dave Leip's Atlas of U.S. Elections, LLC 2019 All Rights Reserved


