Home
2024
Election Results
Election Info
Weblog
Forum
Wiki
Search
Email
Login
Site Info
Store
1998 Gubernatorial General Election Results - Michigan
Note: The Google advertisement links below may advocate political positions that this site does not endorse.
Gubernatorial
Candidate
Lt. Gubernatorial
Candidate
Political
Party
Popular Vote
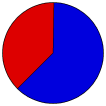
John Engler
Dick Posthumus
Republican
1,883,005
62.20%
Geoffrey Fieger
Jim Agee
Democratic
1,143,574
37.78%
Write-ins
-
Write-ins
525
0.02%
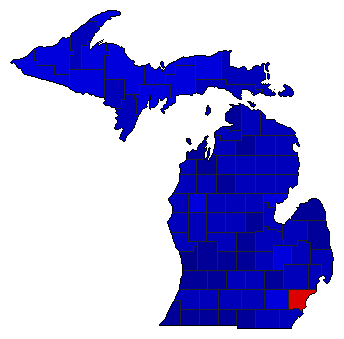
Map Key
> 50%
> 60%
> 70%
> 80%
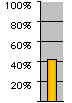
Turnout
Maps
Pop. (m)
Rep. (m)
Dem. (m)
Swg (m)
Tnd (m)
Demographic Data
2000 Population:
9,938,444
Enum.
2000 Population Density:
67.6
persons/km
2
1998 Population:
9,847,942
Est.
1998 Population Density:
66.9
persons/km
2
1990 Population:
9,295,287
Enum.
1990 Population Density:
63.2
persons/km
2
Land Area (2000):
147,121
km
2
Annual Pop Growth Rate:
0.7
%
Election Data and Statistics:
County Data (Table)
(m)
County Data (Graphs)
Purchase Detailed Data
Compare State Data by Year (Table)
Compare State Data by Year (Graphs)
View All 1998 Michigan Data
Compare State Maps by Year
View All 1998 Michigan Maps
Election Tools
Atlas Forum
Image Code for Maps:
County
,
Pop
,
Tnd
,
Swg
Data Sources:
Source for Popular Vote data: Michigan Legislative Service Bureau.
1998 Official Michigan General Election Results
, Michigan Legislative Service Bureau ( ) (accessed 08 Nov 2002)
Source for Population data: U.S. Census Bureau.
Results for and Individual County:
(m)
< 1994
Choose Year
2022
2018
2014
2010
2006
2002
1994
1990
1986
1982
1978
1974
1970
1966
1964
1962
1960
1958
1956
1954
1952
1950
1948
1946
1944
1942
1940
1938
1936
1934
1932
1930
1928
1926
1924
1922
1920
1918
1916
1914
1912
1910
1908
1906
1904
1902
1900
1898
1896
Choose Office
Secretary of State
Attorney General
To change 'Handicapped' to 'Disabled' in the State Constitution
State Proposal - Proposal C - To Authorize Bonds for Environmental & Natural Res. Protection Programs
Proposal B - To Legalize Prescription of Lethal Medication to Terminally Ill
Choose State
Alabama
Alaska
Arizona
Arkansas
California
Colorado
Connecticut
Florida
Georgia
Hawaii
Idaho
Illinois
Iowa
Kansas
Maine
Maryland
Massachusetts
Minnesota
Nebraska
Nevada
New Hampshire
New Mexico
New York
Ohio
Oklahoma
Oregon
Pennsylvania
Rhode Island
South Carolina
South Dakota
Tennessee
Texas
Vermont
Wisconsin
Wyoming
2002 >
Michigan Election Results Home
-
National Results for 1998
-
Use Frame Navigation
Login
Terms of Use
-
DCMA Policy
-
Privacy Policy and Cookies
©
Dave Leip's Atlas of U.S. Elections, LLC 2019 All Rights Reserved


