2000 Presidential General Election Results - Maryland
Note: The Google advertisement links below may advocate political positions that this site does not endorse.
  Presidential
Candidate
Vice Presidential
Candidate
Political
Party
Popular VoteElectoral Vote
Albert Gore Jr.Joseph LiebermanDemocratic 1,145,782 56.57%10
George W. BushRichard CheneyRepublican 813,797 40.18%0
Ralph NaderWinona LaDukeGreen 53,768 2.65%0
Harry BrowneArt OlivierLibertarian 5,310 0.26%0
YOther (+) - - 6,823 0.34%0
Seal Map Key
 > 40%
 > 50%
 > 60%
 > 70%
 > 80%
Turnout
Voter Turnout Graph
Vote Pie ChartState Seal
Maps
  2000 Maryland County Map of General Election Results for President  
County Button
2000 Button
Pop Button
Cong Dist Button
Per Vote Democratic Button
Per Vote Republican Button
Swing Map Button
Trend Map Button
 
Demographic Data

2000 Population:5,296,486Enum.2000 Population Density:209.2persons/km2
1990 Population:4,780,753Enum.1990 Population Density:188.9persons/km2
Total Electoral Vote:10Electoral Vote Density:529,649persons/EV
Land Area (2000):25,314km2Annual Pop Growth Rate:1.0%

Presidential Electors:
Election Data and Statistics:
Election Tools
Data Sources:
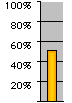
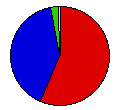
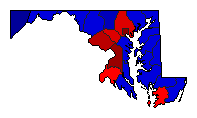
  • Source for Popular Vote data: Maryland State Board of Elections. Official results, sorted by office, congressional district and party, for the November 7, 2000 Presidential General Election., Maryland State Board of Elections ( ) (accessed 11 Jul 2001)
  • Source for Population data: U.S. Census Bureau.
Results for and Individual County:
Primary Documentation:
  • 2000 Certificate of Ascertainment (m)
  • 2000 Certificate of Vote (m)


Allegany County Anne Arundel County Baltimore City Baltimore County Calvert County Caroline County Carroll County Cecil County Charles County Dorchester County Frederick County Garrett County Harford County Howard County Kent County Montgomery County Prince George's County Queen Anne's County St. Mary's County Somerset County Talbot County Washington County Wicomico County Worcester County