| |
Presidential
Candidate | Vice Presidential
Candidate | Political
Party | Popular Vote | Electoral Vote |
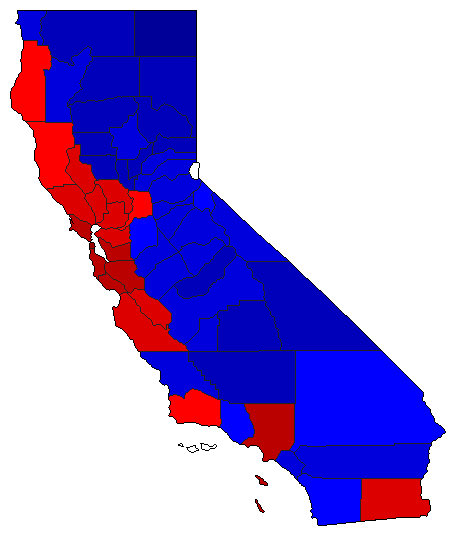
 | Albert Gore Jr. | Joseph Lieberman | Democratic |
5,861,203 |
53.45% | 54 |
 | George W. Bush | Richard Cheney | Republican |
4,567,429 |
41.65% | 0 |
 | Ralph Nader | Winona LaDuke | Green |
418,707 |
3.82% | 0 |
 | Harry Browne | Art Olivier | Libertarian |
45,520 |
0.42% | 0 |
| Patrick Buchanan | Ezola Foster | Reform |
44,987 |
0.41% | 0 |
| Other (+) | - | - |
28,010 |
0.26% | 0 |
 |
Map Key
| Turnout
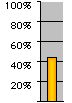 |  |  |
|
|
| Demographic Data
| 2000 Population: | 33,871,648 | Enum. | 2000 Population Density: | 83.9 | persons/km2 | | 1990 Population: | 29,785,857 | Enum. | 1990 Population Density: | 73.7 | persons/km2 | | Total Electoral Vote: | 54 | | Electoral Vote Density: | 627,253 | persons/EV | | Land Area (2000): | 403,933 | km2 | Annual Pop Growth Rate: | 1.3 | % |
| Presidential Electors:
| Election Data and Statistics:
| Election Tools
- Atlas Forum Image Code for Maps: County, CD, Pop, Prc, Tnd, Swg
Data Sources:
- Source for Popular Vote data: California Secretary of State, Statement of Vote November 7, 2000 General Election (Sacramento, 2000)
- Source for Population data: U.S. Census Bureau.
| Results for and Individual County:
| Primary Documentation:
- 2000 Certificate of Ascertainment (m)
- 2000 Certificate of Vote (m)
|
|
| |


