Home
2024
Election Results
Election Info
Weblog
Forum
Wiki
Search
Email
Login
Site Info
Store
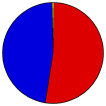
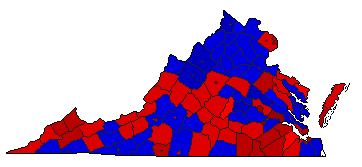
2001 Gubernatorial General Election Results - Virginia
Note: The Google advertisement links below may advocate political positions that this site does not endorse.
Gubernatorial
Candidate
Political
Party
Popular Vote
Mark Warner
Democratic
984,177
52.16%
Mark Earley
Republican
887,234
47.03%
William Redpath
Libertarian
14,497
0.77%
-
Write-in
813
0.04%
Map Key
> 40%
> 50%
> 60%
> 70%
> 80%
Turnout
Maps
Demographic Data
2010 Population:
8,001,024
Enum.
2010 Population Density:
78.0
persons/km
2
2001 Population:
7,198,362
Est.
2001 Population Density:
70.2
persons/km
2
2000 Population:
7,078,515
Enum.
2000 Population Density:
69.0
persons/km
2
Land Area (2000):
102,548
km
2
Annual Pop Growth Rate:
1.2
%
Election Data and Statistics:
County Data (Table)
(m)
County Data (Graphs)
Purchase Detailed Data
Compare State Data by Year (Table)
Compare State Data by Year (Graphs)
View All 2001 Virginia Data
Compare State Maps by Year
View All 2001 Virginia Maps
Election Tools
Atlas Forum
Image Code for Maps:
County
,
Pop
,
Tnd
,
Swg
Data Sources:
Source for Popular Vote data: Virginia State Board of Elections.
Official Election Results - Governor
, Virginia State Board of Elections ( ) (accessed 17 Sep 2005)
Source for Population data: U.S. Census Bureau.
Results for and Individual County:
Accomack County
Albemarle County
Alleghany County
Amelia County
Amherst County
Appomattox County
Arlington County
Augusta County
Bath County
Bedford County
Bland County
Botetourt County
Brunswick County
Buchanan County
Buckingham County
Campbell County
Caroline County
Carroll County
Charles City County
Charlotte County
Chesterfield County
Clarke County
Craig County
Culpeper County
Cumberland County
Dickenson County
Dinwiddie County
Essex County
Fairfax County
Fauquier County
Floyd County
Fluvanna County
Franklin County
Frederick County
Giles County
Gloucester County
Goochland County
Grayson County
Greene County
Greensville County
Halifax County
Hanover County
Henrico County
Henry County
Highland County
Isle of Wight County
James City County
King and Queen County
King George County
King William County
Lancaster County
Lee County
Loudoun County
Louisa County
Lunenburg County
Madison County
Mathews County
Mecklenburg County
Middlesex County
Montgomery County
Nelson County
New Kent County
Northampton County
Northumberland County
Nottoway County
Orange County
Page County
Patrick County
Pittsylvania County
Powhatan County
Prince Edward County
Prince George County
Prince William County
Pulaski County
Rappahannock County
Richmond County
Roanoke County
Rockbridge County
Rockingham County
Russell County
Scott County
Shenandoah County
Smyth County
Southampton County
Spotsylvania County
Stafford County
Surry County
Sussex County
Tazewell County
Warren County
Washington County
Westmoreland County
Wise County
Wythe County
York County
Alexandria City
Bedford City
Bristol City
Buena Vista City
Charlottesville City
Chesapeake City
Clifton Forge City
Colonial Heights City
Covington City
Danville City
Emporia City
Fairfax City
Falls Church City
Franklin City
Fredericksburg City
Galax City
Hampton City
Harrisonburg City
Hopewell City
Lexington City
Lynchburg City
Manassas City
Manassas Park City
Martinsville City
Newport News City
Norfolk City
Norton City
Petersburg City
Poquoson City
Portsmouth City
Radford City
Richmond City
Roanoke City
Salem City
Staunton City
Suffolk City
Virginia Beach City
Waynesboro City
Williamsburg City
Winchester City
< 1997
Choose Year
2021
2017
2013
2009
2005
1997
1993
1989
1985
1981
1977
1973
1969
1965
1961
1957
1953
1949
Choose Office
Lt. Governor
Attorney General
Choose State
New Jersey
2005 >
Virginia Election Results Home
-
National Results for 2001
-
Use Frame Navigation
Login
Terms of Use
-
DCMA Policy
-
Privacy Policy and Cookies
©
Dave Leip's Atlas of U.S. Elections, LLC 2019 All Rights Reserved


