| |
Presidential
Candidate | Home State | Political
Party | Caucus Result | Delegates |
 | Barack Obama | Illinois | Democratic |
16,880 |
79.54% | 15 | 65.2% |
 | Hillary Clinton | New York | Democratic |
3,652 |
17.21% | 3 | 13.0% |
 | Uncommitted | - | Democratic |
552 |
2.60% | 0 | 0.0% |
| John Edwards | North Carolina | Democratic |
137 |
0.65% | 0 | 0.0% |
 | Unallocated | - | Democratic |
- |
- | 5 | 21.7% |
 |
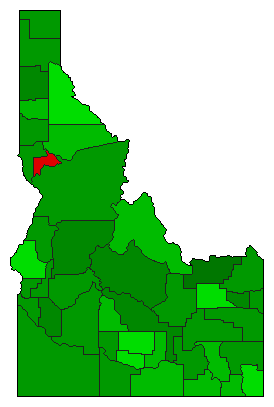
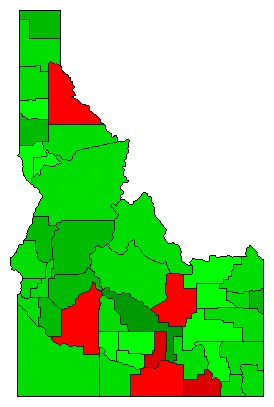
Map Key
| > 50% |
 |
 |  |
| > 60% |
|
|  |
| > 70% |
|
|  |
| > 80% |
|
|  |
| > 90% |
|
|  |
| Turnout
 |  |  |
|
|
| | Election Information: | | Contest Type: | Party-run Caucus/Convention | | Caucus Date: | 2008-02-05 | | Eligible Participants: | Open (all voters) | | Delegates Awarded in this Contest: | 18 | | Delegates Total: | 23 | | Delegate Allocation Method: Proportional - the candidates are awarded delegates in proportion to the percentage of votes received. A 15% threshold is required to receive delegates. |
- No actual convention delegates are awarded at the caucuses, rather each county caucus chooses delegates to attend the State Convention.
- At the state convention, 12 district delegates
- 6 at-large delegates
- 5 unpledged delegates
- Congressional District 1: 6 delegates
- Congressional District 2: 6 delegates
|
|
| Demographic Data
| 2010 Population: | 1,567,582 | Enum. | 2010 Population Density: | 7.3 | persons/km2 | | 2008 Population: | 1,534,320 | Est. | 2008 Population Density: | 7.2 | persons/km2 | | 2000 Population: | 1,293,953 | Enum. | 2000 Population Density: | 6.0 | persons/km2 | | Total Delegates: | 23.0 | | Delegates Density: | 66,710 | persons/Del | | Land Area (2000): | 214,314 | km2 | Annual Pop Growth Rate: | 1.9 | % |
| Election Data and Statistics:
| Election Tools
|
| |


