| |
Presidential
Candidate | Home State | Political
Party | Primary Vote | Delegates |
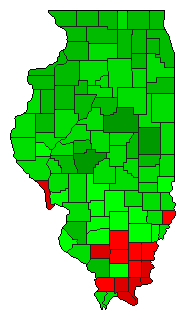
 | Barack Obama | Illinois | Democratic |
1,318,234 |
64.66% | 104 | 56.5% |
 | Hillary Clinton | New York | Democratic |
667,930 |
32.76% | 49 | 26.6% |
 | John Edwards | North Carolina | Democratic |
39,719 |
1.95% | 0 | 0.0% |
| Other (+) | - | Democratic |
12,731 |
0.62% | 0 | 0% |
 | Unallocated | - | Democratic |
- |
- | 31 | 16.8% |
 |
Map Key
| Turnout
 |  |  |
|
|
| | Election Information: | | Contest Type: | State-run Primary | | Election Date: | 2008-02-05 | | Eligible Participants: | Open (all voters) | | Delegates Awarded in this Contest: | 153 | | Delegates Total: | 184 | | Delegate Allocation Method: Proportional - the candidates are awarded delegates in proportion to the percentage of votes received. A 15% threshold is required to receive delegates. |
- 53 at-large delegates
- 100 district delegates
- 32 unpledged delegates
- 4 delegates from CDs 4, 6, 8, 14, 15, 16, 18
- 5 delegates from CDs 10, 11, 12, 13, 17, 19
- 6 delegates from CDs 3, 5, 9
- 8 delegates from CDs 1, 2, 7
|
|
| Demographic Data
| 2010 Population: | 12,830,632 | Enum. | 2010 Population Density: | 89.1 | persons/km2 | | 2008 Population: | 12,747,038 | Est. | 2008 Population Density: | 88.5 | persons/km2 | | 2000 Population: | 12,419,293 | Enum. | 2000 Population Density: | 86.3 | persons/km2 | | Total Delegates: | 184.0 | | Delegates Density: | 69,277 | persons/Del | | Land Area (2000): | 143,961 | km2 | Annual Pop Growth Rate: | 0.3 | % |
| Election Data and Statistics:
| Election Tools
|
| |
|


