| |
Presidential
Candidate | Vice Presidential
Candidate | Political
Party | Popular Vote | Electoral Vote |
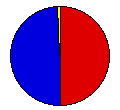
 | Barack H. Obama | Joseph R. Biden, Jr. | Democratic |
1,374,039 |
49.84% | 11 |
 | John S. McCain, III | Sarah Palin | Republican |
1,345,648 |
48.81% | 0 |
 | Bob Barr | Wayne A. Root | Libertarian |
29,257 |
1.06% | 0 |
| Other (+) | - | - |
7,714 |
0.28% | 0 |
 |
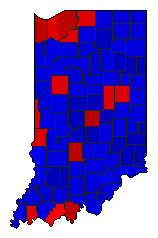
Map Key
| Turnout
 |  |  |
|
|
| Election Notes:
- Official Results do not count any write-in votes for candidates that did not register for qualified write-in status. Officially registered write-in votes as follows: Michael Faith: 12, Lawson Bone: 2, Darrell Castle: 51, Kevin Mottus: 9, John Plemons: 1, Lou Kujawski: 1. The write-ins votes listed here were collected from each county official report (incomplete data).
| Demographic Data
| 2010 Population: | 6,483,802 | Enum. | 2010 Population Density: | 69.8 | persons/km2 | | 2008 Population: | 6,424,806 | Est. | 2008 Population Density: | 69.2 | persons/km2 | | 2000 Population: | 6,080,485 | Enum. | 2000 Population Density: | 65.5 | persons/km2 | | Total Electoral Vote: | 11 | | Electoral Vote Density: | 584,073 | persons/EV | | Land Area (2000): | 92,895 | km2 | Annual Pop Growth Rate: | 0.6 | % |
| Election Data and Statistics:
| Election Tools
- Atlas Forum Image Code for Maps: County, CD, Town, Pop, Tnd, Swg
Data Sources:
- Source for Popular Vote data: Indiana Secretary of State. Indiana General Election November 4, 2008 Office President, Indiana Secretary of State (
) (accessed 02 Dec 2008)
- Source for Population data: U.S. Census Bureau.
| Results for and Individual County:
| | Primary Documentation:
|
| The 2008 Campaign:
|
|
| |


