| |
Presidential
Candidate | Home State | Political
Party | Primary Vote | Delegates |
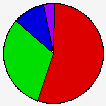
 | Hillary Clinton | New York | Democratic |
228,480 |
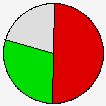
54.76% | 24 | 50.0% |
 | Barack Obama | Illinois | Democratic |
130,130 |
31.19% | 14 | 29.2% |
 | John Edwards | North Carolina | Democratic |
42,725 |
10.24% | 0 | 0.0% |
 | Bill Richardson | New Mexico | Democratic |
7,078 |
1.70% | 0 | 0.0% |
| Other Candidates | - | Democratic |
3,905 |
0.94% | 0 | 0.0% |
| Chris Dodd | Connecticut | Democratic |
2,511 |
0.60% | 0 | 0.0% |
| Dennis J. Kucinich | Ohio | Democratic |
2,378 |
0.57% | 0 | 0.0% |
 | Unallocated | - | Democratic |
- |
- | 10 | 20.8% |
 |
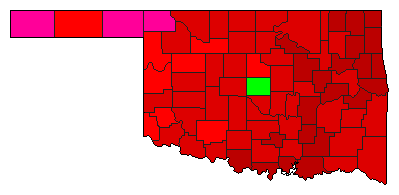
Map Key
| Turnout
 |  |  |
|
|
| | Election Information: | | Contest Type: | State-run Primary | | Election Date: | 2008-02-05 | | Eligible Participants: | Closed (only members of the party) | | Delegates Awarded in this Contest: | 38 | | Delegates Total: | 48 | | Delegate Allocation Method: Proportional - the candidates are awarded delegates in proportion to the percentage of votes received. A 15% threshold is required to receive delegates. |
- 13 at-large delegates
- 25 district delegates
- 9 unpledged delegates
- Congressional District 1: 5 delegates
- Congressional District 2: 5 delegates
- Congressional District 3: 5 delegates
- Congressional District 4: 5 delegates
- Congressional District 5: 5 delegates
|
|
| Demographic Data
| 2010 Population: | 3,751,351 | Enum. | 2010 Population Density: | 21.1 | persons/km2 | | 2008 Population: | 3,668,976 | Est. | 2008 Population Density: | 20.6 | persons/km2 | | 2000 Population: | 3,450,654 | Enum. | 2000 Population Density: | 19.4 | persons/km2 | | Total Delegates: | 48.0 | | Delegates Density: | 76,437 | persons/Del | | Land Area (2000): | 177,847 | km2 | Annual Pop Growth Rate: | 0.8 | % |
| Election Data and Statistics:
| Election Tools
|
| |


