| |
Presidential
Candidate | Home State | Political
Party | Primary Vote | Delegates |
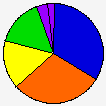
 | John McCain | Arizona | Republican |
147,733 |
33.15% | 18 | 75.0% |
 | Mike Huckabee | Arkansas | Republican |
132,990 |
29.84% | 6 | 25.0% |
 | Fred Thompson | Tennessee | Republican |
69,681 |
15.63% | 0 | 0.0% |
 | Mitt Romney | Massachusetts | Republican |
68,177 |
15.30% | 0 | 0.0% |
 | Ron Paul | Texas | Republican |
16,155 |
3.62% | 0 | 0.0% |
| Rudolph W. Giuliani | New York | Republican |
9,575 |
2.15% | 0 | 0.0% |
| Duncan Hunter | California | Republican |
1,051 |
0.24% | 0 | 0.0% |
| Tom Tancredo | Colorado | Republican |
121 |
0.03% | 0 | 0.0% |
| Hugh Cort | Alabama | Republican |
88 |
0.02% | 0 | 0.0% |
| John Cox | Illinois | Republican |
83 |
0.02% | 0 | 0.0% |
| H. Neal Fendig, Jr. | Georgia | Republican |
23 |
0.01% | 0 | 0.0% |
 |
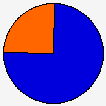
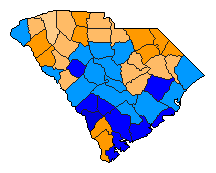
Map Key
| Turnout
 |  |  |
|
|
| | Election Information: | | Contest Type: | State-run Primary | | Election Date: | 2008-01-19 | | Eligible Participants: | Open (all voters) | | Delegates Awarded in this Contest: | 24 | | Delegates Total: | 24 | | Delegate Allocation Method: Winner-take-all by district and statewide |
- 12 at-large delegates: the candidate receiving the highest number of votes statewide is awarded 12 delegates.
- 12 district delegates (2 for each of the 6 congressional districts) The candidate receiving the highest number of votes in each congressional district is awarded two delegates.
- The Republican National Committed has indicated that South Carolina is sanctioned for holding their primary prior to February 5, 2008. This results in a loss of half the original 47 delegates.
|
|
| Demographic Data
| 2010 Population: | 4,625,364 | Enum. | 2010 Population Density: | 59.3 | persons/km2 | | 2008 Population: | 4,528,996 | Est. | 2008 Population Density: | 58.1 | persons/km2 | | 2000 Population: | 4,012,012 | Enum. | 2000 Population Density: | 51.4 | persons/km2 | | Total Delegates: | 24 | | Delegates Density: | 188,708 | persons/Del | | Land Area (2000): | 77,983 | km2 | Annual Pop Growth Rate: | 1.4 | % |
| Election Data and Statistics:
| Election Tools
|
| |


