| |
Presidential
Candidate | Vice Presidential
Candidate | Political
Party | Popular Vote | Electoral Vote |
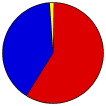
 | Barack H. Obama | Joseph R. Biden, Jr. | Democratic |
242,584 |
58.61% | 3 |
 | Willard Mitt Romney | Paul Ryan | Republican |
165,484 |
39.98% | 0 |
 | Gary Johnson | James P. Gray | Libertarian |
3,882 |
0.94% | 0 |
| Jill Stein | Cheri Honkala | Green |
1,940 |
0.47% | 0 |
| Other (+) | - | - |
31 |
0.01% | 0 |
 |
Map Key
| Turnout
 |  |  |
|
|
| Demographic Data
| 2012 Population: | 915,518 | Est. | 2012 Population Density: | 180.9 | persons/km2 | | 2010 Population: | 897,934 | Enum. | 2010 Population Density: | 177.5 | persons/km2 | | Total Electoral Vote: | 3 | | Electoral Vote Density: | 305,173 | persons/EV | | Land Area (2000): | 5,060 | km2 | Annual Pop Growth Rate: | 1.0 | % |
| Election Data and Statistics:
| Election Tools
- Atlas Forum Image Code for Maps: County, CD, Pop, Prc, Tnd, Swg
Data Sources:
- Source for Popular Vote data: State of Delaware Department of Elections. State Of Delaware Elections System Official Election Results General Elections - 11/06/12 Statewide Offices By County, State of Delaware Department of Elections (http://elections.delaware.gov/results/html/stwoff_kns.shtml
) (accessed 14 Nov 2012)
- Source for Population data: U.S. Census Bureau.
| Results for and Individual County:
| | Primary Documentation:
|
| The 2012 Campaign:
|
|
| |


