Home
2024
Election Results
Election Info
Weblog
Forum
Wiki
Search
Email
Login
Site Info
Store
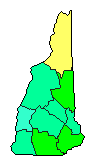
2012 Presidential Republican Primary Election Results
Note: The Google advertisement links below may advocate political positions that this site does not endorse.
Presidential
Candidate
Home State
Political
Party
Primary Vote
Delegates
Mitt Romney
Massachusetts
Republican
97,591
39.28%
7
58.3%
Ron Paul
Texas
Republican
56,872
22.89%
3
25.0%
Jon Huntsman, Jr.
Utah
Republican
41,964
16.89%
2
16.7%
Rick Santorum
Virginia
Republican
23,432
9.43%
0
0.0%
Newt Gingrich
Virginia
Republican
23,421
9.43%
0
0.0%
Rick Perry
Texas
Republican
1,764
0.71%
0
0.0%
Buddy Roemer
Louisiana
Republican
950
0.38%
0
0.0%
Other (
+
)
-
Republican
2,481
1.00%
0
0%
Map Key
> 20%
> 30%
> 40%
> 50%
> 60%
Turnout
Maps
Election Information:
Contest Type:
State-run Primary
Election Date:
2012-01-10
Eligible Participants:
Modified Open (members of the party or independents)
Delegates Awarded in this Contest:
12
Delegates Total:
12
Statewide Delegates:
Proportional - a 10% threshold is required to receive delegates.
Demographic Data
2012 Population:
1,324,677
Est.
2012 Population Density:
57.0
persons/km
2
2010 Population:
1,316,470
Enum.
2010 Population Density:
56.7
persons/km
2
Total Delegates:
12
Delegates Density:
110,390
persons/Del
Land Area (2000):
23,227
km
2
Annual Pop Growth Rate:
0.3
%
Election Data and Statistics:
County Data (Table)
(m)
County Data (Graphs)
Congressional District Data
(m)
City and Town Data
(m)
Purchase Detailed Data
Compare State Maps by Year
View All 2012 New Hampshire Maps
Election Tools
2012 Republican Primary Timeline
Atlas Forum
Image Code for Maps:
County
,
CD
,
Town
,
Pop
Data Sources:
Source for Popular Vote data:
Source for Population data: U.S. Census Bureau.
Results for and Individual County:
Belknap County
Carroll County
Cheshire County
Coos County
Grafton County
Hillsborough County
Merrimack County
Rockingham County
Strafford County
Sullivan County
< 2008
Choose Year
2024
2016
2008
2000
1996
Choose Office
Choose Party
Democratic
Choose State
Alabama
Alaska
American Samoa
Arizona
Arkansas
California
Colorado
Colorado
Colorado
Connecticut
Delaware
District of Columbia
Florida
Georgia
Guam
Hawaii
Idaho
Illinois
Indiana
Iowa
Kansas
Kentucky
Louisiana
Maine
Maryland
Massachusetts
Michigan
Minnesota
Minnesota
Minnesota
Mississippi
Missouri
Missouri
Missouri
Montana
Montana
N. Mariana Isl.
Nebraska
Nebraska
Nevada
New Jersey
New Mexico
New York
North Carolina
North Dakota
Ohio
Oklahoma
Oregon
Pennsylvania
Puerto Rico
Rhode Island
South Carolina
South Dakota
Tennessee
Texas
Utah
Vermont
Virgin Islands
Virginia
Washington
West Virginia
Wisconsin
Wyoming
Wyoming
Wyoming
2016 >
New Hampshire Election Results Home
-
National Results for 2012
-
Use Frame Navigation
Login
Terms of Use
-
DCMA Policy
-
Privacy Policy and Cookies
©
Dave Leip's Atlas of U.S. Elections, LLC 2019 All Rights Reserved


