Note: The Google advertisement links below may advocate political positions that this site does not endorse.
Official Results
  Presidential
Candidate
Vice Presidential
Candidate
Political
Party
Popular VoteElectoral Vote
Hillary ClintonTimothy KaineDemocratic 3,090,729 55.24%20
Donald J. TrumpMichael R. PenceRepublican 2,146,015 38.35%0
Gary JohnsonWilliam F. WeldLibertarian 209,596 3.75%0
Dr. Jill SteinAjamu BarakaGreen 76,802 1.37%0
Write-ins-- 58,785 1.05%0
YOther (+) - - 13,352 0.24%0
Total Vote 5,595,279
Maps
2016 Presidential General Election - Illinois Election County Map
County H
County Pop H
2012 Button H
Per Vote Democratic Button H
Per Vote Republican Button H
Swing Map Button H
Trend Map Button H
Town H
Last Button H
Per Vote Democratic Button H
Per Vote Republican Button H
Swing Map Button H
Trend Map Button H
 
(Note: click the 'H' buttons above to hold the given map and change the image map)
PerDemocraticRepublicanPie
>20%
 
0
 
 
0
 
pie
>30%
 
0
 
 
0
 
>40%
 
31
 
 
31
 
>50%
 
60
 
 
60
 
>60%
 
19
 
 
19
 
>70%
 
10
 
 
10
 
>80%
 
8
 
 
8
 
>90%
 
4
 
 
4
 
 Election Data and Statistics:
Data Sources:
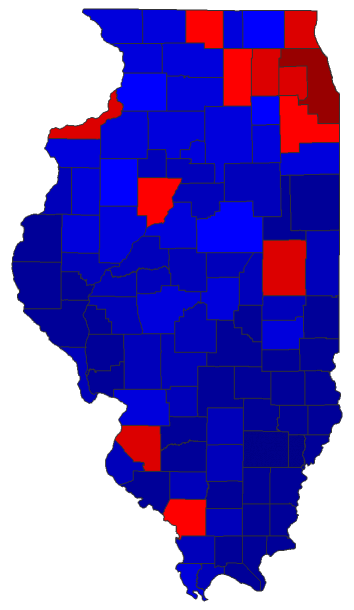
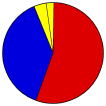
  • Source for Popular Vote data: Illinois State Board of Elections, "President and Vice President of the United States," Official Canvass General Election November 8, 2016 (Springfield, 2016)
Election Notes:
  • Official write-in vote: 212 for 19 candidates. Additional write-ins collected from official individual county election reports (incomplete tally).


Classic Illinois Results for 2016 - National Results for 2016

Login

Terms of Use - DCMA Policy - Privacy Policy and Cookies


© Dave Leip's Atlas of U.S. Elections, LLC 2019 All Rights Reserved