Note: The Google advertisement links below may advocate political positions that this site does not endorse.
Official Results
  Presidential
Candidate
Home StatePolitical
Party
Primary VoteDelegates
Hillary ClintonNew YorkDemocratic 245,930 66.07%44 57.9%
Bernie SandersVermontDemocratic 120,800 32.45%23 30.3%
Uncommitted-Democratic 3,467 0.93%0 0.0%
Martin O'MalleyMarylandDemocratic 2,025 0.54%0 0.0%
YUnallocated - Democratic - -911.8%
Total Vote 372,222
Maps
2016 Presidential Democratic Primary - Tennessee Election County Map
County H
County Pop H
Per Vote Democratic Button H
County H
 
(Note: click the 'H' buttons above to hold the given map and change the image map)
PerClintonSandersPie
>20%


pie
>30%


>40%


>50%


>60%


>70%


>80%


>90%


 Election Data and Statistics:
Data Sources:
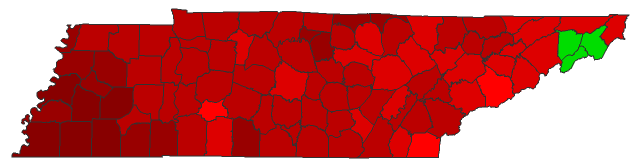
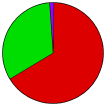
  • Source for Popular Vote data: Tennessee Secretary of State Division of Elections. March 1, 2016 Democratic Primary Presidential Preference, Tennessee Secretary of State Division of Elections (http://sos.tn.gov/sites/default/files/StateCertDemPresidentCountyTotals.pdf) (accessed 04 Apr 2016)


Classic Tennessee Results for 2016 - National Results for 2016

Login

Terms of Use - DCMA Policy - Privacy Policy and Cookies


© Dave Leip's Atlas of U.S. Elections, LLC 2019 All Rights Reserved