Monthly Archives: June 2013

Vigo County, IN Extends Bellwether Streak

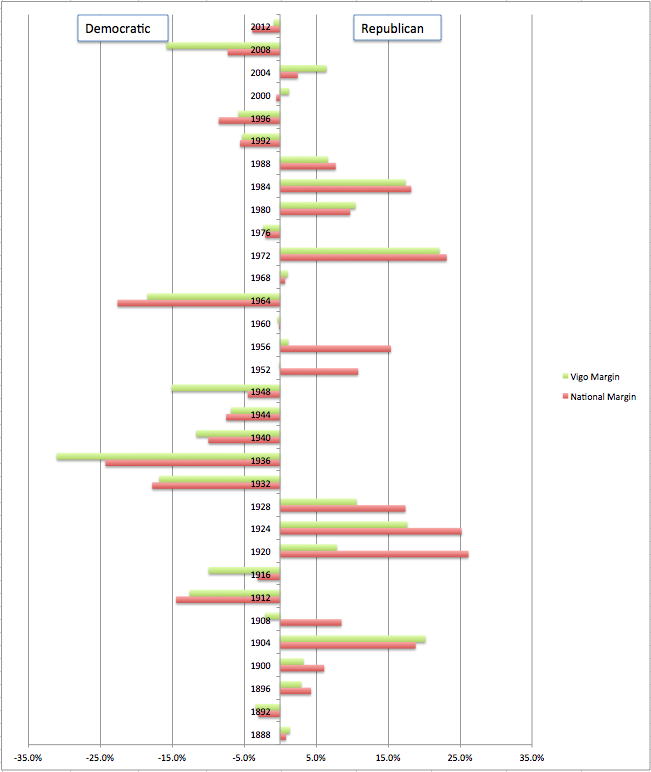
Vigo County, Indiana is the the most prominent bellwether of presidential elections in the country – voting for the winning candidate in every election from 1956 through 2012.  Indiana County Map Highlighting Vigo County Furthermore, Vigo County has picked the winner in 30 of the last 32 Presidential Elections.  It barely missed in 1952, voting for Adlai Stevenson over Dwight Eisenhower by 0.07% and a more substantial 10.6% miss in 1908 by choosing William Bryan over William Howard Taft.  The list of hits, however, is much longer – Vigo extended its streak in 2012 by voting for Barack Obama – although barely with a margin of only 0.86% (49.3% to 48.4%).  The table below compares the results in Vigo County to the National results for the years 1888 through 2012.  The average margin delta (difference between the margin in Vigo County and the margin nationwide) for the last 124 years is only 4%.  The accompanying bar chart is a graphical representation of these data.

Year National Vigo Nat Margin Vigo Margin Margin ∆
1888 Rep Rep 0.83% 1.36% -0.5%
1892 Dem Dem 3.01% 3.40% 0.4%
1896 Rep Rep 4.31% 2.95% 1.4%
1900 Rep Rep 6.13% 3.25% 2.9%
1904 Rep Rep 18.83% 20.19% -1.4%
1908 Rep Dem 8.53% 2.07% 10.6%
1912 Dem Dem 14.44% 12.56% -1.9%
1916 Dem Dem 3.12% 9.92% 6.8%
1920 Rep Rep 26.17% 7.89% 18.3%
1924 Rep Rep 25.22% 17.66% 7.6%
1928 Rep Rep 17.42% 10.61% 6.8%
1932 Dem Dem 17.76% 16.77% -1.0%
1936 Dem Dem 24.25% 31.02% 6.8%
1940 Dem Dem 9.95% 11.64% 1.7%
1944 Dem Dem 7.49% 6.83% -0.7%
1948 Dem Dem 4.48% 15.05% 10.6%
1952 Rep Dem 10.85% 0.07% 10.9%
1956 Rep Rep 15.40% 1.14% 14.3%
1960 Dem Dem 0.16% 0.33% 0.2%
1964 Dem Dem 22.58% 18.41% -4.2%
1968 Rep Rep 0.70% 1.04% -0.3%
1972 Rep Rep 23.15% 22.13% 1.0%
1976 Dem Dem 2.06% 2.32% 0.3%
1980 Rep Rep 9.74% 10.47% -0.7%
1984 Rep Rep 18.22% 17.41% 0.8%
1988 Rep Rep 7.73% 6.63% 1.1%
1992 Dem Dem 5.56% 5.26% -0.3%
1996 Dem Dem 8.52% 5.77% -2.8%
2000 Rep Rep √* 0.52% 1.24% -0.7%
2004 Rep Rep 2.46% 6.45% -4.0%
2008 Dem Dem 7.26% 15.77% 8.5%
2012 Dem Dem 3.85% 0.86% -3.0%

*In 2000, the popular vote went to Albert Gore, Jr., but the electoral vote went to George W. Bush.
Vigo County, Indiana Bar Chart

Enhanced County Township Maps

The Atlas is in the process of upgrading the county township maps in the members section. Going beyond the previous flat vote result map, the new maps are enhanced and greatly expanded, including an image-map to highlight the name of the city/town and the summary result in a pop-up window, include mouse-over maps/links for party, swing, trend, and the previous vote result. In addition, the maps are also larger. Currently, these new maps and features are available for President in 2012 and 2008 in New Hampshire, Vermont, Massachusetts, Connecticut, New York, Rhode Island, as well as brand new maps for New Jersey. I’m currently in the process of creating the Maine maps – an endeavor that is taking quite some effort due to the large mismatch between the available census maps and the township entities that are included in the Maine official results. Future expansion of this feature is planned to include more states, more offices, and more elections further back in time.

County Township Map Example

Ron Paul Wins (Concord Unincorporated Township)

Somerset 2012 Presidential Results by Town

Somerset County, ME 2012 Presidential Election Results

Hidden in the 2012 Presidential Election data is a small unincorporated township in Maine that was won by Ron Paul. There were a total of three votes cast – all three were write-in votes for Ron Paul – both Obama and Romney came up empty. The 2012 general election is the first time that the Maine Secretary of State Bureau of Corporations, Elections & Commissions has published presidential election results for Concord Twp. Although not actively running for President in the 2012 General Election, Ron Paul was certified as a declared write-in candidate for President in Maine, allowing his write-in votes to be counted (see 2012 Maine Declared Write-in Candidates).

The image to the right shows the full results by township for Somerset County, ME in the 2012 General Election for President.  Concord Twp is located in Somerset County on the west side of the Kennebec River to the north of Embden Town (colored in dark yellow on the map).   Concord Twp is included with Lexington Twp to form the census “Central Somerset UT”.

In spite of the plethora of low population towns in New England, wins by “third party” candidates are quite rare.  Not since Ross Perot in 1996, has a third party won in any New England town (Perot won three and tied in a fourth in 1996.  Perot won a substantial number of towns in 1992).  Nader tied Al Gore in 2000 in Pinkham’s Grant, NH 3-3.

Preliminary MA Special U.S. Senate Results

MA Senate MapThe 2013 Special United States Senate Election in Massachusetts preliminary results have been posted. The contest between Democratic Congressman Ed Markey, representing the Massachusetts 5th district and Republican Gabriel Gomez has ended with a 54.8% to 44.8% victory for Markey. This is a Democratic hold of the seat vacated by now Secretary of State John Kerry.

Equal Voice Voting

Equal Voice Voting Book Cover I have received a signed copy of Equal Voice Voting Making Our Votes Count in the Electoral College by Jerry Spriggs. The book proposes a modified Electoral College, named Equal Voice that “combines the power of the popular vote while retaining an equal representation of every state in the country.” The book draws data from the Atlas for use in analysis – the Acknowledgements state “It would not have happened without the ready reference and data gleaned from Dave Leip’s Atlas of Presidential Elections data (https://uselectionatlas.org)”. I’m always happy to see (and receive) examples of the site’s application!

Some more description of the book on Amazon: “The current U.S. presidential election process, known as the Electoral College, needs to be modified. Only a minority of our nation’s voters are actually represented in the Electoral College in its current form. Because of the low voter representation, our citizens are not encouraged to vote; a state of apathy is prevalent in the very process designed to choose our nation’s leader. Voters are discouraged and our democracy suffers. Something must change! Equal Voice Voting is a new presidential election method that modifies the Electoral College. Equal Voice Voting gives both the popular as well as the geographic representation needed to allow everyone an equal voice in our presidential elections. It eliminates the winner-take-all approach, giving every political party an opportunity to be represented in every presidential election. This book discusses other voting alternatives, such as the National Popular Voting bill and the option of relying on voting by congressional districts…”