Monthly Archives: November 2014

More than 360,000 Voters Leave Ballot Blank in Uncontested Alabama Senate Contest

AL 2014 Senate

Alabama 2014 Election Results – U.S. Senate

In the 2014 General Election contest for U.S. Senate in Alabama, more than 360,000 voters left their ballot blank.  The race featured incumbent Senator Jeff Session running for re-election without a named opponent printed on the ballot.  The ballot did include, however, an option to vote for a write-in a candidate.  On November 24, the Alabama Secretary of State certified the 2014 General Election Results, publishing the final tally of the vote as 795,606 for Republican Jeff Sessions (97.25%) and 22,484 write-ins (2.75%). The county-level result, shown at right, is a solid “>90%” in every county, with exception of Macon County, where the write-in tally just cleared 10%.  Full results are available here.

Looking deeper into the data though, its clear that most voters that did not want to vote for the incumbent Senator simply left their ballots blank.

AL 2014 Senate Vote Dropoff

Alabama 2014 US Senate Vote Dropoff

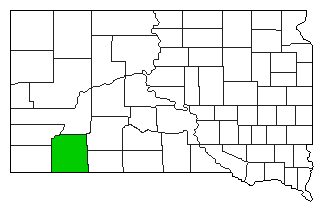
The drop-off vote from Governor to U.S. Senate (the difference in total vote between the two contests) is 362,323 votes (30.6%).  The total Republican Vote for Jeff Sessions in the U.S. Senate contest is only 5.7% more than Republican Robert Bentley received in the Gubernatorial vote – 795,606 vs. 750,231, a difference of 43,375 – full Gubernatorial results can be seen here. At the county level, the drop-off varies considerably, from the smallest drop-off of 10.4% in Blount County to the largest of 80.5% in Greene County. A map of the results can be seen at right.

Map Key >10% >20% >30% >40% >50% >60% >70% >80%
Dropoff
2014 Governor Republican Vote

Alabama 2014 Gubernatorial  Vote for Republican

In one example, Macon County, Democratic Gubernatorial candidate Parker Griffith received 4,830 votes (85.3%) to Robert Bentley’s 829 (14.6%) and three write-in votes – a total of 5,662 votes.  In the U.S. Senate contest, Jeff Sessions, picked up 1,133 votes to 127 write-ins.  The number of blank votes in the U.S. Senate race relative to the Governor’s race 4,402 votes (77.8%).

Predictably, the drop-off correlates with the percentage of vote for Republican, as shown in the map to the right. The sharpness of the magnitude of this correlation may be, in part, due to the existence of the straight-party option.  As seen in this sample ballot, the voter can choose Alabama Democratic Party, Alabama Independence Party, or Alabama Republican Party at the very top of the ballot under “Straight Party Voting”.  If the voter chooses the “Alabama Democratic Party” option, no vote for US Senate is cast.

Map Key >90% >80% >70% >60% >50% >40% >30% >20%
Republican

Shannon County, SD Votes to Change Name

Shannon County, SD

Shannon County, SD

The residents of Shannon County, SD have voted to change the name of the county to Oglala Lakota County.  The vote tally from the November 4th election is

Yes 2,161 80.4%
No 526 19.6%

The process has several more steps until the name change becomes official, including a joint resolution of the South Dakota Legislature followed by a proclamation from the governor.  The name change then becomes official on the first day of the first month following the proclamation.  South Dakota Statute 7-1-71 and Statute 7-1-72 state:

7-1-71.   Legislative resolution to change name. The Governor at the next convention of the annual session of the State Legislature shall communicate the result of an election held pursuant to § 7-1-69 in such county to the presiding officer of each branch of the Legislature, and thereupon the Legislature shall designate by joint resolution the new name of such county.

7-1-72.   Governor’s proclamation of new county name. Upon the designation made by the Legislature pursuant to § 7-1-71, the Governor shall publicly proclaim the result of the election held pursuant to § 7-1-69 and of the new name of the county. The new name of such county shall be in full force and effect on the first day of the month following such proclamation by the Governor.

Shannon County Name Change Precinct Map

Shannon County Change of County Name Precinct Results Map

The vote for the “Shannon County Change of County Name” took place on the same day as the 2014 General Election, but on a separate paper ballot. A sample ballot with question wording may be seen here.

The map at the right shows the full Shannon County precinct result for the vote.  All precincts voted in favor of the change except for Cuny Table, the precinct with the fewest votes in the northwest corner, where they voted against the change 22 to 19.  Five precincts voted with more than 80% in favor.

Map Key >50% >60% >70% >80%
Yes
No

The map key is shown at the right. The table below show the precinct-level data from the vote.

Shannon County Name Change Precinct Results

Precinct NameYes VoteNo VoteYes %No %
Total2,16152680%20%
Batesland694362%38%
Cuny Table192246%54%
Kyle2996981%19%
Manderson1502785%15%
Oglala3369079%21%
Pine Ridge 153811682%18%
Pine Ridge 33757583%17%
Porcupine3226284%16%
Rockyford532271%29%

Shannon County was Barack Obama’s best county in the 2012 General Election (see statistics page), where he won with 93.4% of the vote.  Mitt Romney only managed 6.0%.  Full 2012 Shannon County presidential results are available here.