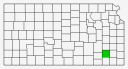
The 2012 General Election official Vote Totals as reported by the Kansas Secretary of State Elections & Legislative division includes results from Wilson County that are double-counted. Wilson County has a relatively small population of 9,409 as enumerated by the U.S. Census Bureau in 2010 (estimated population of July 2012 is 9,105) and is located east of Wichita and south of Topeka as shown in the map at right. The table below shows the officially reported results for President in Wilson County:
Official Reported
Presidential Candidate
Vice Presidential Candidate
Political Party
Popular Vote
Willard Mitt Romney
Paul Ryan
Republican
5,650
76.00%
Barack H. Obama
Joseph R. Biden, Jr.
Democratic
1,636
22.01%
Gary Johnson
James P. Gray
Libertarian
94
1.26%
Chuck Baldwin
Joseph Martin
Reform
54
0.73%
The sum of the votes cast for President as reported is 7,434. However, the Kansas 2012 General Election Official Turnout Report shows only 3,752 ballots cast and 5,845 registered voters in Wilson County. Furthermore, the total counted votes for President in 2008 was 4,121. Upon inspection of the 2012 Kansas General Election Results by Precinct, it becomes clear that the votes for each candidate are counted twice. The Atlas database has been updated to reflect the correct data.
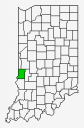
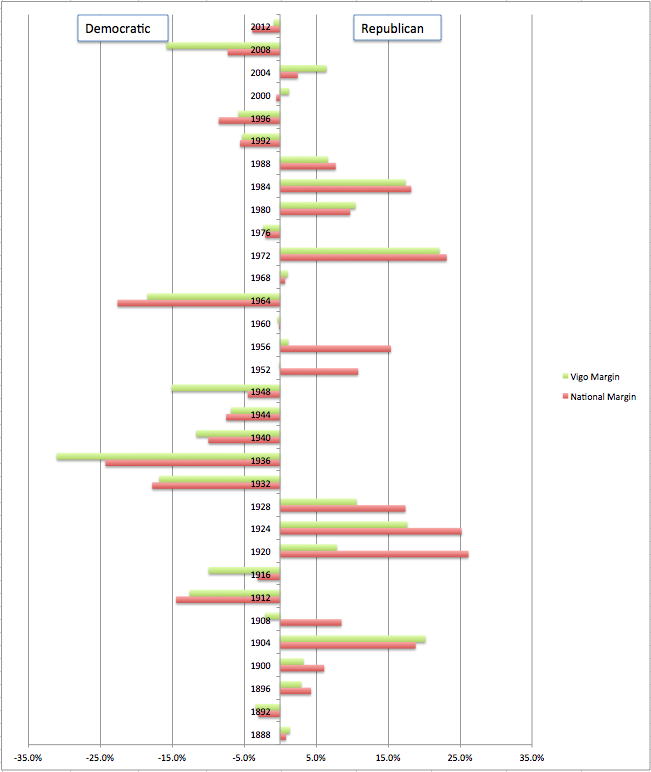
Vigo County, Indiana is the the most prominent bellwether of presidential elections in the country – voting for the winning candidate in every election from 1956 through 2012. Furthermore, Vigo County has picked the winner in 30 of the last 32 Presidential Elections. It barely missed in 1952, voting for Adlai Stevenson over Dwight Eisenhower by 0.07% and a more substantial 10.6% miss in 1908 by choosing William Bryan over William Howard Taft. The list of hits, however, is much longer – Vigo extended its streak in 2012 by voting for Barack Obama – although barely with a margin of only 0.86% (49.3% to 48.4%). The table below compares the results in Vigo County to the National results for the years 1888 through 2012. The average margin delta (difference between the margin in Vigo County and the margin nationwide) for the last 124 years is only 4%. The accompanying bar chart is a graphical representation of these data.
Year
National
Vigo
√
Nat Margin
Vigo Margin
Margin ∆
1888
Rep
Rep
√
0.83%
1.36%
-0.5%
1892
Dem
Dem
√
3.01%
3.40%
0.4%
1896
Rep
Rep
√
4.31%
2.95%
1.4%
1900
Rep
Rep
√
6.13%
3.25%
2.9%
1904
Rep
Rep
√
18.83%
20.19%
-1.4%
1908
Rep
Dem
8.53%
2.07%
10.6%
1912
Dem
Dem
√
14.44%
12.56%
-1.9%
1916
Dem
Dem
√
3.12%
9.92%
6.8%
1920
Rep
Rep
√
26.17%
7.89%
18.3%
1924
Rep
Rep
√
25.22%
17.66%
7.6%
1928
Rep
Rep
√
17.42%
10.61%
6.8%
1932
Dem
Dem
√
17.76%
16.77%
-1.0%
1936
Dem
Dem
√
24.25%
31.02%
6.8%
1940
Dem
Dem
√
9.95%
11.64%
1.7%
1944
Dem
Dem
√
7.49%
6.83%
-0.7%
1948
Dem
Dem
√
4.48%
15.05%
10.6%
1952
Rep
Dem
10.85%
0.07%
10.9%
1956
Rep
Rep
√
15.40%
1.14%
14.3%
1960
Dem
Dem
√
0.16%
0.33%
0.2%
1964
Dem
Dem
√
22.58%
18.41%
-4.2%
1968
Rep
Rep
√
0.70%
1.04%
-0.3%
1972
Rep
Rep
√
23.15%
22.13%
1.0%
1976
Dem
Dem
√
2.06%
2.32%
0.3%
1980
Rep
Rep
√
9.74%
10.47%
-0.7%
1984
Rep
Rep
√
18.22%
17.41%
0.8%
1988
Rep
Rep
√
7.73%
6.63%
1.1%
1992
Dem
Dem
√
5.56%
5.26%
-0.3%
1996
Dem
Dem
√
8.52%
5.77%
-2.8%
2000
Rep
Rep
√*
0.52%
1.24%
-0.7%
2004
Rep
Rep
√
2.46%
6.45%
-4.0%
2008
Dem
Dem
√
7.26%
15.77%
8.5%
2012
Dem
Dem
√
3.85%
0.86%
-3.0%
*In 2000, the popular vote went to Albert Gore, Jr., but the electoral vote went to George W. Bush.
The 2012 General Election data have been updated today to reflect the final official town and county totals in Massachusetts. In addition, several states have published amended results – including New York and New Jersey. I have also added several corrections as discovered during compilation of individual county reports.
Data files available on the store page are also updated with these latest results.
With the addition of official MA county/town data, this brings to a close the official data compilation for the 2012 General Election. Further updates will consist of corrections or write-in votes discovered during precinct compilation.
2008 General Election data for President by city and town have been added for the states of Michigan, Illinois, Pennsylvania, Ohio, New Jersey, Kansas, and a partial set from Indiana. These data are not fully reconciled with official totals. However, there are a lot of good matching data for most of the counties in these states. Statewide township maps and individual county township maps (Michigan and Illinois) will be forthcoming.
The 2012 Republican Primary county and state-level data have been updated to final/official results (Utah, the last state to hold its nominating contest just certified its results last week). Some congressional district data and a number of maps are still in-process.
I have discovered that the Texas Secretary of State official election results from the 2012 Republican Primary have shorted Romney by an even 100,000 votes. This occurs in Harris County where the tally shows Romney with 11,380 votes. The official results posted on the Harris County Clerk’s web page show an official total of 111,380. A small typo shifted the results by a whopping 100,000 votes. While in this case, the election was no longer contested and even this large number of votes did not change the result, it does show how simple errors can cause very large numbers of votes to be miscounted. I have contacted the Texas Secretary of State about this discrepancy.
The preliminary data file for the 2012 Republican Primary contests has been posted to the store page. Many contests have certified official data, but data from several states are currently unofficial. Data by congressional district is available for a few states – note that redistricting has slowed this process. Several states tabulated results by congressional district, but did so for the old 2002-2010 boundaries – these data are not included as they are irrelevant to the delegate allocation. Compilation continues and the file will be updated periodically. All updates of purchased files may be downloaded for free.
The 2010 Election Data has been updated – all states are now official. The last state to make public its detailed data is Massachusetts – where the official data by county is published in a the paper book called “Public Document #43 Massachusetts Election Statistics” – the document has just been released.
The 2010 Election Data has been updated – most states are now official. Exceptions are late results by county for Governor in Maine and Kansas as well as the Alaska Senate. In addition, several states do not certify their results for Governor until January (these include Texas, Tennessee, and Iowa). Massachusetts official data by county will not be available until some time in the spring after they publish the paper copy of “Public Document #43”.
The first update to the 2010 election results on the site as well as the data files are now available. Official results have been posted for a few states that certify their elections within a week. Other states have been updated to reflect continuing accumulation of absentee ballots.


 The 2012 General Election official Vote Totals as reported by the Kansas Secretary of State Elections & Legislative division includes results from Wilson County that are double-counted. Wilson County has a relatively small population of 9,409 as enumerated by the U.S. Census Bureau in 2010 (estimated population of July 2012 is 9,105) and is located east of Wichita and south of Topeka as shown in the map at right. The table below shows the officially reported results for President in Wilson County: