The margin swing in the 2013 Virginia Governor’s race relative to the 2009 election was nearly 20% towards the Democrats. The 2013 result was Democrat Terry McAuliffe over Republican Ken Cuccinelli by 2.6% (47.8%-45.2%). In the 2009 contest, Republican Bob McDonnell defeated Democrat Creigh Deeds by 17.3% (58.6%-41.3%). As shown by the map, most of the counties and cities in the state swung Democratic. A dozen counties in the Appalachian region bordering West Virginia plus Patrick County swung Republican. Most of these had relatively modest Republican swings. An exception to this, however, are three adjacent counties in the northwest portion of the state: Alleghany, Bath, and Highland along with Covington City (which lies wholly within Alleghany County). These three counties plus city exhibited swing percentages that significantly bucked the statewide swing, recording vote margins that surged Republican by 31%, 51%, 21%, and 26% respectively. Bath County in particular, with a Republican swing percentage of 51% makes for a state-level trend move of 71% (51% Republican swing in the county plus 20% Democratic swing statewide).
Virginia 2013 Governor - Margin Swing
County
Margin 2009
Margin 2013
Margin Swing
Bath County
D+27%
R+24%
R+51%
Allegheny County
D+23%
R+9%
R+31%
Covington City
D+32%
D+6%
R+26%
Highland County
R+10%
R+31%
R+21%
Statewide
R+17%
D+3%
D+20%
While often such outlying data can suggest an error in the tally, this result is simply a matter of the area voting for favorite son Creigh Deeds in 2009 and returning to the regional voting pattern in 2013. Creigh Deeds is from Bath County and represented the 25th district in the Virginia Senate (In 2009, Bath County, Allegheny County, and Covington City were all within the 25th district). These counties also have very small populations (in 2013, Highland County had only 903 total votes counted, Bath County had 1,213, Allegheny County had 4,136, and Covington City had 1,275). The full swing table (member feature) can be viewed here.
The 2013 New Jersey General Election Gubernatorial Results are now official – posted by the New Jersey Division of Elections in the document Official List Candidates for Governor For General Election 11/05/2013 Election on December 4, 2013. The final results are Republican Chris Christie 1,278,932 (60.2%), Democrat Barbara Buono 809,978 (38.2%), Libertarian Kenneth R. Kaplan 12,155 (0.57%), Green Party candidate Steven Welzer 8,295 (0.4%) and four other minor party candidates with a combined total of 11,506 votes (0.54%). The margin of victory is 466,714 votes (22.2%). The Election Atlas also includes in its tally 2,175 write-in votes collected from individual county election reports that are not included in the “Official List” document.
Overall, the result is a solid Republican win for the incumbent in a heavily Democratic state. The last time a Republican won the race for Governor in New Jersey by such a large margin was by Thomas H. Kean in 1985. In 2013, Christie won all but two counties (falling short in Essex and Gloucester) – picking up six more counties relative to his win in 2009 on the back of an 18.6% swing statewide. His strongest showing was in Ocean County (75.7%) and had his largest swing in Hudson County (32.3%) although still coming up short of winning the county by 11.1%. The total votes counted in 2013 are 2,106,377 – a significant drop from 2009, where 2,425,441 votes were tallied (a drop of 319,064). Christie received 95,208 more votes vs. his run in 2009 while Buono received 284,792 fewer votes in 2013 than Jon S. Corzine did on the Democratic ticket in 2009. Full results are available for exploration here.
The 2013 General Election results for Governor are now official. The certified results from the Virginia State Board of Elections are Terry McAuliffe (D) with 1,069,789 (47.75%), Ken Cuccinelli II (R) with 1,013,354 (45.23%), Robert Sarvis (L) with 146,084 (6.52%), and 11,087 write-in votes (0.49%). This is a Democratic pickup resulting from a popular vote swing of almost 20% relative to the 2009 Gubernatorial Election. Cuccinelli’s best county was Scott (75.6%) and best city was Poquoson (67.7%) – he also carried the populous Virginia Beach City with 47.6%. McAuliff’s best county was Charles City County with 61.3% and best city was Petersburg with 77.8%. McAuliffe’s overall margin of 56,435 votes is less than his margin in the single county of Fairfax, where he won 58.4% to 36.2% (a 68,065 vote margin). Robert Sarvis had his best showing in Alleghany County (11.8%) and the city of Covington (12.6%).
The preliminary unofficial 2013 General Election results for Governor in New Jersey and Virginia have been posted. In New Jersey, Governor Chris Christie was re-elected by a margin of 60% to 38% with 1.6% voting for other candidates. This matched the New Jersey polls quite closely – with the appearance that the small undecided votes broke for Buono.
In Virginia, the results as reported by the Virginia State Board of Elections had Republican candidate Ken Cuccinelli ahead of Democrat Terry McAuliffe for much of the evening – only when 88% of the precincts had been counted did McAuliffe take the lead. This was due to the slower reporting of a number of urban precincts. In the end, the result was a closer-than-expected 2.5% margin for McAuliffe at 47.8% to Cuccinelli’s 45.3%. Libertarian Robert Sarvis received 6.5% (slightly below his polling average). The Virginia pre-election polls averaged a 6% margin for McAuliffe.
Unofficial Results of the special election held for U.S. Senate in New Jersey are now available. This contest, held on the unusual date of Wednesday, October 16, 2013, was between Newark Mayor Cory Booker (D), businessman and former Mayor of Bogota, NJ, Steve Lonegan (R), and six minor party candidates. The preliminary, unofficial results are Booker 54.8%, Lonegan 44.1%, and others 1.2%. Total votes counted thus far are a mere 1.3 million – only 38% of the votes cast in the 2012 General Election where 3.4 million votes were counted for U.S. Senator. Nonetheless, the results of the special election mirror quite closely that of the 2012 General. There was an 8.7% Republican swing and Lonegan picked up the counties of Salem and Somerset, but it wasn’t enough to achieve a win.
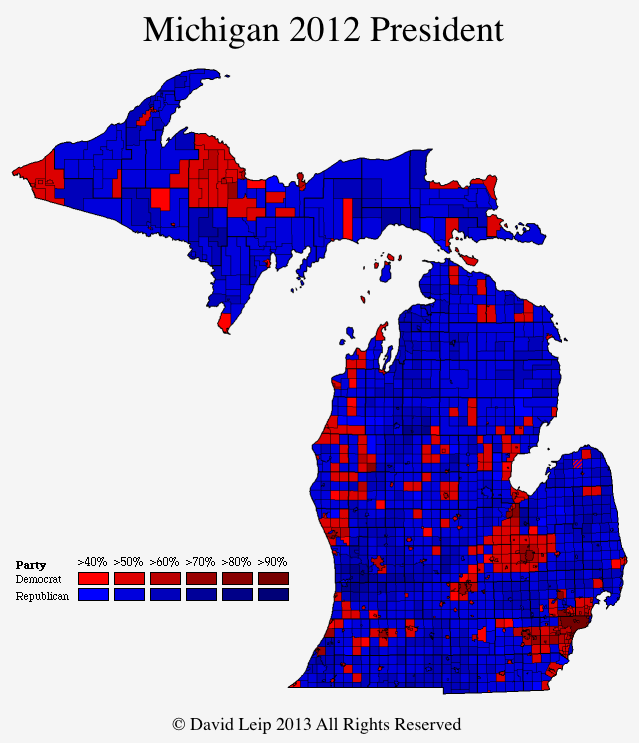
The 2012 Presidential Election Results map for Michigan by county subdivision (City, Township, and Charter Township) is now complete. Mitt Romney and Paul Ryan won a total of 1,133 cities and townships while Barack Obama and Joe Biden won in 382 (eight were ties). This is a significant number of pickups for the Republican ticket vs. 2008, where Obama and Biden won in 684 cities and townships vs. the McCain/Palin ticket’s 830. Similar to many other states, the municipalities with the largest populations voted overwhelmingly Democratic, with Obama/Biden winning nine of the top ten (Detroit, Grand Rapids, Warren, Ann Arbor, Sterling Heights, Clinton, Lansing, Canton, Farmington Hills; Romney won Livonia) with a net margin of 385,875 votes. In the city of Detroit alone, Obama/Biden won 97.6% to 2.1%, a margin of 275,724 votes. Full details can be viewed on the Michigan 2012 Town page.
Bernie Sanders, an independent running for re-election to the United States Senate in Vermont, won all 246 towns in the 2012 General Election. With no Democratic candidate in the contest, Sanders won a solid state-wide victory with 71% of the vote to Republican John MacGovern’s 25%. Chris Ericson of the United States Marijuana party had 2.0% with four other candididates making up the rest (full results). This bested his 2006 result where he received 65% of the vote and won all but two towns (one of the two was a tie).
In recent years, a fairly uniform result across the state in US Senate elections has been relatively common. Republican Jim Jeffords won all towns in 2000, Democrat Patrick Leahy won all but one town in 2004 and all but ten in 2010.
Individual Maine county township maps for the 2008 and 2012 General Elections for President have been created. These include swing, trend, and party maps with full mouse-over image maps. The maps are a result of the recent work to build an election mapping database for Maine to include the unincorporated townships missing from the US Census county subdivision database.
On Wednesday of last week, the 2013 Special US Senate election in Massachusetts (held on June 25) was certified. The final tally is Democratic candidate Ed Markey with 645,249 (54.8%), Republican Gabriel Gomez 525,307 (44.6%), Twelve Visions Party candidate Richard Heos 4,550 (0.4%) and “All Others” with 2,504 (0.2%). The Atlas entry for this election is located here. At right is a thumbnail of the map by city and town (click for larger image). The total ballots cast in this special election was 1,179,781 – over two million votes less than were cast in the 2012 General Election. Even relative to the 2010 Special Election, the number of ballots cast is only half the 2,253,727 ballots cast on January 19, 2010. The 2013 special election stands out in the low-level of turnout.
Compared with the 2010 Special Election (city and town map shown at right), the 2013 map looks quite similar. Only 36 of 351 cities and towns changed color – 35 Scott Brown municipalities were won by Ed Markey and only one (Monroe) was won by both Martha Coakley in 2010 and Gabriel Gomez in 2013. Three towns that were won by Scott Brown in 2010 were ties in 2013. The switch of these towns, however, only represent a margin change of 34,132 votes. A much larger Democratic swing is present (193,307) in the cities and towns that did not change hands. Detailed town data are posted on the individual contest pages (2010 and 2013).