Title: Official US 2010 Census Results
Post by: veritas on November 25, 2010, 07:01:07 PM
Hello, I am new to this website. I hope it will be of help.
I am doing a study on ways to redo the current American system of living. I've done a thorough search, but am unable to find the results from the 2010 Census. If someone knows where I can find this information, and direct me there, it would be much appreciated. Thank you and good luck.
-TheVeritas
I am doing a study on ways to redo the current American system of living. I've done a thorough search, but am unable to find the results from the 2010 Census. If someone knows where I can find this information, and direct me there, it would be much appreciated. Thank you and good luck.
-TheVeritas
Title: Re: U.S 2010 Census Results
Post by: Verily on November 25, 2010, 07:12:06 PM
It hasn't been released yet. I think the first batches of data will come out in mid-December.
Title: Re: U.S 2010 Census Results
Post by: muon2 on November 25, 2010, 11:06:51 PM
The state apportionments will be released before the end of this year. The redistricting data will be released during the first three months of 2011, completed by the end of March.
Title: Re: U.S 2010 Census Results
Post by: Antonio the Sixth on November 26, 2010, 12:58:22 PM
I can't wait for the apportionment data !
Title: Re: U.S 2010 Census Results
Post by: Antonio the Sixth on December 09, 2010, 09:40:17 AM
Well, I think now it should be high time to get the apportionment figures.
Title: Re: U.S 2010 Census Results
Post by: danny on December 09, 2010, 02:49:02 PM
Well, I think now it should be high time to get the apportionment figures.
not long now, but they still have until the end of the month.
Title: Post OFFICIAL 2010 US Census data here
Post by: Tender Branson on December 14, 2010, 04:51:01 AM
It will be released in exactly 1 week:
()
http://2010.census.gov/2010census/data/interactivemap.php
Can anyone please sticky this ?
()
http://2010.census.gov/2010census/data/interactivemap.php
Can anyone please sticky this ?
Title: Re: Post OFFICIAL 2010 US Census data here
Post by: Tender Branson on December 14, 2010, 04:54:37 AM
"Fulfilling its constitutional mandate, the U.S. Census Bureau will release the first set of 2010 Census data at a news conference Tuesday, Dec. 21 at 11 a.m. EST at the National Press Club in Washington, D.C.
The 2010 Census data to be released include the resident population for the nation and the states as well as the congressional apportionment totals for each state. The law requires the Census Bureau to report these results to the President by Dec. 31."
The 2010 Census data to be released include the resident population for the nation and the states as well as the congressional apportionment totals for each state. The law requires the Census Bureau to report these results to the President by Dec. 31."
Title: Re: Post OFFICIAL 2010 US Census data here
Post by: minionofmidas on December 14, 2010, 04:58:16 AM
Oh, and move it to the demographics board maybe?
Title: Re: Post OFFICIAL 2010 US Census data here
Post by: Tender Branson on December 14, 2010, 04:59:45 AM
Oh, and move it to the demographics board maybe?
Please No, it gets more attention here !
Keep it please here for at least 1 month, then move it.
Title: Re: Post OFFICIAL 2010 US Census data here
Post by: nclib on December 14, 2010, 10:23:02 AM
What information will be released in the 2010 census that was not released in the 2000 census and visa versa?
Title: Re: Post OFFICIAL 2010 US Census data here
Post by: Bacon King on December 14, 2010, 10:23:40 AM
Hey, that's an awesome birthday present for them to give me! ;D
Title: Re: Post OFFICIAL 2010 US Census data here
Post by: Tender Branson on December 14, 2010, 01:54:23 PM
Here are the calculated April 1, 2010 benchmark numbers for comparison purposes:
Column 1 = April 1, 2010 population
Column 2 = July 1, 2009 population
Column 3 = July 1, 2008 population
Column 4 = Population growth between July 2008 and July 2009
Column 5 = Percentage growth between July 2008 and July 2009
Column 6 = Population growth between 2008 and 2009 * 0.75 to project April 1, 2000 population
Column 7 = 2000 Census Count
Column 8 = Population growth between 2000 Census and projected 2010 Census count
()
Title: Re: Post OFFICIAL 2010 US Census data here
Post by: Tender Branson on December 15, 2010, 09:58:05 AM
Do you think there will be big errors relative to Mid-2009 estimates ?
Here's a quick overview of CB estimate errors in the 2000 Census:
Percentage Error (Estimates vs. Census Count by state):
()
Numerical Error (Estimates vs. Census Count by state):
()
Here's a quick overview of CB estimate errors in the 2000 Census:
Percentage Error (Estimates vs. Census Count by state):
()
Numerical Error (Estimates vs. Census Count by state):
()
Title: Re: Post OFFICIAL 2010 US Census data here
Post by: Tender Branson on December 17, 2010, 01:48:52 PM
I guess the county and city data will be released sometime next year ?
Title: Re: U.S 2010 Census Results
Post by: muon2 on December 18, 2010, 12:02:04 AM
The census bureau will release (http://2010.census.gov/2010census/data/) the apportionment data on Dec 21. The press conference (http://2010.census.gov/news/releases/cb10-cn92.html) will be at 11 am EST.
Title: Re: Post OFFICIAL 2010 US Census data here
Post by: minionofmidas on December 19, 2010, 03:03:15 PM
At round about what pop. figure would RI lose/MT regain its second seat?
Title: Re: Post OFFICIAL 2010 US Census data here
Post by: 🐒Gods of Prosperity🔱🐲💸 on December 19, 2010, 05:54:04 PM
At round about what pop. figure would RI lose/MT regain its second seat?
assuming 309 mil. total population of 50 states, divided by 435 seats would mean 1 seat per approx. 760 K, so I would guess 1.04 mil would be the threshold for rounding up or down.
Title: Re: Post OFFICIAL 2010 US Census data here
Post by: True Federalist (진정한 연방 주의자) on December 19, 2010, 07:48:30 PM
At round about what pop. figure would RI lose/MT regain its second seat?
assuming 309 mil. total population of 50 states, divided by 435 seats would mean 1 seat per approx. 760 K, so I would guess 1.04 mil would be the threshold for rounding up or down.
For 309M an average seat is 710K, not 760K. Cutoff line between 1 and 2 seats using the current method is approximately √2 of a seat or 1004K. However, because people living in the territories and DC, as well as some people overseas don't count in the apportionment population, the apportionment population will be less than the overall population by several millions, so the cutoff will be around 990K instead.
Title: Re: Post OFFICIAL 2010 US Census data here
Post by: minionofmidas on December 20, 2010, 05:13:29 AM
So RI is not in danger (yet) and MT will likely lose out fairly narrowly for the third time in a row?
Title: Re: Post OFFICIAL 2010 US Census data here
Post by: Grumpier Than Uncle Joe on December 20, 2010, 01:01:25 PM
Headline: New Population Count May Complicate Obama 2012 Bid (http://news.yahoo.com/s/ap/20101219/ap_on_el_ge/us_census_redistricting)
By CHARLES BABINGTON, Associated Press Charles Babington, Associated Press Sun Dec 19, 11:21 am ET
WASHINGTON The 2010 census report coming out Tuesday will include a boatload of good political news for Republicans and grim data for Democrats hoping to re-elect President Barack Obama and rebound from last month's devastating elections.
Title: Re: Post OFFICIAL 2010 US Census data here
Post by: homelycooking on December 20, 2010, 01:04:56 PM
I guess the county and city data will be released sometime next year ?
It will be released February 2010.
Title: Re: U.S 2010 Census Results
Post by: Antonio the Sixth on December 20, 2010, 01:24:03 PM
Tomorrow... :D
Title: Re: Post OFFICIAL 2010 US Census data here
Post by: muon2 on December 20, 2010, 02:03:46 PM
I guess the county and city data will be released sometime next year ?
It will be released February 2010.
Redistricting data, ie data from the full census at the block level, must be released by Mar 31, 2011. Historically, the Census rolls out the data state-by-state over the spans of a few weeks before the deadline. Currently they show that as happening from Feb-Mar 2011. County and city data are built up from the block data.
Title: Re: Post OFFICIAL 2010 US Census data here
Post by: Lunar on December 20, 2010, 08:46:36 PM
Should this be moved to Muon's newly upgraded board?
Title: Re: U.S 2010 Census Results
Post by: ○∙◄☻¥tπ[╪AV┼cVê└ on December 21, 2010, 05:34:15 AM
Well, there will probably be something surprising.
Title: Re: U.S 2010 Census Results
Post by: Antonio the Sixth on December 21, 2010, 05:45:11 AM
So H-5:15 ?
Title: Re: Post OFFICIAL 2010 US Census data here
Post by: minionofmidas on December 21, 2010, 06:00:17 AM
Should this be moved to Muon's newly upgraded board?
Absolutely.
Title: Re: U.S 2010 Census Results
Post by: Devilman88 on December 21, 2010, 09:41:54 AM
Well, there will probably be something surprising.
I think there might be a few surprising results.
Title: Re: U.S 2010 Census Results
Post by: Beefalow and the Consumer on December 21, 2010, 10:38:04 AM
Well, there will probably be something surprising.
I think there might be a few surprising results.
I wrote a congressional apportionment program, which stands ready to plug in the final numbers when made available.
By my own population estimates, here are the final 10 seats:
Seat #426: Texas (35) Priority: 732,184
Seat #427: Alabama (7) Priority: 731,513
Seat #428: California (52) Priority: 724,203
Seat #429: Pennsylvania (18) Priority: 722,748
Seat #430: South Carolina (7) Priority: 714,149
Seat #431: Arizona (10) Priority: 714,054
Seat #432: New York (28) Priority: 712,863
Seat #433: Washington (10) Priority: 712,175
Seat #434: Texas (36) Priority: 711,554
Seat #435: Missouri (9) Priority: 710,867
...and here are the first 10 that don't make the cut:
Seat #436: California (53) Priority: 710,408
Seat #437: Florida (27) Priority: 710,227
Seat #438: Minnesota (8 ) Priority: 708,831
Seat #439: North Carolina (14) Priority: 707,359
Seat #440: Oregon (6) Priority: 707,156
Seat #441: Illinois (19) Priority: 701,047
Seat #442: Ohio (17) Priority: 701,021
Seat #443: New Jersey (13) Priority: 699,490
Seat #444: Massachusetts (10) Priority: 697,903
Seat #445: California (54) Priority: 697,128
Stay tuned...
Love,
Your friendly neighborhood Beef.
Title: Re: Official US 2010 Census Results
Post by: Devilman88 on December 21, 2010, 10:46:04 AM
its almost time!
Title: Re: Official US 2010 Census Results
Post by: Brittain33 on December 21, 2010, 11:15:08 AM
Wow, they are milking the nation's attention for all it is worth. Locke is lashing out at people who predicted budget overruns and failure by boasting of what a good job they did.
I'll post numbers as he says them.
Blah blah we are so awesome at censusing blah blah
I'll post numbers as he says them.
Blah blah we are so awesome at censusing blah blah
Title: Re: Official US 2010 Census Results
Post by: Devilman88 on December 21, 2010, 11:15:43 AM
im watching it now too... shut up and give us the numbers
Title: Re: Official US 2010 Census Results
Post by: minionofmidas on December 21, 2010, 11:16:16 AM
...attentive silence...
Title: Re: Official US 2010 Census Results
Post by: Devilman88 on December 21, 2010, 11:16:53 AM
and we wait..... and wait..
Title: Re: Official US 2010 Census Results
Post by: Brittain33 on December 21, 2010, 11:17:16 AM
He just thanked all of us. You're welcome!
Title: Re: Official US 2010 Census Results
Post by: Brittain33 on December 21, 2010, 11:18:02 AM
Data geeks all over the country are going Showtime at the Apollo on Gary Locke. "Boooo... get off the stage!!"
Title: Re: Official US 2010 Census Results
Post by: Antonio the Sixth on December 21, 2010, 11:18:23 AM
So ?
Title: Re: Official US 2010 Census Results
Post by: Brittain33 on December 21, 2010, 11:18:51 AM
I'll post info as soon as they release it. So far it is all congratulations, thanks, and Why the Census Matters.
Title: Re: Official US 2010 Census Results
Post by: minionofmidas on December 21, 2010, 11:19:39 AM
I'll post info as soon as they release it. So far it is all congratulations, thanks, and Why the Census Matters.
Title: Re: Official US 2010 Census Results
Post by: Antonio the Sixth on December 21, 2010, 11:20:35 AM
I'll post info as soon as they release it. So far it is all congratulations, thanks, and Why the Census Matters.
...
Do you have a link in which I can see it live ?
Title: Re: Official US 2010 Census Results
Post by: Brittain33 on December 21, 2010, 11:21:00 AM
http://www.c-span.org/Live-Video/C-SPAN3/
Title: Re: Official US 2010 Census Results
Post by: Sam Spade on December 21, 2010, 11:21:06 AM
Did you all really expect a release at 11:00 AM?
Title: Re: Official US 2010 Census Results
Post by: Brittain33 on December 21, 2010, 11:21:21 AM
Yes, Sam, you're very smart.
Title: Re: Official US 2010 Census Results
Post by: Sbane on December 21, 2010, 11:22:21 AM
These people really like talking.
Title: Re: Official US 2010 Census Results
Post by: Brittain33 on December 21, 2010, 11:22:58 AM
308,745,538
Title: Re: Official US 2010 Census Results
Post by: Brittain33 on December 21, 2010, 11:23:52 AM
9.7% growth
Title: Re: Official US 2010 Census Results
Post by: Alcon on December 21, 2010, 11:24:05 AM
U.S. population as of April 1, 2000: 281,421,906
U.S. population as of April 1, 2010: 308,745,538 (+9.7%)
(claps for breeding, unnecessary pause)
U.S. population as of April 1, 2010: 308,745,538 (+9.7%)
(claps for breeding, unnecessary pause)
Title: Re: Official US 2010 Census Results
Post by: Sam Spade on December 21, 2010, 11:24:32 AM
Yes, Sam, you're very smart.
Not really - rather bureaucrats are rather predictable. :)
Title: Re: Official US 2010 Census Results
Post by: Brittain33 on December 21, 2010, 11:24:44 AM
How does this compare with estimates?
Title: Re: Official US 2010 Census Results
Post by: minionofmidas on December 21, 2010, 11:24:55 AM
Marginally below estimates.
Title: Re: Official US 2010 Census Results
Post by: Brittain33 on December 21, 2010, 11:25:14 AM
NV: 35.1% growth.
MI: decline of 0.6%
MI: decline of 0.6%
Title: Re: Official US 2010 Census Results
Post by: minionofmidas on December 21, 2010, 11:25:37 AM
Funny how I twice came up against "new reply" thingies, but the second asked the question I was going to answer anyways.
Title: Re: Official US 2010 Census Results
Post by: Brittain33 on December 21, 2010, 11:26:02 AM
Regions. NY. 2.1%. MN 7.8%! 8 seats I assume.
Title: Re: Official US 2010 Census Results
Post by: memphis on December 21, 2010, 11:26:08 AM
This isn't wikileaks. They don't just dump their data. Enjoy the suspense.
Title: Re: Official US 2010 Census Results
Post by: Brittain33 on December 21, 2010, 11:28:04 AM
AZ 1
FL 2
GA 1
NV 1
SC 1
TX 4
UT 1
WA 1
FL 2
GA 1
NV 1
SC 1
TX 4
UT 1
WA 1
Title: Re: Official US 2010 Census Results
Post by: Antonio the Sixth on December 21, 2010, 11:28:20 AM
http://www.c-span.org/Live-Video/C-SPAN3/
Thanks. :D
If only this damn like could load... :(
Title: Re: Official US 2010 Census Results
Post by: Brittain33 on December 21, 2010, 11:28:30 AM
IL 1
IA 1
LA 1
MA 1
MI 1
MI 1
NJ 1
NY 2 !!!!!
OH 2
PA 1
IA 1
LA 1
MA 1
MI 1
MI 1
NJ 1
NY 2 !!!!!
OH 2
PA 1
Title: Re: Official US 2010 Census Results
Post by: Alcon on December 21, 2010, 11:28:53 AM
House apportionment:
AZ +1
FL +2
GA +1
NV +1
SC +1
TX +4
UT +1
WA +1
Losing (-1 unless noted): IL, IA, LA, MA, MI, MO, NJ, NY (-2), OH, PA
AZ +1
FL +2
GA +1
NV +1
SC +1
TX +4
UT +1
WA +1
Losing (-1 unless noted): IL, IA, LA, MA, MI, MO, NJ, NY (-2), OH, PA
Title: Re: Official US 2010 Census Results
Post by: Antonio the Sixth on December 21, 2010, 11:29:36 AM
Texas +4 ?! Holy sh*t. :(
Title: Re: Official US 2010 Census Results
Post by: Brittain33 on December 21, 2010, 11:30:26 AM
Ok, turning off the tv.
Title: Re: Official US 2010 Census Results
Post by: memphis on December 21, 2010, 11:30:39 AM
First time ever California didn't gain.
Title: Re: Official US 2010 Census Results
Post by: Beefalow and the Consumer on December 21, 2010, 11:30:48 AM
Regions. NY. 2.1%. MN 7.8%! 8 seats I assume.
It all depends on how CA, FL, MO, and TX do. My numbers have those four, plus MN, duking it out for the final two seats.
NC and OR and also in the running. We'll see when we get actual numbers.
Title: Re: Official US 2010 Census Results
Post by: Brittain33 on December 21, 2010, 11:30:58 AM
OH -1 or -2? I thought it was -2.
Title: Re: Official US 2010 Census Results
Post by: minionofmidas on December 21, 2010, 11:31:31 AM
Now I want the total figures per state.
Title: Re: Official US 2010 Census Results
Post by: Antonio the Sixth on December 21, 2010, 11:31:46 AM
Wait... AZ+1 only, and FL+2 ?
And how the hell did Ohio lose only one seat !!!
And how the hell did Ohio lose only one seat !!!
Title: Re: Official US 2010 Census Results
Post by: Sam Spade on December 21, 2010, 11:32:15 AM
NYC area reps are not gonna be happy tomorrow. Missouri lost a seat? Everything else looks about as expected. Ohio was supposed to lose 2, what's the story there?
Title: Re: Official US 2010 Census Results
Post by: Beefalow and the Consumer on December 21, 2010, 11:32:40 AM
First time ever California didn't gain.
They were lucky not to lose a seat.
Title: Re: Official US 2010 Census Results
Post by: minionofmidas on December 21, 2010, 11:32:49 AM
OH -1 or -2? I thought it was -2.
Yeah, AZ+1 is the most obviously surprising thing here.
Title: Re: Official US 2010 Census Results
Post by: Beefalow and the Consumer on December 21, 2010, 11:33:38 AM
Wait... AZ+1 only, and FL+2 ?
And how the hell did Ohio lose only one seat !!!
And how the hell did Ohio lose only one seat !!!
I'll have the actual apportionment once I get real numbers. I can also tell you how many more people each state needed to gain/keep a seat.
Title: Re: Official US 2010 Census Results
Post by: minionofmidas on December 21, 2010, 11:33:46 AM
...simply because the totals don't add up otherwise.
Title: Re: Official US 2010 Census Results
Post by: memphis on December 21, 2010, 11:34:14 AM
Memo to census guy: alaska wasn't a state in 1910.
Title: Re: Official US 2010 Census Results
Post by: Alcon on December 21, 2010, 11:34:35 AM
I've been trying to post "OH -2"* for several minutes but people keep posting first :P
Title: Re: Official US 2010 Census Results
Post by: ilikeverin on December 21, 2010, 11:36:34 AM
Yay Minnesota! You can hang in there! :D
Title: Re: Official US 2010 Census Results
Post by: Beefalow and the Consumer on December 21, 2010, 11:37:22 AM
OH -1 or -2? I thought it was -2.
Yeah, AZ+1 is the most obviously surprising thing here.
Not that surprising to me. By my estimated population numbers I had the LAST FIVE seats going as follows:
Arizona 10th +2
New York 28th -1
Washington 10th +1
Texas 36th +4
Missouri 9th
The NEXT FIVE were as such:
California 53rd
Florida 27th +2
Minnesota 8th
North Carolina 14th +1
Oregon 6th +1
Title: Re: Official US 2010 Census Results
Post by: minionofmidas on December 21, 2010, 11:39:10 AM
Not that surprising to me. By my estimated population numbers I had the LAST FIVE seats going as follows:
Arizona 10th +2
New York 28th -1
Washington 10th +1
Texas 36th +4
Missouri 9th
The NEXT FIVE were as such:
California 53rd
Florida 27th +2
Minnesota 8th
North Carolina 14th +1
Oregon 6th +1
Arizona 10th +2
New York 28th -1
Washington 10th +1
Texas 36th +4
Missouri 9th
The NEXT FIVE were as such:
California 53rd
Florida 27th +2
Minnesota 8th
North Carolina 14th +1
Oregon 6th +1
Title: Re: Official US 2010 Census Results
Post by: Antonio the Sixth on December 21, 2010, 11:40:47 AM
So Ohio lost 1 or 2 ? ???
Title: Re: Official US 2010 Census Results
Post by: Brittain33 on December 21, 2010, 11:43:02 AM
OHIO LOST 2
Title: Re: Official US 2010 Census Results
Post by: Antonio the Sixth on December 21, 2010, 11:44:13 AM
OK, does anyone have the exact figures ?
Title: Re: Official US 2010 Census Results
Post by: Beefalow and the Consumer on December 21, 2010, 11:44:47 AM
So three "errors" (AZ, NY, MO vs CA, FL, MN) but all in the top five, or is anything else wrong? Still makes Arizona the most surprising.
It depends on a lot of factors, like how much population movement there was in the past year, how much of it was unexpected, and so forth. Also, my numbers were based solely on estimates, whereas the final results are an actual headcount (or as close to a headcount as we can come).
The estimates for Arizona and New York were obviously high.
Once I have solid numbers, I will let you know how many people each state needed for its next seat. Between those last few seats, it will be really close. A few thousand people, or maybe even under a thousand.
In 2000, UT was only a few hundred people away from getting the last seat, which went to NC instead.
Title: Re: Official US 2010 Census Results
Post by: Devilman88 on December 21, 2010, 11:45:30 AM
Go on there website its there
Title: Re: Official US 2010 Census Results
Post by: ilikeverin on December 21, 2010, 11:45:46 AM
Check out the data: http://2010.census.gov/2010census/data/
Title: Re: Official US 2010 Census Results
Post by: Beefalow and the Consumer on December 21, 2010, 11:46:21 AM
Illinois had a BETTER chance of keeping ALL its seats than Ohio had of losing only one. My numbers had them getting seat #442 to go -1.
Title: Re: Official US 2010 Census Results
Post by: Beefalow and the Consumer on December 21, 2010, 11:47:56 AM
Check out the data: http://2010.census.gov/2010census/data/
Brutal!
Gotta get lunch, then I'll try to get some apportionment order and other info for y'all.
Title: Re: Official US 2010 Census Results
Post by: Brittain33 on December 21, 2010, 11:49:15 AM
Check out the data: http://2010.census.gov/2010census/data/
Brutal!
Gotta get lunch, then I'll try to get some apportionment order and other info for y'all.
Are you seeing 2010 data there? It still looks like it hasn't been loaded.
Title: Re: Official US 2010 Census Results
Post by: Devilman88 on December 21, 2010, 11:49:37 AM
North Carolina grew faster then GA, that is shocking
Title: Re: Official US 2010 Census Results
Post by: ilikeverin on December 21, 2010, 11:50:10 AM
Check out the data: http://2010.census.gov/2010census/data/
Brutal!
Gotta get lunch, then I'll try to get some apportionment order and other info for y'all.
Are you seeing 2010 data there? It still looks like it hasn't been loaded.
Click any of the "View as html" links.
Title: Re: Official US 2010 Census Results
Post by: Sam Spade on December 21, 2010, 11:50:28 AM
EV totals (when someone gets makes a pretty map). House reps = -2, except for DC
AK 3
AL 9
AR 6
AZ 11 (+1)
CA 55
CO 9
CT 7
DC 3
DE 3
FL 29 (+2)
GA 16 (+1)
HI 4
IA 6 (-1)
ID 4
IL 20 (-1)
IN 11
KS 6
KY 8
LA 8 (-1)
MA 11 (-1)
MD 10
ME 4
MI 16 (-1)
MN 10
MO 10 (-1)
MS 6
MT 3
NC 15
ND 3
NE 5
NH 4
NJ 14 (-1)
NM 5
NV 6 (+1)
NY 29 (-2)
OH 18 (-2)
OK 7
OR 7
PA 20 (-1)
RI 4
SC 9 (+1)
SD 3
TN 11
TX 38 (+4)
UT 6 (+1)
VA 13
VT 3
WA 12 (+1)
WI 10
WV 5
WY 3
Title: Re: Official US 2010 Census Results
Post by: Antonio the Sixth on December 21, 2010, 11:50:40 AM
Check out the data: http://2010.census.gov/2010census/data/
Still not updated.
Title: Re: Official US 2010 Census Results
Post by: Sam Spade on December 21, 2010, 11:52:40 AM
http://2010.census.gov/2010census/data/apportionment-pop-text.php
Title: Re: Official US 2010 Census Results
Post by: Sam Spade on December 21, 2010, 11:53:18 AM
http://2010.census.gov/2010census/data/apportionment-data-text.php
Title: Re: Official US 2010 Census Results
Post by: Devilman88 on December 21, 2010, 11:53:29 AM
North Carolina was the next in line to gain seat
Title: Re: Official US 2010 Census Results
Post by: Brittain33 on December 21, 2010, 11:54:59 AM
Whoa, Mass. still has more people than Arizona. I think AZ had passed Mass. or come close to it in estimates recently.
Title: Re: Official US 2010 Census Results
Post by: Devilman88 on December 21, 2010, 12:00:12 PM
North Carolina was the 6th fasting growing state.
Title: Re: Official US 2010 Census Results
Post by: Antonio the Sixth on December 21, 2010, 12:00:38 PM
So that's :
- TX +4
- FL +2
- AZ, GA, NV, SC, UT, WA +1
- IA, IL, LA, MA, MI, MO, NJ, PA -1
- NY, OH -2
- TX +4
- FL +2
- AZ, GA, NV, SC, UT, WA +1
- IA, IL, LA, MA, MI, MO, NJ, PA -1
- NY, OH -2
Title: Re: Official US 2010 Census Results
Post by: Mr. Morden on December 21, 2010, 12:00:53 PM
Check out the data: http://2010.census.gov/2010census/data/
Brutal!
Gotta get lunch, then I'll try to get some apportionment order and other info for y'all.
Are you seeing 2010 data there? It still looks like it hasn't been loaded.
Just click on the links under "view as HTML" or "download as CSV". All the data is there.
Title: Re: Official US 2010 Census Results
Post by: Antonio the Sixth on December 21, 2010, 12:02:28 PM
Surprises are :
- Texas (should have gained 3)
- Florida (should have gained 1)
- Arizona (should have gained 2)
- Minnesota (should have lost 1)
- New York (should have lost 1)
- Missouri (should have stayed the same)
- Texas (should have gained 3)
- Florida (should have gained 1)
- Arizona (should have gained 2)
- Minnesota (should have lost 1)
- New York (should have lost 1)
- Missouri (should have stayed the same)
Title: Re: Official US 2010 Census Results
Post by: Storebought on December 21, 2010, 12:05:44 PM
Pennsylvania has lost seats in every reapportionment.
Title: Re: Official US 2010 Census Results
Post by: Devilman88 on December 21, 2010, 12:28:30 PM
(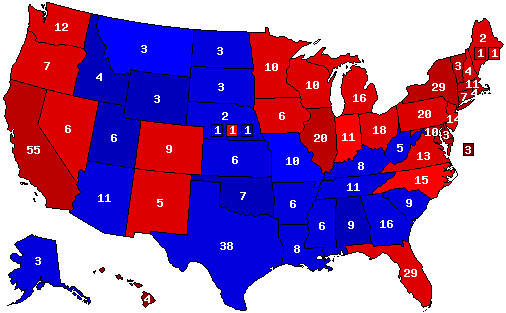 )
)
This is the new map
This is the new map
Title: Re: Official US 2010 Census Results
Post by: Beefalow and the Consumer on December 21, 2010, 12:41:40 PM
LAST TEN SEATS:
Seat #426: Texas 35 (+3) Priority: 728,933
Seat #427: Pennsylvania 18 (-1) Priority: 726,147
Seat #428: California 52 (-1) Priority: 723,412
Seat #429: Georgia 14 (+1) Priority: 718,097
Seat #430: South Carolina 7 (+1) Priority: 713,709
Seat #431: California 53 (nc) Priority: 709,631
Seat #432: Florida 27 (+2) Priority: 709,610
Seat #433: Washington 10 (+1) Priority: 708,829
Seat #434: Minnesota 8 (nc) Priority: 708,767
Seat #435: Texas 36 (+4) Priority: 708,396
NEXT TEN SEATS
Seat #436: North Carolina 14 (+1) Priority: 706,817
Seat #437: Missouri 9 (nc) Priority: 705,802
Seat #438: New York 28 (-1) Priority: 704,775
Seat #439: New Jersey 13 (nc) Priority: 703,915
Seat #440: Montana 2 (+1) Priority: 699,622
Seat #441: Louisiana 7 (nc) Priority: 699,514
Seat #442: Ohio 17 (-1) Priority: 699,503
Seat #443: Oregon 6 (+1) Priority: 699,455
Seat #444: Virginia 12 (+1) Priority: 696,400
Seat #445: California 54 (+1) Priority: 696,366
Title: Re: Official US 2010 Census Results
Post by: Antonio the Sixth on December 21, 2010, 12:48:08 PM
()
This is the new map
This is the new map
With a tied Popular vote, Obama leads McCain 272/266.
Title: Re: Official US 2010 Census Results
Post by: Beefalow and the Consumer on December 21, 2010, 12:48:51 PM
Here's the total apportionment run:
Seat #51: California 2
Seat #52: Texas 2
Seat #53: California 3
Seat #54: New York 2
Seat #55: Florida 2
Seat #56: California 4
Seat #57: Texas 3
Seat #58: Illinois 2
Seat #59: Pennsylvania 2
Seat #60: California 5
Seat #61: Ohio 2
Seat #62: New York 3
Seat #63: Florida 3
Seat #64: Texas 4
Seat #65: Michigan 2
Seat #66: Georgia 2
Seat #67: California 6
Seat #68: North Carolina 2
Seat #69: New Jersey 2
Seat #70: California 7
Seat #71: Virginia 2
Seat #72: Texas 5
Seat #73: New York 4
Seat #74: Florida 4
Seat #75: Illinois 3
Seat #76: Pennsylvania 3
Seat #77: California 8
Seat #78: Washington 2
Seat #79: Ohio 3
Seat #80: Massachusetts 2
Seat #81: Texas 6
Seat #82: Indiana 2
Seat #83: Arizona 2
Seat #84: Tennessee 2
Seat #85: California 9
Seat #86: New York 5
Seat #87: Missouri 2
Seat #88: Florida 5
Seat #89: Maryland 2
Seat #90: Michigan 3
Seat #91: Wisconsin 2
Seat #92: Georgia 3
Seat #93: California 10
Seat #94: North Carolina 3
Seat #95: Texas 7
Seat #96: Minnesota 2
Seat #97: Illinois 4
Seat #98: Pennsylvania 4
Seat #99: New Jersey 3
Seat #100: Colorado 2
Seat #101: California 11
Seat #102: New York 6
Seat #103: Florida 6
Seat #104: Alabama 2
Seat #105: Texas 8
Seat #106: Ohio 4
Seat #107: South Carolina 2
Seat #108: Virginia 3
Seat #109: California 12
Seat #110: Louisiana 2
Seat #111: Kentucky 2
Seat #112: New York 7
Seat #113: California 13
Seat #114: Texas 9
Seat #115: Florida 7
Seat #116: Illinois 5
Seat #117: Michigan 4
Seat #118: Pennsylvania 5
Seat #119: Georgia 4
Seat #120: California 14
Seat #121: North Carolina 4
Seat #122: Washington 3
Seat #123: Oregon 2
Seat #124: Massachusetts 3
Seat #125: Oklahoma 2
Seat #126: Texas 10
Seat #127: Indiana 3
Seat #128: Arizona 3
Seat #129: Tennessee 3
Seat #130: New York 8
Seat #131: Ohio 5
Seat #132: California 15
Seat #133: New Jersey 4
Seat #134: Connecticut 2
Seat #135: Florida 8
Seat #136: Missouri 3
Seat #137: California 16
Seat #138: Texas 11
Seat #139: Maryland 3
Seat #140: Illinois 6
Seat #141: Wisconsin 3
Seat #142: Pennsylvania 6
Seat #143: Virginia 4
Seat #144: New York 9
Seat #145: California 17
Seat #146: Florida 9
Seat #147: Michigan 5
Seat #148: Texas 12
Seat #149: Georgia 5
Seat #150: Minnesota 3
Seat #151: Iowa 2
Seat #152: North Carolina 5
Seat #153: California 18
Seat #154: Ohio 6
Seat #155: Mississippi 2
Seat #156: Arkansas 2
Seat #157: Colorado 3
Seat #158: New York 10
Seat #159: Kansas 2
Seat #160: California 19
Seat #161: Texas 13
Seat #162: Florida 10
Seat #163: Illinois 7
Seat #164: New Jersey 5
Seat #165: Pennsylvania 7
Seat #166: Utah 2
Seat #167: Alabama 3
Seat #168: Washington 4
Seat #169: California 20
Seat #170: Nevada 2
Seat #171: Massachusetts 4
Seat #172: South Carolina 3
Seat #173: Indiana 4
Seat #174: Texas 14
Seat #175: Louisiana 3
Seat #176: New York 11
Seat #177: Arizona 4
Seat #178: Tennessee 4
Seat #179: California 21
Seat #180: Michigan 6
Seat #181: Florida 11
Seat #182: Virginia 5
Seat #183: Ohio 7
Seat #184: Kentucky 3
Seat #185: Georgia 6
Seat #186: North Carolina 6
Seat #187: Texas 15
Seat #188: California 22
Seat #189: Missouri 4
Seat #190: Illinois 8
Seat #191: Pennsylvania 8
Seat #192: New York 12
Seat #193: Maryland 4
Seat #194: California 23
Seat #195: Wisconsin 4
Seat #196: Florida 12
Seat #197: Texas 16
Seat #198: New Jersey 6
Seat #199: California 24
Seat #200: Oregon 3
Seat #201: New York 13
Seat #202: Ohio 8
Seat #203: Oklahoma 3
Seat #204: Minnesota 4
Seat #205: Michigan 7
Seat #206: Texas 17
Seat #207: California 25
Seat #208: Illinois 9
Seat #209: Florida 13
Seat #210: Washington 5
Seat #211: Pennsylvania 9
Seat #212: Georgia 7
Seat #213: North Carolina 7
Seat #214: Massachusetts 5
Seat #215: California 26
Seat #216: Virginia 6
Seat #217: Connecticut 3
Seat #218: New Mexico 2
Seat #219: Colorado 4
Seat #220: Indiana 5
Seat #221: Texas 18
Seat #222: New York 14
Seat #223: Arizona 5
Seat #224: Tennessee 5
Seat #225: California 27
Seat #226: Florida 14
Seat #227: Alabama 4
Seat #228: Texas 19
Seat #229: Ohio 9
Seat #230: New Jersey 7
Seat #231: California 28
Seat #232: Illinois 10
Seat #233: Missouri 5
Seat #234: Pennsylvania 10
Seat #235: New York 15
Seat #236: South Carolina 4
Seat #237: Michigan 8
Seat #238: West Virginia 2
Seat #239: Louisiana 4
Seat #240: California 29
Seat #241: Florida 15
Seat #242: Georgia 8
Seat #243: Nebraska 2
Seat #244: Maryland 5
Seat #245: Texas 20
Seat #246: North Carolina 8
Seat #247: Wisconsin 5
Seat #248: California 30
Seat #249: Kentucky 4
Seat #250: New York 16
Seat #251: Iowa 3
Seat #252: Virginia 7
Seat #253: Washington 6
Seat #254: Texas 21
Seat #255: Illinois 11
Seat #256: California 31
Seat #257: Ohio 10
Seat #258: Florida 16
Seat #259: Mississippi 3
Seat #260: Pennsylvania 11
Seat #261: Massachusetts 6
Seat #262: Arkansas 3
Seat #263: Minnesota 5
Seat #264: Indiana 6
Seat #265: California 32
Seat #266: New York 17
Seat #267: New Jersey 8
Seat #268: Texas 22
Seat #269: Arizona 6
Seat #270: Michigan 9
Seat #271: Kansas 3
Seat #272: Tennessee 6
Seat #273: California 33
Seat #274: Georgia 9
Seat #275: Florida 17
Seat #276: Utah 3
Seat #277: Colorado 5
Seat #278: North Carolina 9
Seat #279: Texas 23
Seat #280: Illinois 12
Seat #281: California 34
Seat #282: Idaho 2
Seat #283: New York 18
Seat #284: Oregon 4
Seat #285: Pennsylvania 12
Seat #286: Nevada 3
Seat #287: Ohio 11
Seat #288: Missouri 6
Seat #289: Oklahoma 4
Seat #290: California 35
Seat #291: Florida 18
Seat #292: Texas 24
Seat #293: Virginia 8
Seat #294: Alabama 5
Seat #295: Maryland 6
Seat #296: California 36
Seat #297: New York 19
Seat #298: Michigan 10
Seat #299: Wisconsin 6
Seat #300: Washington 7
Seat #301: New Jersey 9
Seat #302: South Carolina 5
Seat #303: Connecticut 4
Seat #304: Illinois 13
Seat #305: Texas 25
Seat #306: Georgia 10
Seat #307: California 37
Seat #308: Pennsylvania 13
Seat #309: Florida 19
Seat #310: Louisiana 5
Seat #311: Massachusetts 7
Seat #312: North Carolina 10
Seat #313: Ohio 12
Seat #314: Indiana 7
Seat #315: New York 20
Seat #316: California 38
Seat #317: Arizona 7
Seat #318: Texas 26
Seat #319: Tennessee 7
Seat #320: Kentucky 5
Seat #321: Minnesota 6
Seat #322: California 39
Seat #323: Florida 20
Seat #324: Hawaii 2
Seat #325: Illinois 14
Seat #326: Texas 27
Seat #327: New York 21
Seat #328: California 40
Seat #329: Virginia 9
Seat #330: Michigan 11
Seat #331: Pennsylvania 14
Seat #332: Maine 2
Seat #333: New Hampshire 2
Seat #334: New Jersey 10
Seat #335: Missouri 7
Seat #336: Georgia 11
Seat #337: Ohio 13
Seat #338: California 41
Seat #339: Colorado 6
Seat #340: Florida 21
Seat #341: Texas 28
Seat #342: North Carolina 11
Seat #343: New York 22
Seat #344: Washington 8
Seat #345: California 42
Seat #346: Maryland 7
Seat #347: Illinois 15
Seat #348: Texas 29
Seat #349: Iowa 4 (-1)
Seat #350: Wisconsin 7
Seat #351: California 43
Seat #352: Pennsylvania 15
Seat #353: Massachusetts 8
Seat #354: Florida 22
Seat #355: Alabama 6
Seat #356: Indiana 8
Seat #357: New York 23
Seat #358: Michigan 12
Seat #359: Oregon 5
Seat #360: Mississippi 4
Seat #361: California 44
Seat #362: Ohio 14
Seat #363: Arizona 8
Seat #364: Texas 30
Seat #365: Tennessee 8
Seat #366: South Carolina 6
Seat #367: Virginia 10
Seat #368: Georgia 12
Seat #369: Arkansas 4
Seat #370: New Mexico 3
Seat #371: Oklahoma 5
Seat #372: New Jersey 11
Seat #373: California 45
Seat #374: Florida 23
Seat #375: North Carolina 12
Seat #376: Illinois 16
Seat #377: Louisiana 6 (-1)
Seat #378: New York 24
Seat #379: Texas 31
Seat #380: Kansas 4
Seat #381: Pennsylvania 16
Seat #382: California 46
Seat #383: Minnesota 7
Seat #384: California 47
Seat #385: Missouri 8 (-1)
Seat #386: Florida 24
Seat #387: Connecticut 5
Seat #388: Texas 32
Seat #389: Utah 4 (+1)
Seat #390: Ohio 15
Seat #391: Washington 9
Seat #392: Kentucky 6
Seat #393: Michigan 13
Seat #394: New York 25
Seat #395: California 48
Seat #396: Nevada 4 (+1)
Seat #397: Illinois 17
Seat #398: Colorado 7
Seat #399: Georgia 13
Seat #400: Texas 33 (+1)
Seat #401: Massachusetts 9 (-1)
Seat #402: Maryland 8
Seat #403: Pennsylvania 17
Seat #404: California 49
Seat #405: Florida 25
Seat #406: New Jersey 12 (-1)
Seat #407: Indiana 9
Seat #408: North Carolina 13
Seat #409: Virginia 11
Seat #410: New York 26
Seat #411: Wisconsin 8
Seat #412: West Virginia 3
Seat #413: Arizona 9 (+1)
Seat #414: California 50
Seat #415: Texas 34 (+2)
Seat #416: Tennessee 9
Seat #417: Nebraska 3
Seat #418: Ohio 16 (-2)
Seat #419: Rhode Island 2
Seat #420: California 51
Seat #421: Alabama 7
Seat #422: Florida 26 (+1)
Seat #423: Illinois 18 (-1)
Seat #424: Michigan 14 (-1)
Seat #425: New York 27 (-2)
Seat #426: Texas 35 (+3)
Seat #427: Pennsylvania 18 (-1)
Seat #428: California 52
Seat #429: Georgia 14 (+1)
Seat #430: South Carolina 7 (+1)
Seat #431: California 53
Seat #432: Florida 27 (+2)
Seat #433: Washington 10 (+1)
Seat #434: Minnesota 8
Seat #435: Texas 36 (+4)
Title: Re: Official US 2010 Census Results
Post by: Antonio the Sixth on December 21, 2010, 12:54:07 PM
Oo
I made this list for the 2000 census and it took me a couple of weeks !
I made this list for the 2000 census and it took me a couple of weeks !
Title: Re: Official US 2010 Census Results
Post by: dpmapper on December 21, 2010, 12:54:55 PM
So who is the biggest loser of today's numbers? I nominate Russ Carnahan.
Title: Re: Official US 2010 Census Results
Post by: Beefalow and the Consumer on December 21, 2010, 12:55:55 PM
Oo
I made this list for the 2000 census and it took me a couple of weeks !
I made this list for the 2000 census and it took me a couple of weeks !
I code for a living :).
Never used the POI spreadsheet library in Java before. That took the most time. But now I know something new :D.
Title: Re: Post OFFICIAL 2010 US Census data here
Post by: jimrtex on December 21, 2010, 01:03:45 PM
So RI is not in danger (yet) and MT will likely lose out fairly narrowly for the third time in a row?
Losers in 2020:
AL, IL, MI, MN, NY, OH, PA,
Possible:
NE, NJ, PA(2), RI, WV, WI
The small losers would be ranked WV, RI, NE in terms of likelihood of losing seats.
Gainers in 2020:
AZ, CO, FL, GA, NC, OR, TX(3)
Possible:
ID, UT, VA
It could end up based on whether ID surpasses NE in population (this is a necessary condition for ID to gain a seat, and NE to lose a seat, but it is not a sufficient condition).
Title: Re: Official US 2010 Census Results
Post by: Beefalow and the Consumer on December 21, 2010, 01:26:33 PM
State closest to gaining a another seat
1. Montana (needed 12,409 more people)
2. North Carolina (21,301 short)
3. Missouri (22,012 short)
4. Oregon (48,971 short)
5. New Jersey (about 56,000)
6. Louisiana (about 58,000)
7. New York (almost 100,000 short)
I believe all other states would need population pickups of more than 100,000.
1. Montana (needed 12,409 more people)
2. North Carolina (21,301 short)
3. Missouri (22,012 short)
4. Oregon (48,971 short)
5. New Jersey (about 56,000)
6. Louisiana (about 58,000)
7. New York (almost 100,000 short)
I believe all other states would need population pickups of more than 100,000.
Title: Re: Official US 2010 Census Results
Post by: Sam Spade on December 21, 2010, 01:29:40 PM
So who is the biggest loser of today's numbers? I nominate Russ Carnahan.
Some NYC area Dem rep is also royally f-ed today. Which one do you think it will be? Most likely Ackerman, Maloney or Crowley, based on previous talk.
Title: Re: Official US 2010 Census Results
Post by: Brittain33 on December 21, 2010, 01:32:02 PM
So who is the biggest loser of today's numbers? I nominate Russ Carnahan.
Some NYC area Dem rep is also royally f-ed today. Which one do you think it will be? Most likely Ackerman, Maloney or Crowley, based on previous talk.
Yes; my vote's on Ackerman.
Title: Re: Official US 2010 Census Results
Post by: Filuwaúrdjan on December 21, 2010, 01:48:30 PM
Long time no see Beef :)
Title: Re: Official US 2010 Census Results
Post by: Beefalow and the Consumer on December 21, 2010, 01:50:27 PM
The closest margin any state had in earning a seat was Minnesota. By my calculation, they were 14,977 people above the threshold needed to keep their 8th seat. Otherwise they would have lost that seat to North Carolina.
There's nothing in these results that will be challenged, I think. Pretty clear cut. It's not like in 2000 when we had a razor-thin margin between UT and NC for the last seat.
There's nothing in these results that will be challenged, I think. Pretty clear cut. It's not like in 2000 when we had a razor-thin margin between UT and NC for the last seat.
Title: Re: Official US 2010 Census Results
Post by: cinyc on December 21, 2010, 01:55:01 PM
So Michigan lost population and Rhode Island almost did (+0.4%). DC gained population for the first time since the 1950 census. And Texas gained as many residents in the last decade as live in a state like Louisiana or Kentucky.
Some NYC area Dem rep is also royally f-ed today. Which one do you think it will be? Most likely Ackerman, Maloney or Crowley, based on previous talk.
From a map drawing aesthetics perspective, it should be Engel in NY-17. His district is the ugliest (other than Velasquez' NY-12, which won't be axed due to racial reasons). There's no reason at all why the Bronx should share a district with Rockland County.
Obviously, the other dead district is going to have to come from Upstate. NY-23 is probably most vulnerable to being carved up due to likely population loss and the sheer size of it.
So who is the biggest loser of today's numbers? I nominate Russ Carn.ahan.
Some NYC area Dem rep is also royally f-ed today. Which one do you think it will be? Most likely Ackerman, Maloney or Crowley, based on previous talk.
From a map drawing aesthetics perspective, it should be Engel in NY-17. His district is the ugliest (other than Velasquez' NY-12, which won't be axed due to racial reasons). There's no reason at all why the Bronx should share a district with Rockland County.
Obviously, the other dead district is going to have to come from Upstate. NY-23 is probably most vulnerable to being carved up due to likely population loss and the sheer size of it.
Title: Re: Official US 2010 Census Results
Post by: Beefalow and the Consumer on December 21, 2010, 01:55:27 PM
Long time no see Beef :)
Yo, yo, still keepin' it real in tha hoosier state.
Title: Re: Official US 2010 Census Results
Post by: J. J. on December 21, 2010, 09:53:18 PM
It looks like a net six vote loss to Obama in the Electoral College over 2008.
Title: Re: Official US 2010 Census Results
Post by: nclib on December 21, 2010, 11:01:06 PM
It looks like a net six vote loss to Obama in the Electoral College over 2008.
Yes. Also true with a tied popular vote.
Title: Re: Official US 2010 Census Results
Post by: muon2 on December 21, 2010, 11:58:15 PM
LAST TEN SEATS:
Seat #426: Texas 35 (+3) Priority: 728,933
Seat #427: Pennsylvania 18 (-1) Priority: 726,147
Seat #428: California 52 (-1) Priority: 723,412
Seat #429: Georgia 14 (+1) Priority: 718,097
Seat #430: South Carolina 7 (+1) Priority: 713,709
Seat #431: California 53 (nc) Priority: 709,631
Seat #432: Florida 27 (+2) Priority: 709,610
Seat #433: Washington 10 (+1) Priority: 708,829
Seat #434: Minnesota 8 (nc) Priority: 708,767
Seat #435: Texas 36 (+4) Priority: 708,396
NEXT TEN SEATS
Seat #436: North Carolina 14 (+1) Priority: 706,817
Seat #437: Missouri 9 (nc) Priority: 705,802
Seat #438: New York 28 (-1) Priority: 704,775
Seat #439: New Jersey 13 (nc) Priority: 703,915
Seat #440: Montana 2 (+1) Priority: 699,622
Seat #441: Louisiana 7 (nc) Priority: 699,514
Seat #442: Ohio 17 (-1) Priority: 699,503
Seat #443: Oregon 6 (+1) Priority: 699,455
Seat #444: Virginia 12 (+1) Priority: 696,400
Seat #445: California 54 (+1) Priority: 696,366
Seat #426: Texas 35 (+3) Priority: 728,933
Seat #427: Pennsylvania 18 (-1) Priority: 726,147
Seat #428: California 52 (-1) Priority: 723,412
Seat #429: Georgia 14 (+1) Priority: 718,097
Seat #430: South Carolina 7 (+1) Priority: 713,709
Seat #431: California 53 (nc) Priority: 709,631
Seat #432: Florida 27 (+2) Priority: 709,610
Seat #433: Washington 10 (+1) Priority: 708,829
Seat #434: Minnesota 8 (nc) Priority: 708,767
Seat #435: Texas 36 (+4) Priority: 708,396
NEXT TEN SEATS
Seat #436: North Carolina 14 (+1) Priority: 706,817
Seat #437: Missouri 9 (nc) Priority: 705,802
Seat #438: New York 28 (-1) Priority: 704,775
Seat #439: New Jersey 13 (nc) Priority: 703,915
Seat #440: Montana 2 (+1) Priority: 699,622
Seat #441: Louisiana 7 (nc) Priority: 699,514
Seat #442: Ohio 17 (-1) Priority: 699,503
Seat #443: Oregon 6 (+1) Priority: 699,455
Seat #444: Virginia 12 (+1) Priority: 696,400
Seat #445: California 54 (+1) Priority: 696,366
I had a slightly difference sequence from you. Did you use resident or apportionment population? Apportionment population is larger and includes overseas military and government personnel.
#431 FL 27 (713.4 K)
#432 WA 10 (711.9 K)
#433 TX 36 (711.9 K)
#434 CA 53 (711.3 K)
#435 MN 8 (710.2)
#436 NC 14 (709.1 K)
#437 MO 9 (708.5 K)
#438 NY 28 (706.3 K)
#439 NJ 13 (705.2 K)
#440 MT 2 (703.2 K)
Title: Re: Official US 2010 Census Results
Post by: Tender Branson on December 22, 2010, 02:31:06 AM
Just saw the results, but don't have a lot of time for analysis because I´m off to work:
()
The green states had larger numerical gains this decade than in the 90s.
Obama loses a net 6 EV in 2012.
I´m really surprised that the overall figure is not higher, maybe the 2000 Census was a slight overcount.
It also looks like states who had high (or higher compared with 2000) mail-in participation have better growth than other states (see North Carolina or Texas).
More later.
Title: Re: Official US 2010 Census Results
Post by: minionofmidas on December 22, 2010, 05:38:46 AM
Seat #440: Montana 2 (+1) Priority: 699,622
Title: Re: Official US 2010 Census Results
Post by: minionofmidas on December 22, 2010, 05:47:47 AM
Bizarre fun fact:
In 2000, Gore states lost eight seats, gained one; Bush states lost four seats, gained nine; contested Florida gained two seats.
(CT, 2 NY, 2 PA, IL, MI, WI; CA vs OH, IN, MS, OK; NC, 2 GA, 2 TX, CO, 2 AZ, NV)
In 2010, Gore states lost eight seats, gained one; Bush states lost four seats, gained nine; contested Florida gained two seats.
(MA, 2 NY, NJ, PA, IL, MI, IA; WA vs 2 OH, MO, LA; SC, GA, 4 TX, AZ, UT, NV)
Title: Re: Official US 2010 Census Results
Post by: Antonio the Sixth on December 22, 2010, 06:30:08 AM
Bizarre fun fact:
In 2000, Gore states lost eight seats, gained one; Bush states lost four seats, gained nine; contested Florida gained two seats.
(CT, 2 NY, 2 PA, IL, MI, WI; CA vs OH, IN, MS, OK; NC, 2 GA, 2 TX, CO, 2 AZ, NV)
In 2010, Gore states lost eight seats, gained one; Bush states lost four seats, gained nine; contested Florida gained two seats.
(MA, 2 NY, NJ, PA, IL, MI, IA; WA vs 2 OH, MO, LA; SC, GA, 4 TX, AZ, UT, NV)
In 2000, Gore states lost eight seats, gained one; Bush states lost four seats, gained nine; contested Florida gained two seats.
(CT, 2 NY, 2 PA, IL, MI, WI; CA vs OH, IN, MS, OK; NC, 2 GA, 2 TX, CO, 2 AZ, NV)
In 2010, Gore states lost eight seats, gained one; Bush states lost four seats, gained nine; contested Florida gained two seats.
(MA, 2 NY, NJ, PA, IL, MI, IA; WA vs 2 OH, MO, LA; SC, GA, 4 TX, AZ, UT, NV)
LOL indeed. ;D
Title: Re: Official US 2010 Census Results
Post by: minionofmidas on December 22, 2010, 06:43:06 AM
For the first time since just about ever, the west was not the fastest-growing region in the US, being overtaken by the south.
Also for the first time since just about ever (if not literally for the first time ever?), the smallest state in the union, which is still Wyoming, won't be the smallest congressional district, as it now has more than half the population of the smallest multi-member state (Rhode Island). It's three EV's are still the cheapest though, of course.
Also for the first time since just about ever (if not literally for the first time ever?), the smallest state in the union, which is still Wyoming, won't be the smallest congressional district, as it now has more than half the population of the smallest multi-member state (Rhode Island). It's three EV's are still the cheapest though, of course.
Title: Re: Official US 2010 Census Results
Post by: Devilman88 on December 22, 2010, 08:04:05 PM
What would the 2020 gains and loses look like if the 00-10 growth numbers are the same for 10-20?
Title: Re: Official US 2010 Census Results
Post by: nclib on December 22, 2010, 08:50:48 PM
Just saw the results, but don't have a lot of time for analysis because I´m off to work:
()
The green states had larger numerical gains this decade than in the 90s.
Obama loses a net 6 EV in 2012.
I´m really surprised that the overall figure is not higher, maybe the 2000 Census was a slight overcount.
It also looks like states who had high (or higher compared with 2000) mail-in participation have better growth than other states (see North Carolina or Texas).
More later.
()
The green states had larger numerical gains this decade than in the 90s.
Obama loses a net 6 EV in 2012.
I´m really surprised that the overall figure is not higher, maybe the 2000 Census was a slight overcount.
It also looks like states who had high (or higher compared with 2000) mail-in participation have better growth than other states (see North Carolina or Texas).
More later.
Somewhat of a regional pattern to the states with higher growth in the 2000s than in the 1990s, in fact 5 consecutive states from SC, NC, VA, WV, and PA. Not sure if this is coinidence or not.
Can anyone make a % gain map?
Title: Re: Official US 2010 Census Results
Post by: Sounder on December 22, 2010, 09:41:23 PM
Strong showing by the income tax free states.
Title: Re: Official US 2010 Census Results
Post by: Lunar on December 23, 2010, 03:37:35 AM
Strong showing by the income tax free states.
Difficult to declare whether it is a symptom or a cause though.
Title: Re: Post OFFICIAL 2010 US Census data here
Post by: minionofmidas on December 23, 2010, 08:23:25 AM
Comparing these estimates
to the census results... + means the census found more people. Rounding error possible (I rounded both rows before comparing). Sorted into four groups - major errors and minor errors (defined as over app. 1%) in either direction. Sorted geographically within groups.
Connecticut +44k
North Dakota +22k
Nebraska +18k
West Virginia +30k
Alabama +48k
Wyoming +11k
New Mexico +32k
Nevada +37k
Hawaii +59k
Maine +11k
Vermont +4k
New Jersey +51k
Pennsylvania +68k
Indiana +35k
Wisconsin +12k
Minnesota +11k
Iowa +28k
Kansas +18k
Delaware +6k
Maryland +44k
Virginia +53k
North Carolina +54k
South Carolina +20k
Florida +177k
Kentucky +5k
Tennessee +8k
Mississippi +6k
Arkansas +10k
Louisiana +11k
Oklahoma +32k
Texas +5k
Montana +9k
Idaho +8k
California +6k
Alaska +4k
Rhode Island nailed
New Hampshire -11k
Ohio -17k
Michigan -61k
Missouri -22k
South Dakota -4k
District of Columbia -5k
Washington -13k
Oregon -27k
Massachusetts -83k
New York -219k
Illinois -130k
Georgia -240k
Colorado -63k
Arizona -276k
Utah -63k
though listing Florida's almost 1% underestimate in the same category as the really, really remarkably accurate Texan and Californian estimates feels wrong. There's little rhyme or reason to the list, except for the whopping overestimates. These all come either from stagnant or high growth states, while the solid healthy middling growth type of state was fairly likely to be underestimated.
There are, of course, similarly patterned states without similar problems (cough Texas). Estimates are based on state-provided input, and I suppose the list is mostly an argument for inaccuracy of record-keeping in these states rather than census error.
Here are the calculated April 1, 2010 benchmark numbers for comparison purposes
to the census results... + means the census found more people. Rounding error possible (I rounded both rows before comparing). Sorted into four groups - major errors and minor errors (defined as over app. 1%) in either direction. Sorted geographically within groups.
Connecticut +44k
North Dakota +22k
Nebraska +18k
West Virginia +30k
Alabama +48k
Wyoming +11k
New Mexico +32k
Nevada +37k
Hawaii +59k
Maine +11k
Vermont +4k
New Jersey +51k
Pennsylvania +68k
Indiana +35k
Wisconsin +12k
Minnesota +11k
Iowa +28k
Kansas +18k
Delaware +6k
Maryland +44k
Virginia +53k
North Carolina +54k
South Carolina +20k
Florida +177k
Kentucky +5k
Tennessee +8k
Mississippi +6k
Arkansas +10k
Louisiana +11k
Oklahoma +32k
Texas +5k
Montana +9k
Idaho +8k
California +6k
Alaska +4k
Rhode Island nailed
New Hampshire -11k
Ohio -17k
Michigan -61k
Missouri -22k
South Dakota -4k
District of Columbia -5k
Washington -13k
Oregon -27k
Massachusetts -83k
New York -219k
Illinois -130k
Georgia -240k
Colorado -63k
Arizona -276k
Utah -63k
though listing Florida's almost 1% underestimate in the same category as the really, really remarkably accurate Texan and Californian estimates feels wrong. There's little rhyme or reason to the list, except for the whopping overestimates. These all come either from stagnant or high growth states, while the solid healthy middling growth type of state was fairly likely to be underestimated.
There are, of course, similarly patterned states without similar problems (cough Texas). Estimates are based on state-provided input, and I suppose the list is mostly an argument for inaccuracy of record-keeping in these states rather than census error.
Title: Re: Official US 2010 Census Results
Post by: jimrtex on December 23, 2010, 10:47:27 AM
I had a slightly difference sequence from you. Did you use resident or apportionment population? Apportionment population is larger and includes overseas military and government personnel.
#434 CA 53 (711.3 K)
#435 MN 8 (710.2)
#436 NC 14 (709.1 K)
#434 CA 53 (711.3 K)
#435 MN 8 (710.2)
#436 NC 14 (709.1 K)
This is extremely disappointing. We had the possibility of California increasing its population share while losing representational share, and the snuck through in 434th again.
Title: Re: Official US 2010 Census Results
Post by: Antonio the Sixth on December 23, 2010, 11:03:40 AM
Lucky Minnestota ! :P
Title: Re: Official US 2010 Census Results
Post by: Gustaf on December 23, 2010, 11:11:36 AM
So, the Kerry states+Ohio can no longer win for the Democrats.
Title: Re: Official US 2010 Census Results
Post by: opebo on December 23, 2010, 12:05:30 PM
So, the Kerry states+Ohio can no longer win for the Democrats.
True, but that's hardly such a significant combination given that Iowa, New Mexico, Nevada, and Colorado are all equally or more likely to go Democrat than Ohio nowadays (maybe even Virginia could join that list...).
Title: Re: Official US 2010 Census Results
Post by: GMantis on December 23, 2010, 12:34:03 PM
This is the lowest 10-year growth of the US population since the 1930-1940 period and this was with a depression and much lower immigration than now.
It's also the lowest population growth of California, ever.
It's also the lowest population growth of California, ever.
Title: Re: Official US 2010 Census Results
Post by: opebo on December 23, 2010, 12:44:25 PM
So, the Kerry states+Ohio can no longer win for the Democrats.
True, but that's hardly such a significant combination given that Iowa, New Mexico, Nevada, and Colorado are all equally or more likely to go Democrat than Ohio nowadays (maybe even Virginia could join that list...).
For example here's the 2008 map with a 3% swing from Democrat to Republican, with the new apportionment:
(
Obama still wins, though frightfully narrowly, but without Ohio.
Title: Re: Official US 2010 Census Results
Post by: Antonio the Sixth on December 23, 2010, 01:12:55 PM
Actually, he wins even without Virginia.
Title: Re: Official US 2010 Census Results
Post by: Sbane on December 23, 2010, 01:48:49 PM
So, the Kerry states+Ohio can no longer win for the Democrats.
Virginia and Colorado are more relevant as true swing states these days, while Ohio seems to have drifted right. Also New Mexico is lean Dem even with a tied pv in 2012.
Title: Re: Official US 2010 Census Results
Post by: phk on December 23, 2010, 02:29:59 PM
Wonder what the D's and R's bare minimum win is now.
I presume that D's is Kerry + OH + NM/IA.
R's not so sure.
I presume that D's is Kerry + OH + NM/IA.
R's not so sure.
Title: Re: Official US 2010 Census Results
Post by: Tender Branson on December 23, 2010, 02:30:10 PM
Can anyone make a % gain map?
Here are the maps:
()
()
()
Title: Re: Official US 2010 Census Results
Post by: Tender Branson on December 23, 2010, 02:56:11 PM
I just found out that the US population actually grew by 500.000 more than what was said in the official release.
Why ?
U.S. military and federal civilian employees and their dependents living with them overseas.
This number was much smaller in 2000 than it was in 2010, because the US was not engaged in 2 wars in 2000 like it is now.
Just take a look at this table here, which gives apportionment data for 2010 and 2000:
http://2010.census.gov/news/xls/apport2010_table1.xls
Apportionment population for 2010 was: 309.183.463
Then you have to add D.C. for a total population of 309.785.186
As you can see, in 2010 there were about 1.040.000 Americans overseas in the military.
For 2000, the number was just 574.000 (Apportionment population: 281.424.177+DC, for a total population of 281.996.236)
This means that roughly 500.000 Americans who were counted in the 2000 Census as "residents" where not counted this year because they have migrated overseas for military service.
Title: Re: Post OFFICIAL 2010 US Census data here
Post by: dpmapper on December 23, 2010, 03:04:03 PM
Losers in 2020:
AL, IL, MI, MN, NY, OH, PA,
Possible:
NE, NJ, PA(2), RI, WV, WI
The small losers would be ranked WV, RI, NE in terms of likelihood of losing seats.
Gainers in 2020:
AZ, CO, FL, GA, NC, OR, TX(3)
Possible:
ID, UT, VA
It could end up based on whether ID surpasses NE in population (this is a necessary condition for ID to gain a seat, and NE to lose a seat, but it is not a sufficient condition).
Assuming growth rates are the same in the next 10 years as they were in the last 10 (big assumption, of course) I calculate:
Gains, in order of priority: NC, AZ, FL, NV, GA, TX (+3), VA, CO.
possible gains: OR, NC+2, FL +2, ID, MT.
Losses, in order of certainty: MI, PA, IL, RI, OH, MN, WV, NY (-2), CA.
possible losses: MI (-2), AL, NE, MA, PA(-2).
Title: Re: Official US 2010 Census Results
Post by: Tender Branson on December 23, 2010, 03:24:54 PM
I just found out that the US population actually grew by 500.000 more than what was said in the official release.
Why ?
U.S. military and federal civilian employees and their dependents living with them overseas.
This number was much smaller in 2000 than it was in 2010, because the US was not engaged in 2 wars in 2000 like it is now.
Just take a look at this table here, which gives apportionment data for 2010 and 2000:
http://2010.census.gov/news/xls/apport2010_table1.xls
Apportionment population for 2010 was: 309.183.463
Then you have to add D.C. for a total population of 309.785.186
As you can see, in 2010 there were about 1.040.000 Americans overseas in the military.
For 2000, the number was just 574.000 (Apportionment population: 281.424.177+DC, for a total population of 281.996.236)
This means that roughly 500.000 Americans who were counted in the 2000 Census as "residents" where not counted this year because they have migrated overseas for military service.
Why ?
U.S. military and federal civilian employees and their dependents living with them overseas.
This number was much smaller in 2000 than it was in 2010, because the US was not engaged in 2 wars in 2000 like it is now.
Just take a look at this table here, which gives apportionment data for 2010 and 2000:
http://2010.census.gov/news/xls/apport2010_table1.xls
Apportionment population for 2010 was: 309.183.463
Then you have to add D.C. for a total population of 309.785.186
As you can see, in 2010 there were about 1.040.000 Americans overseas in the military.
For 2000, the number was just 574.000 (Apportionment population: 281.424.177+DC, for a total population of 281.996.236)
This means that roughly 500.000 Americans who were counted in the 2000 Census as "residents" where not counted this year because they have migrated overseas for military service.
The apportionment population does not include any of D.C.'s data it seems, that's why I have to add the overseas population of D.C. to and then it sums up really well:
2010 Resident Population (incl. DC): 308.745.538
2010 Overseas Population (incl. DC): 1.042.523
2010 Total Population: 309.788.061
2010 Overseas population by state: http://2010.census.gov/news/pdf/apport2010_table3.pdf
2000 Resident Population (incl. DC): 281.421.906
2000 Overseas Population (incl. DC): 576.367
2000 Total Population: 281.998.273
2000 Overseas population by state: http://www.census.gov/population/cen2000/tab03.pdf
...
Conclusion: A total of 466.156 people were counted in the 2000 Census that have not been counted this year because they went overseas for the Military.
Also: Texas has overtaken California as the state with most people overseas in the military.
Title: Re: Official US 2010 Census Results
Post by: jimrtex on December 23, 2010, 03:27:36 PM
Also for the first time since just about ever (if not literally for the first time ever?), the smallest state in the union, which is still Wyoming, won't be the smallest congressional district, as it now has more than half the population of the smallest multi-member state (Rhode Island). It's three EV's are still the cheapest though, of course.
You may recall that the USA used D'Hondt apportionment under the original Jefferson-manders, which meant that the smallest states tended to have the largest population per representative.
There were a few instances where a new state had the least population based on the previous census, but by the time of their accession they most likely would not have been the least populous state, and generally by their first census after statehood, they would have among the largest population/representative prior to the apportionment based on that senate,
It appears that the first post-census apportionment where a state had the smallest population per representative was 1860 when Oregon had been a state for one year.
1860: Oregon 52K vs Minnesota 86K/2
Nevada which was admitted in 1864 after the Comstock Lode soon dropped in population. With it's extraordinary low population it assured that it would also have the least population/representative. In one census it had 1/7 of the population of the largest state with a single representative.
1870: Nevada 42K, Oregon 90K vs Florida 93K/2
1880: Nevada 62K vs Florida 135K/2
In the 1872 reapportionment bill, there was a section specifying that no new state could be admitted with less population than the average population per representative. This was ignored when Congress decided to add the 3 mountains states when Dakota and Washington became states. Dakota was split in part for the same reason which was to bring in 6 Republican states.
1890: Nevada 47K, Wyoming 62K, Idaho 88K, Montana 142K vs. Oregon 158K/2
Wyoming joined Nevada as a lagging state.
1900: Nevada 42K, Wyoming 92K vs North Dakota 160K/2
1910: Nevada 81K, Wyoming 145K vs Idaho 163K/2
1920: Nevada 77K vs Vermont 176K/2 (1910 apportionment, 1920 population)
1930: Nevada 91K vs Idaho 222K/2
1940: Nevada 110K vs New Hampshire 246K/2
Completion of Boulder Dam during WWII, growth of California and interstate highway system, air conditioning and jet travel sparked growth of Las Vegas which finally meant that Nevada would no long be a laggard. But noticed that in almost trebling in population between 1940 and 1960 it was still extremely underpopulated.
1950: Nevada 160K vs. New Hampshire 267K/2
Alaska accedes to Union to provide new ultra-small state.
1960: Alaska 226K, Nevada 285K vs New Hampshire 303K/2
Had North Dakota not dropped to 1 representative in 1970, Wyoming would have had more population per representative than North Dakota.
1970: Alaska 302K, Wyoming 332K vs South Dakota 333K/2
Healthy growth in Alaska and energy boom in Wyoming, mean that Montana has the fewest persons per representative as it slides towards loss of its 2nd representative.
1980: Alaska 402K, Wyoming 470K vs. Montana 393K/2
Slippage in Wyoming and loss of 2nd representative mean that Wyoming for the first time ever has the least population per representative.
1990: Wyoming 453K vs. Rhode Island 500K/2
2000: Wyoming 494K vs. Rhode Island 524K/2
Strong growth and stagnation in Rhode Island result in Wyoming no longer having the least population per representative.
2010: Wyoming 568K vs. Rhode Island 528K/2
In 1960 there were 10 states with 2 representatives. Nevada and Utah have grown at a healthy rate, and will in 2020 or 2030 be joined by Idaho. 3 have lost their 2nd represantive, North Dakota, South Dakota, and Montana, and Rhode Island may join them in 2020. This would leave only 3, 2-representative states, Maine, New Hampshire, and Hawaii, at least until Nebraska and West Virginia. The last state to lose its 3rd representative was Maine in 1960.
If Rhode Island were to lose its 2nd seat in 2020, then Wyoming might once again become the smallest congressional district; since the gap to the next smallest 2-representative states, of New Hampshire and Maine is about 25%.
In fact a very notable anomaly is that Nebraska and West Virginia now have the smallest districts other than Rhode Island and Wyoming. It is quite possible that in 2020 one of these two will have the smallest congressional districts.
Title: Re: Official US 2010 Census Results
Post by: Skill and Chance on December 23, 2010, 05:13:56 PM
Wonder what the D's and R's bare minimum win is now.
I presume that D's is Kerry + OH + NM/IA.
R's not so sure.
I presume that D's is Kerry + OH + NM/IA.
R's not so sure.
Numerically, you're correct on Kerry +OH+IA and Kerry IA+VA+NM works for exactly 270 for the D's. Kerry +OH+NM is a tie. Getting exactly 270 for the R's is more challenging and most plausible scenario I found was Bush 2004 +PA-FL-VA
The closest possible wins going off of 2008 margins are Kerry +NV+CO+IA+NM for a 272-266 D win and flip CO for a 275-263 R win with Bush 2004 -NM-NV-IA.
Does the lame duck House or the new House elect the new president if there is an EC tie?
Title: Re: Official US 2010 Census Results
Post by: Sounder on December 23, 2010, 06:03:20 PM
Strong showing by the income tax free states.
Difficult to declare whether it is a symptom or a cause though.
The slowest growing income tax free states were the fastest growing states in their respective regions. Slow growth states should consider dumping the income tax to attract growth and investment.
Title: Re: Official US 2010 Census Results
Post by: Brittain33 on December 23, 2010, 07:33:12 PM
Strong showing by the income tax free states.
Difficult to declare whether it is a symptom or a cause though.
The slowest growing income tax free states were the fastest growing states in their respective regions. Slow growth states should consider dumping the income tax to attract growth and investment.
Massachusetts's economy is among the strongest in the country. We just don't have the land, or the willingness to build with density on that land, to accommodate population growth.
Title: Re: Official US 2010 Census Results
Post by: Torie on December 23, 2010, 08:41:34 PM
Strong showing by the income tax free states.
Difficult to declare whether it is a symptom or a cause though.
The slowest growing income tax free states were the fastest growing states in their respective regions. Slow growth states should consider dumping the income tax to attract growth and investment.
Massachusetts's economy is among the strongest in the country. We just don't have the land, or the willingness to build with density on that land, to accommodate population growth.
Yes, in that sense Mass was "smart." It has effectively forced out of the state the bulk of its working class, and become a rather upscale state in its Social Economic Status (SES).
Moreover, the state had, and may still have for all I know, high quality secondary educational institutions (particularly the Catholic schools), not to mention its host of splendid higher educational ones, so it was able to effect a substantial amount of upward mobility of its population, putting on steroids as it were the desire (attended by hard work and discipline, without which desire is a fantasy novel) of so many of those "ethnics" up there "better" themselves, and certainly their kids, in any event. Congrats to all.
Title: Re: Official US 2010 Census Results
Post by: jimrtex on December 24, 2010, 01:14:56 AM
A couple of interesting tidbits:
Maine remained ahead of New Hampshire in population, though estimates had shown it slipping behind.
Puerto Rico lost population? Young people moving to the mainland?
Maine remained ahead of New Hampshire in population, though estimates had shown it slipping behind.
Puerto Rico lost population? Young people moving to the mainland?
Title: Re: Official US 2010 Census Results
Post by: Tender Branson on December 24, 2010, 02:27:15 AM
Here´s a chart I made of the overseas military population and their family members in the 2000 and 2010 Census and percentage growth:
()
()
Title: Re: Official US 2010 Census Results
Post by: Smash255 on December 24, 2010, 04:17:46 AM
Wonder what the D's and R's bare minimum win is now.
I presume that D's is Kerry + OH + NM/IA.
R's not so sure.
I presume that D's is Kerry + OH + NM/IA.
R's not so sure.
Using 04 as your base its a gain of 6 seats for the ones Bush won, loss of 6 for Kerry so its 292-246 instead of 286-252.
R's is Bush 04 - CO,- NV - IA - NM + NH, which would give them 270 (
Bush 04 - CO - IA - NV, would be 271
Bush 04- CO - NM -IA/NV would be 272
Dems would be Kerry + OH, + NV/IA which would be 270 (NM instead of NV or IA would be 269 but with NE-02 added you would have 270
Kerry 04 + NC + CO would also be 270
Kerry 04 + VA +NM +IA/NV also 270
Kerry 04 + VA + IA + NV would be 271
Kerry 04 + FL would be 273
Title: Re: Official US 2010 Census Results
Post by: minionofmidas on December 24, 2010, 05:45:43 AM
I just found out that the US population actually grew by 500.000 more than what was said in the official release.
Why ?
U.S. military and federal civilian employees and their dependents living with them overseas.
This number was much smaller in 2000 than it was in 2010, because the US was not engaged in 2 wars in 2000 like it is now.
Just take a look at this table here, which gives apportionment data for 2010 and 2000:
http://2010.census.gov/news/xls/apport2010_table1.xls
Apportionment population for 2010 was: 309.183.463
Then you have to add D.C. for a total population of 309.785.186
As you can see, in 2010 there were about 1.040.000 Americans overseas in the military.
For 2000, the number was just 574.000 (Apportionment population: 281.424.177+DC, for a total population of 281.996.236)
This means that roughly 500.000 Americans who were counted in the 2000 Census as "residents" where not counted this year because they have migrated overseas for military service.
Why ?
U.S. military and federal civilian employees and their dependents living with them overseas.
This number was much smaller in 2000 than it was in 2010, because the US was not engaged in 2 wars in 2000 like it is now.
Just take a look at this table here, which gives apportionment data for 2010 and 2000:
http://2010.census.gov/news/xls/apport2010_table1.xls
Apportionment population for 2010 was: 309.183.463
Then you have to add D.C. for a total population of 309.785.186
As you can see, in 2010 there were about 1.040.000 Americans overseas in the military.
For 2000, the number was just 574.000 (Apportionment population: 281.424.177+DC, for a total population of 281.996.236)
This means that roughly 500.000 Americans who were counted in the 2000 Census as "residents" where not counted this year because they have migrated overseas for military service.
Jim - yeah, I was thinking of "since 1870 on account of Nevada, if not before". So apparently 1980 wrecks my claim. :(
Title: Re: Official US 2010 Census Results
Post by: Antonio the Sixth on December 24, 2010, 07:46:15 PM
Where can I find a document with the official population numbers ? I didn't find it on the census website.
Title: Re: Official US 2010 Census Results
Post by: danny on December 25, 2010, 01:49:55 AM
Where can I find a document with the official population numbers ? I didn't find it on the census website.
On this page:
http://2010.census.gov/news/press-kits/apportionment/apport.html (http://2010.census.gov/news/press-kits/apportionment/apport.html)
Title: Re: Official US 2010 Census Results
Post by: Kevinstat on December 25, 2010, 02:27:59 AM
I'm not sure if anyone here has pointed it out yet, but if the major fractions method (which was used after the 1910 and 1930 censuses) was still used today, Rhode Island would lose it's second U.S. House seat and North Carolina would gain a 14th U.S. House seat.
Title: Re: Official US 2010 Census Results
Post by: jimrtex on December 25, 2010, 03:51:34 PM
I'm not sure if anyone here has pointed it out yet, but if the major fractions method (which was used after the 1910 and 1930 censuses) was still used today, Rhode Island would lose it's second U.S. House seat and North Carolina would gain a 14th U.S. House seat.
So if the decision were being made now, would the vote be for North Carolina a swing state in presidential elections, and where there is a reasonable chance of a Republican seat being drawn to avoid pushing a marginals into the Republican column, or for Rhode Island which is a certain Democratic presidential vote and representatives?
Would Speaker Pelosi tried to ram the bill through in the lame duck session? Or would there be an effort to include representation for DC and RI (this assumes that Rhode Island is 436 in priority) while switching to major fractions.
Title: Re: Official US 2010 Census Results
Post by: minionofmidas on December 25, 2010, 04:37:28 PM
Hmm? What is the major fractions method? I did a few calculations this morning, actually, though with rounded figures because I didn't have access to the internet, and I got Hare-Niemeyer and the US method agreeing this year. Sainte-Lague shifts two seats to larger states; I forget which but Rhode Island wasn't one IIRC. I also did D'Hondt (single seat not just for RI but for ME and NH as well... HI narrowly double-member. About ten or so seat transfers. Oh, and you have to amend it to include an exception so every state gets at least one seat), and the method used by Turkey (one seat per state automatic, remaining seats distributed by D'Hondt with that one seat not taken into account, which in Turkey has the nice effect of making every province/constitutency at least double-member. Similar number of seat transfers but in the other direction this time. SD the smallest double-member state).
Title: Re: Official US 2010 Census Results
Post by: Antonio the Sixth on December 25, 2010, 04:59:45 PM
Hmm? What is the major fractions method?
Major franctions is the same as Sainte-Lagüe.
Title: Re: Official US 2010 Census Results
Post by: jimrtex on December 25, 2010, 06:52:20 PM
Hmm? What is the major fractions method? I did a few calculations this morning, actually, though with rounded figures because I didn't have access to the internet, and I got Hare-Niemeyer and the US method agreeing this year. Sainte-Lague shifts two seats to larger states; I forget which but Rhode Island wasn't one IIRC. I also did D'Hondt (single seat not just for RI but for ME and NH as well... HI narrowly double-member. About ten or so seat transfers. Oh, and you have to amend it to include an exception so every state gets at least one seat), and the method used by Turkey (one seat per state automatic, remaining seats distributed by D'Hondt with that one seat not taken into account, which in Turkey has the nice effect of making every province/constitutency at least double-member. Similar number of seat transfers but in the other direction this time. SD the smallest double-member state).
Jefferson's method
+ CA(2), IL, NJ, NY, NC, OH, TX
- ME, MN, NE, NH, RI, SC, WA, WV
Adams' method
+ DE, ID, IA, LA, MO, MT, OK, OR, SD
- CA(3), FL, GA, NY, PA, TX(2)
Webster's method
+ NC
- RI
Dean's method
+ MT
- CA
Title: Re: Official US 2010 Census Results
Post by: Kevinstat on December 25, 2010, 09:45:50 PM
Hmm? What is the major fractions method? I did a few calculations this morning, actually, though with rounded figures because I didn't have access to the internet, and I got Hare-Niemeyer and the US method agreeing this year. Sainte-Lague shifts two seats to larger states; I forget which but Rhode Island wasn't one IIRC. I also did D'Hondt (single seat not just for RI but for ME and NH as well... HI narrowly double-member. About ten or so seat transfers. Oh, and you have to amend it to include an exception so every state gets at least one seat), and the method used by Turkey (one seat per state automatic, remaining seats distributed by D'Hondt with that one seat not taken into account, which in Turkey has the nice effect of making every province/constitutency at least double-member. Similar number of seat transfers but in the other direction this time. SD the smallest double-member state).
Jefferson's method
+ CA(2), IL, NJ, NY, NC, OH, TX
- ME, MN, NE, NH, RI, SC, WA, WV
Adams' method
+ DE, ID, IA, LA, MO, MT, OK, OR, SD
- CA(3), FL, GA, NY, PA, TX(2)
Webster's method
+ NC
- RI
Dean's method
+ MT
- CA
One to add:
Hamilton's method (a.k.a. largest remainders with the Hare Quota (1 Hare Quota = total votes (or total apportionment population here)/total number of seats) a.k.a. Hare-Niemeyer
No difference (from Huntington-Hill a.k.a. the method of equal proportions)
Jefferson's method is also known as the method of greatest divisiors or (typically as a seat allocation method in proportional representation systems) the d'Hondt method.
Adams' method is also known as the method of smallest divisors.
Webster's method is also known as the method of major fractions or (typically as a seat allocation method in proportional representation systems) the Sainte-Lagüe method.
Dean's method is also known as the method of the harmonic mean.
Title: Re: Official US 2010 Census Results
Post by: jimrtex on December 25, 2010, 10:04:54 PM
This is the 2010 apportionment, based on each state's share of the total population. but assuming that share is the geometric mean of x+1/2 and x-1/2, where x is the actual number of seats that a state is entitled to.
So for example, we divide Alabama's apportionment population of 4,802,982 by 710,767 which is the US apportionment population of 710,767, which gives a quotient of 6.757. IOW, Alabama has 6.757 / 435 of the US population.
6.757 is the geometric mean of x+1/2 and x-1/2 or sqrt( (x+1/2)(x -1/2) ).
Solving for x = sqrt (6.757^2 +1/4) = 6.776 which would be Alabama's apportionment based on its share of the US population.
But if he add all these up, we find that we have apportioned a total of 436.838 seats. So we adjust our original divisor upward to 713,769 which gives us an apportionment of 435.015, with Alabama being apportioned 6.748 seats. Repeat another iteration using a divisor of 713,794, gives a total apportionment of 435.000 seats, and Alabama's apportionment of 6.747.
We could use independent rounding (rounding fractions greater than 1/2 upward) and each state would have it correct apportionment based on its relative share of the US population.
But in the case of 2010, this would leave us 5 seats short, as FL, WA, TX, CA, and MN would lose a seat. The extra 5 seats are apportioned on the basis of the conventional ranking method (not shown here), which illustrates an interesting effect. When there are extra seats to be apportioned, the ranking favors larger states, and disfavors smaller states. The reason is that large states can spread their shortfall among a large number of districts. So in this case California and Texas are favored, even though they are somewhat short of the population needed for 52.5 or 35.5 seats. Montana is close, but if it did receive a 2nd seat they would be quit small.
It is happenstance that extra seats have to apportioned. It could be the other way around and more than 435 seats apportioned based on independent rounding. In that case large states would be disfavored. We could take a district from them and the other districts would have fairly small increases.
In the following table, the first column is the 2010 fractional apportionment. The second column is the change from 2000. We can use this to make a rough projection to 2020 as to which states will gain and lose:
Winners: AZ, CO(?maybe), FL, GA, ID(?), NV(?), OR(?), TX(+3), VA(1)
Losers: CA(?), IL, MI(1, 2?), MN, NE(?), OH, PA, RI, WV(?)
The 3rd column is the 2010 apportionment. The 4th is the 2000-2010 relative increase or decrease in population.
The 5th and 6th column shows either the relative increase and absolute increase (in 1000s) for a state to take Minnesota's 8th representative, or relative decrease and absolute decrease for a state to forfeit a seat to North Carolina (Minnesota received the 435th seat, while North Carolina would have received a 436th were the House expanded).
The previous column can be combined. So for example if Texas had grown at 20.5% rather than 20.9% it would have only gained 3 seats. It also shows that it is now necessary for a state to have more than a million population before it gains a second seat (Montana has 994K and would need to gain 10K).
Alabama 6.747 -0.137 7 7.7% -4.3% -208
Alaska 1.128 0.038 1 14.7% 39.2% 283
Arizona 8.998 1.070 9 24.7% -6.2% -396
Arkansas 4.130 -0.025 4 9.2% 8.5% 250
California 52.317 0.090 53 10.1% -0.3% -118
Colorado 7.085 0.430 7 17.0% 5.4% 270
Connecticut 5.043 -0.229 5 5.0% 8.6% 308
Delaware 1.358 0.050 1 14.8% 11.5% 104
Florida 26.484 1.808 27 17.9% -0.6% -114
Georgia 13.637 0.995 14 18.5% -1.7% -162
Hawaii 1.979 0.041 2 12.3% -26.6% -364
Idaho 2.260 0.202 2 21.3% 10.6% 166
Illinois 18.029 -1.123 18 3.4% 2.1% 270
Indiana 9.122 -0.266 9 6.7% 3.6% 236
Iowa 4.307 -0.233 4 4.2% 4.0% 122
Kansas 4.043 -0.133 4 6.3% 10.9% 312
Kentucky 6.116 -0.137 6 7.4% 5.8% 252
Louisiana 6.399 -0.514 6 1.6% 1.1% 49
Maine 1.933 -0.096 2 4.3% -24.8% -330
Maryland 8.127 -0.058 8 9.1% 4.1% 237
Massachusetts 9.203 -0.592 9 3.2% 2.7% 178
Michigan 13.895 -1.437 14 -0.4% -3.5% -346
Minnesota 7.463 -0.135 8 7.9% -0.2% -9
Mississippi 4.202 -0.217 4 4.4% 6.6% 198
Missouri 8.437 -0.207 8 7.2% 0.2% 15
Montana 1.480 -0.000 1 9.8% 1.0% 10
Nebraska 2.615 -0.073 3 6.8% -5.2% -95
Nevada 3.829 0.707 4 35.3% -9.3% -253
New Hampshire 1.918 -0.053 2 6.7% -24.1% -319
New Jersey 12.349 -0.627 12 4.5% 0.7% 63
New Mexico 2.939 0.088 3 13.3% -16.0% -330
New York 27.213 -2.043 27 2.2% 0.6% 107
North Carolina 13.411 0.983 13 18.6% 0.2% 16
North Dakota 1.071 -0.039 1 5.0% 48.6% 329
Ohio 16.215 -1.300 16 1.7% 1.3% 145
Oklahoma 5.298 -0.049 5 8.8% 3.3% 125
Oregon 5.415 0.114 5 12.3% 1.1% 41
Pennsylvania 17.848 -1.091 18 3.5% -2.6% -331
Rhode Island 1.561 -0.131 2 0.5% -5.0% -52
South Carolina 6.528 0.313 7 15.4% -1.1% -51
South Dakota 1.253 -0.015 1 8.3% 22.5% 185
Tennessee 8.946 0.158 9 11.8% -5.6% -359
Texas 35.404 3.225 36 20.9% -0.4% -99
Utah 3.914 0.435 4 23.9% -11.4% -314
Vermont 1.015 -0.049 1 3.4% 59.3% 374
Virginia 11.272 0.331 11 13.2% 1.5% 122
Washington 9.474 0.366 10 14.3% -0.4% -27
West Virginia 2.653 -0.182 3 2.6% -6.6% -123
Wisconsin 7.999 -0.284 8 6.1% -6.9% -392
Wyoming 0.940 0.028 1 14.7% 76.7% 436
Title: Re: Official US 2010 Census Results
Post by: minionofmidas on December 26, 2010, 05:53:18 AM
Yeah, RI was one of my two Sainte Lague losers after all; I've checked. The other one (Minnesota; though who was the other gainer? New York probably but I'm not sure right now) may be a rounding issue.
The rounding made no difference to the Huntington/Hill method - it so happens that the gap between 435th and 436th was something of a mini natural break this year.
Biggest gap in the 431 to 439 run. (Much larger gaps just beyond, though.)
The rounding made no difference to the Huntington/Hill method - it so happens that the gap between 435th and 436th was something of a mini natural break this year.
Seat #431: California 53 (nc) Priority: 709,631
Seat #432: Florida 27 (+2) Priority: 709,610
Seat #433: Washington 10 (+1) Priority: 708,829
Seat #434: Minnesota 8 (nc) Priority: 708,767
Seat #435: Texas 36 (+4) Priority: 708,396
Seat #436: North Carolina 14 (+1) Priority: 706,817
Seat #437: Missouri 9 (nc) Priority: 705,802
Seat #438: New York 28 (-1) Priority: 704,775
Seat #439: New Jersey 13 (nc) Priority: 703,915
Title: Re: Official US 2010 Census Results
Post by: jimrtex on December 26, 2010, 01:03:07 PM
RI is the only one.
The difference between Webster's method and Huntington-Hill are pretty minor except for the smallest states. The square root of 5 * 6 is 5.47, vs the average of 5 and 6 which is 5.5. But more important is the relative difference between the divisors.
sqrt (9 * 10 ) / sqrt (5 * 6) = 1.732
9.5 / 5.5 = 1.727
The ratio of the two numbers is 1.0027. Which means that the two methods would make a difference in the relative ranking of an Washington-sized state and an Oregon-sized state only if the quotients were within 0.27% of each other. And it would make a different in apportionment if they happened to just be at the cutoff line for the membership of the House.
If we use only the quotients that determine whether a state has N or N+1 seats in a 435-member House, while Rhode Island drops 12 places, the 12 states that followed it for the most part simply move up one position in the ranking.
The exceptions are that AL and MI move up two, but that is because NE, a small state, also drops down a couple of places; and TX and CA, the two largest states, move up two place past WA.
The quotient for the State that receives the Nth representative, should be very close to 1/Nth of the total population (the national average representatives/population). So the expected difference is 1630, vs. the observed difference between NC and MO for Webster's method is slightly closer than expected.
Yeah, RI was one of my two Sainte Lague losers after all; I've checked. The other one (Minnesota; though who was the other gainer? New York probably but I'm not sure right now) may be a rounding issue.
The rounding made no difference to the Huntington/Hill method - it so happens that the gap between 435th and 436th was something of a mini natural break this year.
Biggest gap in the 431 to 439 run. (Much larger gaps just beyond, though.)
The rounding made no difference to the Huntington/Hill method - it so happens that the gap between 435th and 436th was something of a mini natural break this year.
Seat #431: California 53 (nc) Priority: 709,631
Seat #432: Florida 27 (+2) Priority: 709,610
Seat #433: Washington 10 (+1) Priority: 708,829
Seat #434: Minnesota 8 (nc) Priority: 708,767
Seat #435: Texas 36 (+4) Priority: 708,396
Seat #436: North Carolina 14 (+1) Priority: 706,817
Seat #437: Missouri 9 (nc) Priority: 705,802
Seat #438: New York 28 (-1) Priority: 704,775
Seat #439: New Jersey 13 (nc) Priority: 703,915
Seat #432: Florida 27 (+2) Priority: 709,610
Seat #433: Washington 10 (+1) Priority: 708,829
Seat #434: Minnesota 8 (nc) Priority: 708,767
Seat #435: Texas 36 (+4) Priority: 708,396
Seat #436: North Carolina 14 (+1) Priority: 706,817
Seat #437: Missouri 9 (nc) Priority: 705,802
Seat #438: New York 28 (-1) Priority: 704,775
Seat #439: New Jersey 13 (nc) Priority: 703,915
Title: Re: Official US 2010 Census Results
Post by: Antonio the Sixth on December 26, 2010, 02:44:05 PM
Great list Jim. :) Would you like to sort it by the percent change necessary to win/lose a seat, please ?
Title: Re: Post OFFICIAL 2010 US Census data here
Post by: nclib on December 26, 2010, 04:40:54 PM
What information will be released in the 2010 census that was not released in the 2000 census and visa versa?
Anybody know?
Title: Re: Post OFFICIAL 2010 US Census data here
Post by: jimrtex on December 26, 2010, 09:27:23 PM
What information will be released in the 2010 census that was not released in the 2000 census and visa versa?
Anybody know?
Number Persons in Household
Housing: Owned; Mortgaged; Rented; Squatting.
For each person:
Family relationship to person filling out form
Sex
Age
Hispanicity
Race
The information that was formerly collected by the long form, is now collected in the American Community Survey.
Housing: Type (house, apartment, cave, boat, etc.), age, length of tenancy, acreage, farm income, business use, number of rooms, number of bedrooms, running water, flush toilet, bathtub or shower, sink with faucet, stove or range, refrigerator, telephone, number of vehicles, heating fuel, cost of electricity, gas, water&sewer, and other fuel; food stamps, condominium (and fee), rent (and whether board included), value, taxes, insurance, mortgage payments,
Population: Citizenship, and basis thereof; entry into USA, attending school and level, highest level of education completed, ancestry, language spoken at home, residence location 1 year earlier, health insurance, deaf, blind, physical disabilities, marital status, recent motherhood, caring for grandchildren, military service, employment, commuting, laid off, productive or government worker, income, social security.
The long form was distributed to a large sample of households (10% to 20%) and was intended to ask all the annoying questions that would have made census participation plummet if asked of everyone. It was intended to be a large enough sample to provide statistically reliable information for small areas (down to the block group, which has around 1000 persons).
The American Community Survey is administered on an ongoing basis, with a much smaller sample each month, but which when aggregated over 5 years produces a comparable sample size and accuracy to the long form. The Census Bureau earlier this month released the ACS data for 2005 to 2009. The Census Bureau also releases ACS data on 3-year and 1-year basis for larger areas (3-year data is statistically reliable for areas with population greater than 20,000; and the 1-year data for areas with population greater than 65,000).
Because the data is collected on a continuing basis, next year the ACS will be released for 2006 to 2010, with the oldest year of the sample being dropped and a new year added in. So the ACS will be better for trends, while the long form census data, while clearer and more concise because it all is for a single data, won't show changes between decades, and because of unlucky timing might even be misleading (a 2010 long form would show higher levels of unemployment, and more persons in their mid-20s living with their parents).
Title: Re: Official US 2010 Census Results
Post by: Antonio the Sixth on December 29, 2010, 06:37:29 PM
Was the official list of priority values released ?
Title: Re: Official US 2010 Census Results
Post by: cinyc on January 12, 2011, 01:14:37 AM
The Census Director is scheduled to hold a press conference (http://2010.census.gov/news/releases/cb11-cn01.html) at 1PM on Wednesday, January 12 to "brief the media on next 2010 Census data releases, including state redistricting data." Will we get some lower-level data tomorrow afternoon?
Title: Re: Official US 2010 Census Results
Post by: jimrtex on January 12, 2011, 02:58:28 AM
The Census Director is scheduled to hold a press conference (http://2010.census.gov/news/releases/cb11-cn01.html) at 1PM on Wednesday, January 12 to "brief the media on next 2010 Census data releases, including state redistricting data." Will we get some lower-level data tomorrow afternoon?
Title: Re: Official US 2010 Census Results
Post by: minionofmidas on January 12, 2011, 05:29:37 AM
We might get some more info on the exact timeline, though. That would be very welcome.
Title: Re: Official US 2010 Census Results
Post by: jimrtex on January 12, 2011, 02:54:46 PM
We might get some more info on the exact timeline, though. That would be very welcome.
I tuned in to late for the press conference. It says it is being archived. Anyone catch it?
Title: Re: Official US 2010 Census Results
Post by: cinyc on January 12, 2011, 04:50:19 PM
We might get some more info on the exact timeline, though. That would be very welcome.
I tuned in to late for the press conference. It says it is being archived. Anyone catch it?
I didn't catch it, but there doesn't seem to be much of interest in the press kit (http://2010.census.gov/news/press-kits/operational-press-briefing/january-12-2011.html) for the press conference. There's some internal migration data for Texas, California and Michigan - but that may or may not have been previously released.
Title: Re: Official US 2010 Census Results
Post by: Torie on January 13, 2011, 10:19:43 PM
We might get some more info on the exact timeline, though. That would be very welcome.
I tuned in to late for the press conference. It says it is being archived. Anyone catch it?
I didn't catch it, but there doesn't seem to be much of interest in the press kit (http://2010.census.gov/news/press-kits/operational-press-briefing/january-12-2011.html) for the press conference. There's some internal migration data for Texas, California and Michigan - but that may or may not have been previously released.
Yes, in a few places, internal migration could move the numbers by a discernible amount, and I try to factor that in, in my maps, when I am cutting it close to what I think is the point, where the odds of the seat being at risk in a semi wave, start to go up exponentially. I don't draw for a wave quite as strong as 2008. I don't think the odds are high that it will be replicated soon. And even then, the maps I draw should enable competent incumbents to survive. My sense of it is, is that a competent incumbent who is not a partisan attack dog, or becomes demonized by the opposition, can generate about 3 PVI points in his or her favor, over what would otherwise happen; with a superstar, like Gerlach in PA, or Ryan in WI, that is worth perhaps about 5 PVI points, in all cases assuming competent and reasonably funded opposition.
Title: Re: Official US 2010 Census Results
Post by: cinyc on January 14, 2011, 12:03:47 AM
We might get some more info on the exact timeline, though. That would be very welcome.
I tuned in to late for the press conference. It says it is being archived. Anyone catch it?
I didn't catch it, but there doesn't seem to be much of interest in the press kit (http://2010.census.gov/news/press-kits/operational-press-briefing/january-12-2011.html) for the press conference. There's some internal migration data for Texas, California and Michigan - but that may or may not have been previously released.
Yes, in a few places, internal migration could move the numbers by a discernible amount, and I try to factor that in, in my maps, when I am cutting it close to what I think is the point, where the odds of the seat being at risk in a semi wave, start to go up exponentially. I don't draw for a wave quite as strong as 2008. I don't think the odds are high that it will be replicated soon. And even then, the maps I draw should enable competent incumbents to survive. My sense of it is, is that a competent incumbent who is not a partisan attack dog, or becomes demonized by the opposition, can generate about 3 PVI points in his or her favor, over what would otherwise happen; with a superstar, like Gerlach in PA, or Ryan in WI, that is worth perhaps about 5 PVI points, in all cases assuming competent and reasonably funded opposition.
Just to be clear, Torie, by internal migration, I meant raw statistics regarding people already in the US moving in or out of the state. I don't think the analysis was strictly based on Census 2010 data, and like I said, it might have been previously released.
Title: Re: Official US 2010 Census Results
Post by: Torie on January 14, 2011, 12:06:51 AM
Oh sorry, cinyc, I did indeed misunderstand. When I am drawing my maps, I am obsessed with intra county migrations, which can matter a lot in bigger, and politically variegated counties. I don't want my maps to hit the dumpster because I didn't try to anticipate for that.
Title: Re: Official US 2010 Census Results
Post by: cinyc on January 14, 2011, 12:21:52 AM
The press conference transcript is here (http://2010.census.gov/news/pdf/transcript_1-12-11.pdf). There's not much there there. As we knew, the state redistricting data will trickle out by state starting the first week of February. Census will tell us which states will be released next about a week ahead of time - so we'll start knowing by the end of January. The release schedule is sensitive to state redistricting needs - so I'd imagine those with 2011 elections might come first, if they have to redistrict beforehand. State officials will get the data before the rest of us, but we will get it at the same time as the press.
New Tiger shapefiles will be put up on Census' website soon.
There's going to be a webinar on the new American Factfinder on January 18 and on redistricting on January 24.
Yeah, my initial phrasing was misleading. While it certainly wasn't clear from just the handouts, from the transcript, it sounds like the Census Bureau was using Pew and Heritage inter-state migration estimates, among other things, to try to judge the accuracy of the 2010 Census, which was in line with the mid-level population estimates. Obviously, not everyone responds to the census, and in some cases, census workers had to ask proxies like neighbors or building management. It also sounds like the full accuracy analysis won't be ready until 2012. The final accuracy analysis for the 2000 census indicated a slight overcount.
New Tiger shapefiles will be put up on Census' website soon.
There's going to be a webinar on the new American Factfinder on January 18 and on redistricting on January 24.
Oh sorry, cinyc, I did indeed misunderstand. When I am drawing my maps, I am obsessed with intra county migrations, which can matter a lot in bigger, and politically variegated counties. I don't want my maps to hit the dumpster because I didn't try to anticipate for that.
Yeah, my initial phrasing was misleading. While it certainly wasn't clear from just the handouts, from the transcript, it sounds like the Census Bureau was using Pew and Heritage inter-state migration estimates, among other things, to try to judge the accuracy of the 2010 Census, which was in line with the mid-level population estimates. Obviously, not everyone responds to the census, and in some cases, census workers had to ask proxies like neighbors or building management. It also sounds like the full accuracy analysis won't be ready until 2012. The final accuracy analysis for the 2000 census indicated a slight overcount.
Title: Re: Official US 2010 Census Results
Post by: jimrtex on January 14, 2011, 02:25:48 AM
The press conference transcript is here (http://2010.census.gov/news/pdf/transcript_1-12-11.pdf). There's not much there there. As we knew, the state redistricting data will trickle out by state starting the first week of February. Census will tell us which states will be released next about a week ahead of time - so we'll start knowing by the end of January. The release schedule is sensitive to state redistricting needs - so I'd imagine those with 2011 elections might come first, if they have to redistrict beforehand. State officials will get the data before the rest of us, but we will get it at the same time as the press.
New Tiger shapefiles will be put up on Census' website soon.
There's going to be a webinar on the new American Factfinder on January 18 and on redistricting on January 24.
Yeah, my initial phrasing was misleading. While it certainly wasn't clear from just the handouts, from the transcript, it sounds like the Census Bureau was using Pew and Heritage inter-state migration estimates, among other things, to try to judge the accuracy of the 2010 Census, which was in line with the mid-level population estimates. Obviously, not everyone responds to the census, and in some cases, census workers had to ask proxies like neighbors or building management. It also sounds like the full accuracy analysis won't be ready until 2012. The final accuracy analysis for the 2000 census indicated a slight overcount.
New Tiger shapefiles will be put up on Census' website soon.
There's going to be a webinar on the new American Factfinder on January 18 and on redistricting on January 24.
Oh sorry, cinyc, I did indeed misunderstand. When I am drawing my maps, I am obsessed with intra county migrations, which can matter a lot in bigger, and politically variegated counties. I don't want my maps to hit the dumpster because I didn't try to anticipate for that.
Yeah, my initial phrasing was misleading. While it certainly wasn't clear from just the handouts, from the transcript, it sounds like the Census Bureau was using Pew and Heritage inter-state migration estimates, among other things, to try to judge the accuracy of the 2010 Census, which was in line with the mid-level population estimates. Obviously, not everyone responds to the census, and in some cases, census workers had to ask proxies like neighbors or building management. It also sounds like the full accuracy analysis won't be ready until 2012. The final accuracy analysis for the 2000 census indicated a slight overcount.
The first part of the conference was the census director explaining their preliminary evaluation of the 2010 Census.
The mail back rate was slightly higher in 2010 (74%) but that was because everyone got the short form. The mail back rate for the short form in 2000 was also 74%, with the long form response rate dragging down the overall rate. I'd guess that the long form took too much effort to complete, and some people would have decided it was too prying.
Of their effort to contact the remaining 26%, 22% was by contact with a building manager or neighbor (so 5.7% overall). vs. 17% in 2000. But I'd speculate that this might not be too much worse than in 2000, because of the long form. Some of the people who didn't turn in the long form, did so for other reasons than unwillingness to be contacted, moving, or working 3 jobs. It was just too much hassle. But it was easy to find them.
Overall contact rate, by mail, or followup with the household or a proxy was 99.60%, up from 99.57% in 2000.
They then compared the actual count with estimates. One was based on birth and death data, and guesses about immigration. They were within a couple 100,000 of the middle estimate, but off by 3 to 4 million on the outer estimates. So that could just be luck.
The other was to compare their estimates, which are based on the 2000 census, then updated based on births, deaths, migration data. They were within a few 100,000 on that as well. Which could say that they are no worse than 2000. If they had missed 5 million in 2000, their estimate for 2010 would also be off by 5 million or so, and if there count was as (in)accurate they would miss 5 million.
The 3rd party slides were really pretty goofy. They were based on the ACS data, which includes information on previous residence (perhaps in the PUMS). They showed a lot more people leaving Michigan than moving in, and the Census showed a population decline. Texas showed a lot more people moving in than moving out, and the Census showed a 20% gain, plus 4 new seats. And California showed more people moving out than moving in but not in the ratio of Michigan, and California showed a growth rate about the same as the US and no congressional seats. There wasn't any analysis of whether the net migration was of the correct magnitude to match the census population.
Washington Post gets the award for most inane questions (plural). One was whether the redistricting data would include data counts on same sex couples. And the second was whether in light of the shooting in Tucson, the Census Bureau had beefed up its security.
Amusing moment was when the census director Robert Groves said that the 3-year (2007-9) ACS data would be released later this month. Someone interjected, "yesterday". Groves then said that the 3-year (2007-9) ACS data had been released earlier this month.
Most of the press questions were about when would they be able to write an article with little research and little substance about the population in their area with a few quotes of reaction from a government official or demographer at the local university, and would the press get to see the data before the public. Groves said that the data would be released to the public (and press) via American Factfinder.
Title: Re: Official US 2010 Census Results
Post by: jimrtex on January 30, 2011, 02:30:29 AM
Media Advisory Census Bureau to Release Local 2010 Census Data for Louisiana, Mississippi, New Jersey and Virginia (http://www.census.gov/newsroom/releases/archives/2010_census/cb11-cn05.html)
Title: Re: Official US 2010 Census Results
Post by: minionofmidas on January 30, 2011, 02:32:27 AM
Odd choice of states.
Title: Re: Official US 2010 Census Results
Post by: jimrtex on January 30, 2011, 02:37:47 AM
Odd choice of states.
It will even out
Title: Re: Official US 2010 Census Results
Post by: minionofmidas on January 30, 2011, 02:42:37 AM
Odd choice of states.
It will even out
Title: Re: Official US 2010 Census Results
Post by: jimrtex on January 30, 2011, 02:54:01 AM
Odd choice of states.
It will even out
Title: Re: Official US 2010 Census Results
Post by: JohnnyLongtorso on January 30, 2011, 07:11:19 AM
Odd choice of states.
Not really, those are the states that have state legislative elections this year, so they need to redistrict ASAP.
Title: Re: Official US 2010 Census Results
Post by: minionofmidas on January 30, 2011, 07:24:01 AM
Odd choice of states.
Not really, those are the states that have state legislative elections this year, so they need to redistrict ASAP.
Title: Re: Official US 2010 Census Results
Post by: muon2 on January 30, 2011, 08:05:36 AM
Odd choice of states.
Not really, those are the states that have state legislative elections this year, so they need to redistrict ASAP.
The Census Bureau has tried to prioritize the data releases in terms of when states will need to have districts in place for the next election. Obviously the states with elections in Nov 2011 have the most pressing need. That's also why IL is likely to be early. The petitions for 2012 begin circulation in Sep 2011, and filing is in Dec. The Dems will want to have an approved map by May 31 in order to use their majority to get the map they want.
Title: Re: Official US 2010 Census Results
Post by: minionofmidas on January 30, 2011, 08:09:29 AM
I seem to dimly recall they went in alphabetical order last time.
Title: Re: Official US 2010 Census Results
Post by: jimrtex on January 30, 2011, 04:11:14 PM
I seem to dimly recall they went in alphabetical order last time.
For congressional districts, there is some flexibility since it would be possible to call a special session (though it is not particularly desirable for federal bureaucrats to be forcing legislative meetings). In 2001, the federal court determined the date when district boundaries had to be established, and how long it would take them to draw districts, and took jurisdiction based on that.
I figured your odd choice of words meant that you knew which states had odd-year legislative elections. In the case of Louisiana and Mississippi, the legislature is elected for (coincident) 4-year terms, so if they don't redistrict now, the new boundaries would not go into effect until 2015, more than half way through the census decade. In 2001, they might not have had a similar priority, since their legislative elections were in 2003. And because Louisiana didn't have a congressional primary at that time, it might have had the very latest filing deadline of any state.
Title: Re: Official US 2010 Census Results
Post by: jimrtex on February 02, 2011, 04:33:35 PM
Arkansas, Indiana, Iowa, and Maryland will be released next week.
It probably takes more effort to do larger states, and perhaps there are not tasks than can easily be done in parallel (eg. you could have one team do one medium sized state and then another, while another toils away on Illinois or Texas).
Also the Census Bureau has released its 2010 estimates for state populations based on the 2000 census.
Title: Re: Official US 2010 Census Results
Post by: jimrtex on February 02, 2011, 06:23:40 PM
Data was shipped to the legislative leaders in Louisiana, Mississippi, New Jersey, and Virginia. As soon as they acknowledge receipt (probably tomorrow) the census bureau will release summary tables:
Top 20 counties and cities by population.
Racial breakdown for state (all persons and over 18)
Hispanic + racial breakdown for non-Hispanics (all person and over 18)
Racial breakdown for persons reporting two races
Hispanic + racial breakdown for non-Hispanics for 20 most populous counties and cities.
So you will see these in newspapers on Friday.
FTP release will also happen tomorrow, and data will be available on American Fact Finder, the day after. PS if you have not used the new American Fact Finder, click on help and watch a couple of tutorials - otherwise it is pretty unexplicable.
Title: Re: Official US 2010 Census Results
Post by: Kevinstat on February 02, 2011, 06:44:13 PM
I seem to dimly recall they went in alphabetical order last time.
The Mississippi Constitution (http://www.sos.state.ms.us/ed_pubs/constitution/constitution.asp) (Article 13, Section 254) only mandates Legislative redistricting "in the second year following the 1980 decennial census and every ten (10) years thereafter," but allows it "at any other time, by joint resolution, by majority vote of all members of each house." I'm not sure if that means that the Legislature will have to re-adopt the plan adopted this year (assuming they adopt one as seems to be expected - it only didn't happen in 1991 because of a lawsuit alleging VRA violations and Department of Justice non-preclearance, and when a plan was enacted in 1992 a federal district court commuted the existing Legislative terms and ordered elections for a three-year term coinciding with the 1992 Presidential Election; more info in the first two case summaries here (http://www.senate.leg.state.mn.us/departments/scr/redist/redsum/MSSUM.HTM)) in 2012 (or make changes to that plan if they so desire), or if that particular wording of Mississippi's constitution (the constitutional amendment establishing this schedule was adopted in 1979, and in the 1980s the first non-special Legislative elections would have been in 1983) is interpreted to include years ending in 1, at least in those decades when the Legislature is up for election in years ending in 1.
Title: Re: Official US 2010 Census Results
Post by: jimrtex on February 03, 2011, 06:18:47 PM
This is a comparison of the 2010 Census Population to census bureau estimates of the 2010 population based on the 2000 Census adjusted for births, deaths, and migration.
I based the estimate on a linear interpolation of the July 1, 2009 and July 1, 2010 estimates, to April 1, 2010. The Census Bureau also produced an April 1, 2010 estimate, but the differences are negligible.
They really missed on Hawaii, which seems kind of odd, since you would think they would have a better handle on migration. North Dakota and Wyoming are both off considerably. This may be due the late-decade oil boomlet which may not show up as migration yet since it is based on tax returns.
State Census Error Estimate
Alabama 4,779,736 1.012 4,724,116
Alaska 710,231 1.007 705,319
Arizona 6,392,017 0.961 6,654,384
Arkansas 2,915,918 1.004 2,904,510
California 37,253,956 1.002 37,171,854
Colorado 5,029,196 0.991 5,075,271
Connecticut 3,574,097 1.014 3,523,909
Delaware 897,934 1.009 889,629
District of Columbia 601,723 0.990 607,936
Florida 18,801,310 1.009 18,636,021
Georgia 9,687,653 0.980 9,884,665
Hawaii 1,360,301 1.049 1,297,136
Idaho 1,567,582 1.007 1,555,963
Illinois 12,830,632 0.992 12,931,627
Indiana 6,483,802 1.007 6,438,290
Iowa 3,046,355 1.009 3,019,394
Kansas 2,853,118 1.006 2,835,198
Kentucky 4,339,367 1.002 4,332,643
Louisiana 4,533,372 1.003 4,519,442
Maine 1,328,361 1.011 1,313,677
Maryland 5,773,552 1.008 5,725,055
Massachusetts 6,547,629 0.989 6,621,511
Michigan 9,883,640 0.995 9,937,241
Minnesota 5,303,925 1.004 5,283,541
Mississippi 2,967,297 1.003 2,957,836
Missouri 5,988,927 0.997 6,004,364
Montana 989,415 1.011 978,655
Nebraska 1,826,341 1.011 1,807,017
Nevada 2,700,551 1.019 2,650,710
New Hampshire 1,316,470 0.995 1,323,194
New Jersey 8,791,894 1.008 8,723,039
New Mexico 2,059,179 1.016 2,027,235
New York 19,378,102 0.991 19,563,951
North Carolina 9,535,483 1.011 9,433,443
North Dakota 672,591 1.032 651,809
Ohio 11,536,504 1.000 11,532,048
Oklahoma 3,751,351 1.010 3,714,745
Oregon 3,831,074 0.996 3,847,417
Pennsylvania 12,702,379 1.006 12,625,113
Rhode Island 1,052,567 0.996 1,057,015
South Carolina 4,625,364 1.009 4,586,283
South Dakota 814,180 0.996 817,761
Tennessee 6,346,105 1.003 6,326,389
Texas 25,145,561 1.002 25,102,747
Utah 2,763,885 0.981 2,818,283
Vermont 625,741 1.006 622,184
Virginia 8,001,024 1.009 7,929,709
Washington 6,724,540 1.000 6,727,549
West Virginia 1,852,994 1.016 1,824,457
Wisconsin 5,686,986 1.004 5,664,077
Wyoming 563,626 1.031 546,826
Title: Re: Official US 2010 Census Results
Post by: jimrtex on February 03, 2011, 06:20:09 PM
Arkansas, Indiana, Iowa, and Maryland will be released next week.
Add Vermont to this list for week of February 7 to 11.
Title: Re: Official US 2010 Census Results
Post by: danny on February 03, 2011, 07:22:58 PM
The numbers for the first 4 states are out, but, of course they released the data in some horrible format I couldn't figure out how to use, so I'm looking here: http://twitter.com/Redistrict (http://twitter.com/Redistrict) for important news. Some interesting stuff so far.
Title: Re: Official US 2010 Census Results
Post by: jimrtex on February 03, 2011, 08:27:22 PM
The numbers for the first 4 states are out, but, of course they released the data in some horrible format I couldn't figure out how to use, so I'm looking here: http://twitter.com/Redistrict (http://twitter.com/Redistrict) for important news. Some interesting stuff so far.
2010 Census News (http://2010.census.gov/news/)
If you click on a news release for a state, it includes links to thematic maps for population and population change per county, and an Excel file with some highlight data, including top 20 counties and cities.
Louisiana: NOLA lost 29% of its population.
Mississippi: Southaven is now 3rd most populous city in Mississippi.
New Jersey: All counties in New Jersey, except Essex and Cape May gained population. Asians now make up 8.2% of the population, up from 5.7% in 2000.
Virginia: High growth area extends from just past Fairfax to Charlottesville and Richmond. Hispanics make up 7.9% of population, up from 4.7% in 2000, with 20% in Prince William County, and 31% in Manassas (Corrida de Toros).
The FTP files are ASCII text files, but they are huge - one record per geographic unit, which goes down to the block level, and include 63 racial combinations.
Title: Re: Official US 2010 Census Results
Post by: ag on February 03, 2011, 10:13:15 PM
So, Loudon grew by 84%! And next 10 years won't be much worse: the metro's coming :)
Title: Re: Official US 2010 Census Results
Post by: JohnnyLongtorso on February 03, 2011, 11:00:28 PM
I think Virginia's stuff is getting posted here (http://dlsgis.state.va.us/2010_Redistricting/2010_PL94-171/2010_PL94-171.htm) as it becomes available.
Also, in Mississippi (http://m.clarionledger.com/apps/pbcs.dll/article?AID=/20110203/NEWS/110203024/-1/WAP&template=wapart), the black population grew eight times more than the white population.
Also, in Mississippi (http://m.clarionledger.com/apps/pbcs.dll/article?AID=/20110203/NEWS/110203024/-1/WAP&template=wapart), the black population grew eight times more than the white population.
Title: Re: Official US 2010 Census Results
Post by: minionofmidas on February 04, 2011, 04:14:19 AM
Ìntra Hampton Roads population shifts are interesting.
Hampton declining, Portsmouth declining, Newport News flat, Chesapeake and Suffolk growing fast but Virginia Beach has more or less stopped growing and Norfolk is rebounding, growing marginally faster than VB.
Hampton declining, Portsmouth declining, Newport News flat, Chesapeake and Suffolk growing fast but Virginia Beach has more or less stopped growing and Norfolk is rebounding, growing marginally faster than VB.
Title: Re: Official US 2010 Census Results
Post by: minionofmidas on February 04, 2011, 04:43:35 AM
Also, in Mississippi (http://m.clarionledger.com/apps/pbcs.dll/article?AID=/20110203/NEWS/110203024/-1/WAP&template=wapart), the black population grew eight times more than the white population.
Which really just teaches to not use such comparisons for low-growth phenomena at all. Never, ever.
Title: Re: Official US 2010 Census Results
Post by: danny on February 04, 2011, 06:03:55 AM
The numbers for the first 4 states are out, but, of course they released the data in some horrible format I couldn't figure out how to use, so I'm looking here: http://twitter.com/Redistrict (http://twitter.com/Redistrict) for important news. Some interesting stuff so far.
2010 Census News (http://2010.census.gov/news/)
If you click on a news release for a state, it includes links to thematic maps for population and population change per county, and an Excel file with some highlight data, including top 20 counties and cities.
Lakewood really sticks out, all the other 20 biggest cities and townships grow between -8% to +8% while Lakewood grew 53.8%.
Title: Re: Official US 2010 Census Results
Post by: JohnnyLongtorso on February 04, 2011, 08:35:36 AM
Mmm, maps:
http://www.vpap.org/updates/show/672
Chesapeake and Suffolk (and Isle of Wight and York Counties) have experienced a lot of development in the past decade. Development has virtually stopped in Virginia Beach (there's land still available, but it's protected by a "green line"), and the other cities don't have any land left to develop on, except for the occasional redevelopment or small condo project.
I was a little surprised that VA-11 came in so overpopulated; I thought it was expected to be about even.
http://www.vpap.org/updates/show/672
Ìntra Hampton Roads population shifts are interesting.
Hampton declining, Portsmouth declining, Newport News flat, Chesapeake and Suffolk growing fast but Virginia Beach has more or less stopped growing and Norfolk is rebounding, growing marginally faster than VB.
Hampton declining, Portsmouth declining, Newport News flat, Chesapeake and Suffolk growing fast but Virginia Beach has more or less stopped growing and Norfolk is rebounding, growing marginally faster than VB.
Chesapeake and Suffolk (and Isle of Wight and York Counties) have experienced a lot of development in the past decade. Development has virtually stopped in Virginia Beach (there's land still available, but it's protected by a "green line"), and the other cities don't have any land left to develop on, except for the occasional redevelopment or small condo project.
I was a little surprised that VA-11 came in so overpopulated; I thought it was expected to be about even.
Title: Re: Official US 2010 Census Results
Post by: Verily on February 04, 2011, 09:28:51 AM
The numbers for the first 4 states are out, but, of course they released the data in some horrible format I couldn't figure out how to use, so I'm looking here: http://twitter.com/Redistrict (http://twitter.com/Redistrict) for important news. Some interesting stuff so far.
2010 Census News (http://2010.census.gov/news/)
If you click on a news release for a state, it includes links to thematic maps for population and population change per county, and an Excel file with some highlight data, including top 20 counties and cities.
Lakewood really sticks out, all the other 20 biggest cities and townships grow between -8% to +8% while Lakewood grew 53.8%.
Lakewood is an Orthodox Jewish stronghold.
Title: Re: Official US 2010 Census Results
Post by: Brittain33 on February 04, 2011, 10:07:48 AM
The numbers for the first 4 states are out, but, of course they released the data in some horrible format I couldn't figure out how to use, so I'm looking here: http://twitter.com/Redistrict (http://twitter.com/Redistrict) for important news. Some interesting stuff so far.
2010 Census News (http://2010.census.gov/news/)
If you click on a news release for a state, it includes links to thematic maps for population and population change per county, and an Excel file with some highlight data, including top 20 counties and cities.
Lakewood really sticks out, all the other 20 biggest cities and townships grow between -8% to +8% while Lakewood grew 53.8%.
Lakewood is an Orthodox Jewish stronghold.
The Star-Ledger credits a lot of the growth to new senior communities, plus the Hispanic population has increased a great deal. Natural increase among Hasidic Jews may be part of it but no population reproduces that quickly from such a high base.
Title: Re: Official US 2010 Census Results
Post by: Verily on February 04, 2011, 10:30:45 AM
The numbers for the first 4 states are out, but, of course they released the data in some horrible format I couldn't figure out how to use, so I'm looking here: http://twitter.com/Redistrict (http://twitter.com/Redistrict) for important news. Some interesting stuff so far.
2010 Census News (http://2010.census.gov/news/)
If you click on a news release for a state, it includes links to thematic maps for population and population change per county, and an Excel file with some highlight data, including top 20 counties and cities.
Lakewood really sticks out, all the other 20 biggest cities and townships grow between -8% to +8% while Lakewood grew 53.8%.
Lakewood is an Orthodox Jewish stronghold.
The Star-Ledger credits a lot of the growth to new senior communities, plus the Hispanic population has increased a great deal. Natural increase among Hasidic Jews may be part of it but no population reproduces that quickly from such a high base.
The Star-Ledger is just wrong. (Maybe there is substantial Hispanic growth, too; that I could see, although not accounting for more than 10% of overall growth.) It's not just (or even primarily) reproduction; older Orthodox communities in NYC are leaving for the lower prices in Lakewood. Over half the population, and nearly all of the growth, is Orthodox Jewish.
Title: Re: Official US 2010 Census Results
Post by: minionofmidas on February 04, 2011, 12:13:20 PM
Data are on factfinder now.
Since Va. CDs have already been linked to, here's the other three states.
Louisiana CD1 687k, CD2 493k, CD3 637k, CD4 667k, CD5 644k, CD6 727k, CD7 677k
Mississippi CD1 788k, CD2 668k, CD3 757k, CD4 754k
Jersey CD1 669k, CD2 692k, CD3 680k, CD4 725k, CD5 667k, CD6 669k, CD7 673k, CD8 660k, CD9 661k, CD10 634k, CD11 674k, CD12 702k, CD13 685k
Title: Re: Official US 2010 Census Results
Post by: danny on February 04, 2011, 12:23:22 PM
Speaking of Lakewood, the census Bureau did a horrible job of estimating it. It had its population growth from 60k in 2000 to 71k in 2009, and now the the census numbers a year later show 92k.
Title: Re: Official US 2010 Census Results
Post by: minionofmidas on February 04, 2011, 04:20:03 PM
The population of Mississippi outside of DeSoto (suburban Memphis), Rankin, Madison (suburban Jackson), Lamar (suburban Hattiesburg) and any number of random fifth county that grew by a couple of thousand people say Lafayette, fifth largest growth among top 20 counties anyhow (centred on the town of Oxford), actually fell.
Title: Re: Official US 2010 Census Results
Post by: danny on February 04, 2011, 05:31:24 PM
Maps of New Jersey:
http://www.nytimes.com/interactive/2011/02/04/nyregion/20100204-jersey.html?ref=nyregion (http://www.nytimes.com/interactive/2011/02/04/nyregion/20100204-jersey.html?ref=nyregion)
http://www.nytimes.com/interactive/2011/02/04/nyregion/20100204-jersey.html?ref=nyregion (http://www.nytimes.com/interactive/2011/02/04/nyregion/20100204-jersey.html?ref=nyregion)
Title: Re: Official US 2010 Census Results
Post by: Mexino Vote on February 04, 2011, 05:34:38 PM
Did Oklahoma gain or lose population?
Title: Re: Official US 2010 Census Results
Post by: danny on February 04, 2011, 05:46:27 PM
Did Oklahoma gain or lose population?
It gained, but at a slower rate than the country as a whole.
Title: Re: Official US 2010 Census Results
Post by: Mexino Vote on February 04, 2011, 05:47:51 PM
Did Oklahoma gain or lose population?
It gained, but at a slower rate than the country as a whole.
Oh. Better then nothing :) Welcome to OK, new Okies!
Title: Re: Official US 2010 Census Results
Post by: Verily on February 04, 2011, 06:12:20 PM
Maps of New Jersey:
http://www.nytimes.com/interactive/2011/02/04/nyregion/20100204-jersey.html?ref=nyregion (http://www.nytimes.com/interactive/2011/02/04/nyregion/20100204-jersey.html?ref=nyregion)
http://www.nytimes.com/interactive/2011/02/04/nyregion/20100204-jersey.html?ref=nyregion (http://www.nytimes.com/interactive/2011/02/04/nyregion/20100204-jersey.html?ref=nyregion)
Wish that map were interactive :/
The universal declines in the Shore towns are striking. Is that Hoboken or Jersey City with the big increase in white population in Hudson County? It's hard to tell. Either way, Jersey City has to be indisputably the most diverse city in the country now.
Title: Re: Official US 2010 Census Results
Post by: jimrtex on February 04, 2011, 06:20:44 PM
County Growth 2010 Census (http://2010.census.gov/2010census/data/)
Title: Re: Official US 2010 Census Results
Post by: cinyc on February 05, 2011, 02:48:52 AM
Maps of New Jersey:
http://www.nytimes.com/interactive/2011/02/04/nyregion/20100204-jersey.html?ref=nyregion (http://www.nytimes.com/interactive/2011/02/04/nyregion/20100204-jersey.html?ref=nyregion)
http://www.nytimes.com/interactive/2011/02/04/nyregion/20100204-jersey.html?ref=nyregion (http://www.nytimes.com/interactive/2011/02/04/nyregion/20100204-jersey.html?ref=nyregion)
Wish that map were interactive :/
The universal declines in the Shore towns are striking. Is that Hoboken or Jersey City with the big increase in white population in Hudson County? It's hard to tell. Either way, Jersey City has to be indisputably the most diverse city in the country now.
Definitely Hoboken. The non-Hispanic White population of Jersey City declined from 56,736 to 53,236. Hoboken's increased from 27,196 to 36,607. The percentage of non-Hispanic Whites in Hoboken increased by a little under 3 points from 70.5% to 73.2%.
Jersey City's numbers moved slightly in the opposite direction, from 23.6% to 21.5%. The fastest growing group there was Asians. Even the percentage of Hispanics and African Americans declined from 2000 (the total number of African Americans, too).
Edited to add: Jersey City is now 27.6% Hispanic, 23.9% African American, 23.5% Asian and 21.5% White. Its politicians are still 100% crooked.
Title: Re: Official US 2010 Census Results
Post by: minionofmidas on February 06, 2011, 06:07:00 AM
Walpack township, New Jersey...
1970 384 54.8%
1980 150 −60.9%
1990 67 −55.3%
2000 41 −38.8%
Est. 2006 40 −2.4%
2010 16
Okay, this requires an explanation. The wiki article doesn't even begin to give one. It grew until 1970. Mining?
Meanwhile, some magazine named it the 18th best place to live in NJ in 2008. Seems the residents don't agree. ^-^
Title: Re: Official US 2010 Census Results
Post by: danny on February 06, 2011, 07:52:56 AM
Walpack township, New Jersey...
1970 384 54.8%
1980 150 −60.9%
1990 67 −55.3%
2000 41 −38.8%
Est. 2006 40 −2.4%
2010 16
Okay, this requires an explanation. The wiki article doesn't even begin to give one. It grew until 1970. Mining?
Meanwhile, some magazine named it the 18th best place to live in NJ in 2008. Seems the residents don't agree. ^-^
1970 384 54.8%
1980 150 −60.9%
1990 67 −55.3%
2000 41 −38.8%
Est. 2006 40 −2.4%
2010 16
Okay, this requires an explanation. The wiki article doesn't even begin to give one. It grew until 1970. Mining?
Meanwhile, some magazine named it the 18th best place to live in NJ in 2008. Seems the residents don't agree. ^-^
Not mining, It looks like It's the Army Corps of Engineers fault. (http://home.comcast.net/~tecsite/WalpackCenter/WalpackStory.html) They wanted to turn the place into a lake so they forced a bunch of people out and afterwards abandoned the project was critical of how they kicked people out of their homes.
Title: Re: Official US 2010 Census Results
Post by: Verily on February 06, 2011, 10:03:55 AM
Walpack township, New Jersey...
1970 384 54.8%
1980 150 −60.9%
1990 67 −55.3%
2000 41 −38.8%
Est. 2006 40 −2.4%
2010 16
Okay, this requires an explanation. The wiki article doesn't even begin to give one. It grew until 1970. Mining?
Meanwhile, some magazine named it the 18th best place to live in NJ in 2008. Seems the residents don't agree. ^-^
1970 384 54.8%
1980 150 −60.9%
1990 67 −55.3%
2000 41 −38.8%
Est. 2006 40 −2.4%
2010 16
Okay, this requires an explanation. The wiki article doesn't even begin to give one. It grew until 1970. Mining?
Meanwhile, some magazine named it the 18th best place to live in NJ in 2008. Seems the residents don't agree. ^-^
Not mining, It looks like It's the Army Corps of Engineers fault. (http://home.comcast.net/~tecsite/WalpackCenter/WalpackStory.html) They wanted to turn the place into a lake so they forced a bunch of people out and afterwards abandoned the project was critical of how they kicked people out of their homes.
There are a few things on that page that make me think it's a hoax. Lake the size of Lake Michigan? Made national news by appearing in Playboy magazine? Uh...
The real reason seems to be that it is entirely within the Delaware Water Gap National Recreation Area. Residents at the time of designation were grandfathered in, but no one is allowed to move there (the federal government gets first option to buy any land that comes up for sale), so the population is in steady decline (and will probably reach zero in a decade or so).
Title: Re: Official US 2010 Census Results
Post by: danny on February 06, 2011, 10:32:43 AM
Well I don't know about that site but the dam story is legit. (http://www.nytimes.com/1990/09/04/nyregion/instead-of-a-dam-a-delaware-river-ghost-town.html?scp=3&sq=walpack&st=cse)
Title: Re: Official US 2010 Census Results
Post by: minionofmidas on February 06, 2011, 11:09:09 AM
It seems the National Recreational Area is what the gov't decided to do with the land after they abandoned the dam project.
http://en.wikipedia.org/wiki/Tocks_Island
http://en.wikipedia.org/wiki/Tocks_Island
Title: Re: Official US 2010 Census Results
Post by: danny on February 09, 2011, 01:26:30 PM
Data for Maryland is out, Baltimore city shrank while all the counties grew.
Title: Re: Official US 2010 Census Results
Post by: minionofmidas on February 09, 2011, 01:53:20 PM
...though Allegheny did so by 0.2%
Hispanic share almost doubled - Hispanic population more than doubled. Black share also rose. State is now down to 55% Anglo.
Hispanic share almost doubled - Hispanic population more than doubled. Black share also rose. State is now down to 55% Anglo.
Title: Re: Official US 2010 Census Results
Post by: cinyc on February 09, 2011, 03:47:52 PM
...though Allegheny did so by 0.2%
Hispanic share almost doubled - Hispanic population more than doubled. Black share also rose. State is now down to 55% Anglo.
Hispanic share almost doubled - Hispanic population more than doubled. Black share also rose. State is now down to 55% Anglo.
The Prince George's County exurban outmigration continues. The African-American population in neighboring Charles County nearly doubled, while the white population dropped by almost 10,000. African-Americans make up about 41% of the county's population. Whites are now barely a majority there, with 50.3%. Whites continue to leave Prince George's County, too.
Title: Re: Official US 2010 Census Results
Post by: jimrtex on February 09, 2011, 08:54:52 PM
Illinois, Texas, Oklahoma, and South Dakota ship next week.
Title: Re: Official US 2010 Census Results
Post by: JohnnyLongtorso on February 09, 2011, 09:39:19 PM
District-level numbers from SSP:
District Population Deviation
MD-01 744,275 22,581
MD-02 700,893 (20,801)
MD-03 719,856 (1,838)
MD-04 714,316 (7,378)
MD-05 767,369 45,675
MD-06 738,943 17,249
MD-07 659,776 (61,918)
MD-08 728,124 6,430
Total: 5,773,552
District Population Deviation
MD-01 744,275 22,581
MD-02 700,893 (20,801)
MD-03 719,856 (1,838)
MD-04 714,316 (7,378)
MD-05 767,369 45,675
MD-06 738,943 17,249
MD-07 659,776 (61,918)
MD-08 728,124 6,430
Total: 5,773,552
Title: Re: Official US 2010 Census Results
Post by: muon2 on February 09, 2011, 11:36:03 PM
Illinois, Texas, Oklahoma, and South Dakota ship next week.
I'm ready and waiting. ;)
Title: Re: Official US 2010 Census Results
Post by: ag on February 10, 2011, 09:17:10 PM
Any comments on Indiana, Iowa and Vermont?
Title: Re: Official US 2010 Census Results
Post by: JohnnyLongtorso on February 10, 2011, 09:55:50 PM
Sucks to be Iowa, really. Looks like the only places that grew were the Des Moines, Iowa City, and Cedar Rapids areas.
Title: Re: Official US 2010 Census Results
Post by: Torie on February 10, 2011, 10:08:27 PM
...though Allegheny did so by 0.2%
Hispanic share almost doubled - Hispanic population more than doubled. Black share also rose. State is now down to 55% Anglo.
Hispanic share almost doubled - Hispanic population more than doubled. Black share also rose. State is now down to 55% Anglo.
The Prince George's County exurban outmigration continues. The African-American population in neighboring Charles County nearly doubled, while the white population dropped by almost 10,000. African-Americans make up about 41% of the county's population. Whites are now barely a majority there, with 50.3%. Whites continue to leave Prince George's County, too.
I wonder if this reflects the "syndrome" that whites don't want to live with blacks when their percentage in the hood gets "too high," or whether it is more due to differential hood housing demand, with blacks paying a premium to live in high percentage black neighborhoods that are safe and middle class, with decent schools. Does anyone know? Is this more about "racism" or economics is my question. And I have no idea, at least in this neck of the woods (in the deep South I just might assume racism frankly), what the answer is.
Title: Re: Official US 2010 Census Results
Post by: Torie on February 10, 2011, 10:11:45 PM
Sucks to be Iowa, really. Looks like the only places that grew were the Des Moines, Iowa City, and Cedar Rapids areas.
Yes, the Quad cities, with about 450,000 people or something, to me seems like the biggest small town in America. It has the population, but not the amenities one would expect from that large a population. I am not surprised that little or no new blood wants to migrate to such a dreary place.
Title: Re: Official US 2010 Census Results
Post by: Verily on February 10, 2011, 11:50:48 PM
Sucks to be Iowa, really. Looks like the only places that grew were the Des Moines, Iowa City, and Cedar Rapids areas.
Dubuque grew a little bit, too. As did Council Bluffs.
But, yeah, looking at the historical data for the rural Iowa counties... It's been a long ride down.
Title: Re: Official US 2010 Census Results
Post by: cinyc on February 10, 2011, 11:55:10 PM
...though Allegheny did so by 0.2%
Hispanic share almost doubled - Hispanic population more than doubled. Black share also rose. State is now down to 55% Anglo.
Hispanic share almost doubled - Hispanic population more than doubled. Black share also rose. State is now down to 55% Anglo.
The Prince George's County exurban outmigration continues. The African-American population in neighboring Charles County nearly doubled, while the white population dropped by almost 10,000. African-Americans make up about 41% of the county's population. Whites are now barely a majority there, with 50.3%. Whites continue to leave Prince George's County, too.
I wonder if this reflects the "syndrome" that whites don't want to live with blacks when their percentage in the hood gets "too high," or whether it is more due to differential hood housing demand, with blacks paying a premium to live in high percentage black neighborhoods that are safe and middle class, with decent schools. Does anyone know? Is this more about "racism" or economics is my question. And I have no idea, at least in this neck of the woods (in the deep South I just might assume racism frankly), what the answer is.
Part of it is that whites are leaving Maryland (and much of the Northeast, I suspect) for other areas of the country. Maryland's non-Hispanic white population dropped by about 32,000 in the last 10 years. Part is people moving from suburban Prince George's to new exurban developments in Charles County. Since the overwhelming majority of Prince George's residents are black, it usually logically follows that those moving in to new developments up the road would be of the same race. And a good part of it is probably simple white flight to other areas of Maryland. The white population of Charles County's neighbors, St. Mary's and Calvert counties, both rose by over 10,000.
Title: Re: Official US 2010 Census Results
Post by: I spent the winter writing songs about getting better on February 11, 2011, 12:16:39 AM
I wonder if gays moving will give Iowa a boost. A woman at work was talking about her lesbian sister who is planning on moving with her girlfriend to Iowa a few weeks ago.
Title: Re: Official US 2010 Census Results
Post by: cinyc on February 11, 2011, 12:20:50 AM
Any comments on Indiana, Iowa and Vermont?
There's not a heck of a lot to say about Vermont. It didn't grow by much (under 3%), and what little growth there was appears to be in the Burlington and Montpelier areas. Population growth in Southern Vermont was pretty much flat, with Rutland and Windsor Counties losing population. Essex County on the Canadian border also lost population.
Vermont is still overwhelmingly white - 94.3%, down from 96.2%. The Hispanic population nearly doubled - but that's not saying much - it's still under 10,000 and less than 2% of the total population. So did the black population, but that's still under 6,000.
Title: Re: Official US 2010 Census Results
Post by: JohnnyLongtorso on February 11, 2011, 11:41:04 AM
Arkansas is also up; it looks like bad news for the Democrats, since all of the counties along the Mississippi and the southern part of the state lost population, while the Walmartistan and the ring of Republican counties around Little Rock gained quite a bit.
Title: Re: Official US 2010 Census Results
Post by: JohnnyLongtorso on February 11, 2011, 11:50:31 AM
Here are the CD numbers for Arkansas, Indiana, and Iowa:
Arkansas
Mean - 728,979
AR-01 - 687,694 (-41,285)
AR-02 - 751,377 (+22,398)
AR-03 - 822,564 (+93,585)
AR-04 - 654,283 (-74,696)
Indiana
Mean - 720,422
IN-01 - 705,600 (-14,822)
IN-02 - 679,254 (-41,168)
IN-03 - 723,633 (+3,211)
IN-04 - 789,835 (+69,413)
IN-05 - 809,107 (+88,685)
IN-06 - 676,548 (-43,874)
IN-07 - 676,351 (-44,071)
IN-08 - 694,398 (-26,024)
IN-09 - 729,076 (+8,654)
Iowa
Mean (5 districts) - 609,271
IA-01 - 596,443 (-12,828)
IA-02 - 620,856 (+11,585)
IA-03 - 642,116 (+32,845)
IA-04 - 609,487 (+216)
IA-05 - 577,453 (-31,818)
Title: Re: Official US 2010 Census Results
Post by: JohnnyLongtorso on February 11, 2011, 12:06:29 PM
I've also been looking at the state legislative data for Louisiana to see just how screwed the Dems are. Looks like New Orleans will be losing a State Senate seat, while Baton Rouge will be gaining one. The Republicans will probably also be able to squeeze at least an extra half a seat out of the territory east of Baton Rouge.
Title: Re: Official US 2010 Census Results
Post by: cinyc on February 11, 2011, 06:16:26 PM
One thing to note about Indiana is that Fort Wayne's population growth is overstated. The city grew by 23.3% from 2000 - by far, the most of the top 5 cities in the state. But that's skewed because Fort Wayne also annexed some neighboring towns in 2006.
Of the other top 5 cities, Indianapolis grew by just under 5%. Evansville (-3%), South Bend (-6%) and Hammond (-3%) all lost population.
Of the other top 5 cities, Indianapolis grew by just under 5%. Evansville (-3%), South Bend (-6%) and Hammond (-3%) all lost population.
Title: Re: Official US 2010 Census Results
Post by: Torie on February 12, 2011, 12:13:14 AM
Quote
Indianapolis grew by just under 5%.
With a rather substantial shift from inner Indianapolis (the old city, rather than the new city, which is all of Marion County), to the now defunct suburbs of Indianapolis in now outer Indianapolis. In other words, just about all the growth was in the outer portion of Marion County.
Title: Re: Official US 2010 Census Results
Post by: cinyc on February 12, 2011, 01:09:28 AM
Quote
Indianapolis grew by just under 5%.
With a rather substantial shift from inner Indianapolis (the old city, rather than the new city, which is all of Marion County), to the now defunct suburbs of Indianapolis in now outer Indianapolis. In other words, just about all the growth was in the outer portion of Marion County.
The counties surrounding Marion also experienced rapid growth, particularly Hendricks (+40%) to the west and Hamilton (+50%) to the north. The population of Carmel and Fishers in Hamilton County both more than doubled; Noblesville in that county grew by more than 80%.
Gary lost 22% of its population. Jeffersonville, a Louisville suburb, grew by 64%.
Title: Re: Official US 2010 Census Results
Post by: nclib on February 12, 2011, 12:28:00 PM
The congressional districts that appear to have lost population are (within state ordered from most declining):
AL-7
AR-4
CA-31, 53, 38, 47
FL-10
IL-4, 1, 2, 17, 7, 9, 6
IN-7, 6
IA-5
KS-1
LA-2, 3, 5
MI-14, 13, 5, 12, 1, 9, 15, 11
MN-4, 7
MS-2
MO-1
NE-3
NJ-10, 8
NY-28, 27, 24, 25, 26, 29
NC-1
OH-11, 10, 6, 17, 5, 1, 4
PA-14, 12, 5, 4, 2, 3
RI-1
SC-6
TN-9
VA-2
WV-3, 1
Most of which are self-explanatory (inner cities, black belt, plains, rust belt), but I was somewhat surprised at IL-6, VA-2, and FL-10.
Title: Re: Official US 2010 Census Results
Post by: cinyc on February 12, 2011, 02:16:00 PM
The congressional districts that appear to have lost population are (within state ordered from most declining):
AL-7
AR-4
CA-31, 53, 38, 47
FL-10
IL-4, 1, 2, 17, 7, 9, 6
IN-7, 6
IA-5
KS-1
LA-2, 3, 5
MI-14, 13, 5, 12, 1, 9, 15, 11
MN-4, 7
MS-2
MO-1
NE-3
NJ-10, 8
NY-28, 27, 24, 25, 26, 29
NC-1
OH-11, 10, 6, 17, 5, 1, 4
PA-14, 12, 5, 4, 2, 3
RI-1
SC-6
TN-9
VA-2
WV-3, 1
Most of which are self-explanatory (inner cities, black belt, plains, rust belt), but I was somewhat surprised at IL-6, VA-2, and FL-10.
AL-7
AR-4
CA-31, 53, 38, 47
FL-10
IL-4, 1, 2, 17, 7, 9, 6
IN-7, 6
IA-5
KS-1
LA-2, 3, 5
MI-14, 13, 5, 12, 1, 9, 15, 11
MN-4, 7
MS-2
MO-1
NE-3
NJ-10, 8
NY-28, 27, 24, 25, 26, 29
NC-1
OH-11, 10, 6, 17, 5, 1, 4
PA-14, 12, 5, 4, 2, 3
RI-1
SC-6
TN-9
VA-2
WV-3, 1
Most of which are self-explanatory (inner cities, black belt, plains, rust belt), but I was somewhat surprised at IL-6, VA-2, and FL-10.
There's no way NY-23 didn't lose population, too. Perhaps NY-22, as well - though that depends on whether more people left the Binghamton area than moved into the Orange, Ulster and Dutchess portion of the district.
Title: Re: Official US 2010 Census Results
Post by: nclib on February 12, 2011, 03:52:43 PM
The congressional districts that appear to have lost population are (within state ordered from most declining):
AL-7
AR-4
CA-31, 53, 38, 47
FL-10
IL-4, 1, 2, 17, 7, 9, 6
IN-7, 6
IA-5
KS-1
LA-2, 3, 5
MI-14, 13, 5, 12, 1, 9, 15, 11
MN-4, 7
MS-2
MO-1
NE-3
NJ-10, 8
NY-28, 27, 24, 25, 26, 29
NC-1
OH-11, 10, 6, 17, 5, 1, 4
PA-14, 12, 5, 4, 2, 3
RI-1
SC-6
TN-9
VA-2
WV-3, 1
Most of which are self-explanatory (inner cities, black belt, plains, rust belt), but I was somewhat surprised at IL-6, VA-2, and FL-10.
AL-7
AR-4
CA-31, 53, 38, 47
FL-10
IL-4, 1, 2, 17, 7, 9, 6
IN-7, 6
IA-5
KS-1
LA-2, 3, 5
MI-14, 13, 5, 12, 1, 9, 15, 11
MN-4, 7
MS-2
MO-1
NE-3
NJ-10, 8
NY-28, 27, 24, 25, 26, 29
NC-1
OH-11, 10, 6, 17, 5, 1, 4
PA-14, 12, 5, 4, 2, 3
RI-1
SC-6
TN-9
VA-2
WV-3, 1
Most of which are self-explanatory (inner cities, black belt, plains, rust belt), but I was somewhat surprised at IL-6, VA-2, and FL-10.
There's no way NY-23 didn't lose population, too. Perhaps NY-22, as well - though that depends on whether more people left the Binghamton area than moved into the Orange, Ulster and Dutchess portion of the district.
I used jimrtex's list from this thread (https://uselectionatlas.org/FORUM/index.php?topic=89799.30) though that may be the 2009 ACS estimates, and I used the census 2000 100% summary for the 2000s CD's. That has NY-23 up 3,882 or 0.59% and NY-22 up 13,587 or 2.08%.
Title: Re: Official US 2010 Census Results
Post by: Brittain33 on February 12, 2011, 08:57:10 PM
Most of which are self-explanatory (inner cities, black belt, plains, rust belt), but I was somewhat surprised at IL-6, VA-2, and FL-10.
FL-10 is completely built out and densely populated. There's no room for expansion.
Title: Re: Official US 2010 Census Results
Post by: cinyc on February 12, 2011, 10:16:28 PM
I used jimrtex's list from this thread (https://uselectionatlas.org/FORUM/index.php?topic=89799.30) though that may be the 2009 ACS estimates, and I used the census 2000 100% summary for the 2000s CD's. That has NY-23 up 3,882 or 0.59% and NY-22 up 13,587 or 2.08%.
I wouldn't doubt NY-22, due to growth in the NYC exurbs. But how the heck did NY-23 pick up population? Border towns like Massena and Ogdensburg are morribund. Plattsburgh should be losing population, too - and likely Watertown (though that's more dependent on how much Fort Drum grew or shrank in the past decade). The only thing I can think of is that it might be offset by some growth in suburban Syracuse (Madison and Oswego counties). Or perhaps there are more folks ending up in the prisons within the district.
Title: Re: Official US 2010 Census Results
Post by: Kevinstat on February 13, 2011, 04:40:53 PM
Looks like Iowa won't be able to draw a congressional district entirely in the 3x3 block of counties centered on Polk County (Des Moines), unless the tradition (and seeming state requirement) of not splitting counties is broken. The closest you can get without going outside of the "Des Moines 9" or splitting a county is the Des Moines 9 minus Boone County (the second smallest county in the group) which is 2,568.75 people short of the ideal Iowa congressional district population (most people round the ideal district population to the nearest integer, but I'm not most people even though I don't support chopping people into fractional portions). That's only 0.34% of the ideal district population, but probably too much to pass muster for a congressional district. The Des Moines 9 minus Madison County (the smallest county in the group) would be 8,058.25 people (1.06%) too large. :(
Title: Re: Official US 2010 Census Results
Post by: nclib on February 13, 2011, 04:57:07 PM
...though Allegheny did so by 0.2%
Hispanic share almost doubled - Hispanic population more than doubled. Black share also rose. State is now down to 55% Anglo.
Hispanic share almost doubled - Hispanic population more than doubled. Black share also rose. State is now down to 55% Anglo.
The Prince George's County exurban outmigration continues. The African-American population in neighboring Charles County nearly doubled, while the white population dropped by almost 10,000. African-Americans make up about 41% of the county's population. Whites are now barely a majority there, with 50.3%. Whites continue to leave Prince George's County, too.
I wonder if this reflects the "syndrome" that whites don't want to live with blacks when their percentage in the hood gets "too high," or whether it is more due to differential hood housing demand, with blacks paying a premium to live in high percentage black neighborhoods that are safe and middle class, with decent schools. Does anyone know? Is this more about "racism" or economics is my question. And I have no idea, at least in this neck of the woods (in the deep South I just might assume racism frankly), what the answer is.
Part of it is that whites are leaving Maryland (and much of the Northeast, I suspect) for other areas of the country. Maryland's non-Hispanic white population dropped by about 32,000 in the last 10 years. Part is people moving from suburban Prince George's to new exurban developments in Charles County. Since the overwhelming majority of Prince George's residents are black, it usually logically follows that those moving in to new developments up the road would be of the same race. And a good part of it is probably simple white flight to other areas of Maryland. The white population of Charles County's neighbors, St. Mary's and Calvert counties, both rose by over 10,000.
Is there data yet for which states had a net loss of whites?
Title: Re: Post OFFICIAL 2010 US Census data here
Post by: nclib on February 13, 2011, 05:03:17 PM
What information will be released in the 2010 census that was not released in the 2000 census and visa versa?
Anybody know?
Number Persons in Household
Housing: Owned; Mortgaged; Rented; Squatting.
For each person:
Family relationship to person filling out form
Sex
Age
Hispanicity
Race
The information that was formerly collected by the long form, is now collected in the American Community Survey.
Housing: Type (house, apartment, cave, boat, etc.), age, length of tenancy, acreage, farm income, business use, number of rooms, number of bedrooms, running water, flush toilet, bathtub or shower, sink with faucet, stove or range, refrigerator, telephone, number of vehicles, heating fuel, cost of electricity, gas, water&sewer, and other fuel; food stamps, condominium (and fee), rent (and whether board included), value, taxes, insurance, mortgage payments,
Population: Citizenship, and basis thereof; entry into USA, attending school and level, highest level of education completed, ancestry, language spoken at home, residence location 1 year earlier, health insurance, deaf, blind, physical disabilities, marital status, recent motherhood, caring for grandchildren, military service, employment, commuting, laid off, productive or government worker, income, social security.
The long form was distributed to a large sample of households (10% to 20%) and was intended to ask all the annoying questions that would have made census participation plummet if asked of everyone. It was intended to be a large enough sample to provide statistically reliable information for small areas (down to the block group, which has around 1000 persons).
The American Community Survey is administered on an ongoing basis, with a much smaller sample each month, but which when aggregated over 5 years produces a comparable sample size and accuracy to the long form. The Census Bureau earlier this month released the ACS data for 2005 to 2009. The Census Bureau also releases ACS data on 3-year and 1-year basis for larger areas (3-year data is statistically reliable for areas with population greater than 20,000; and the 1-year data for areas with population greater than 65,000).
Because the data is collected on a continuing basis, next year the ACS will be released for 2006 to 2010, with the oldest year of the sample being dropped and a new year added in. So the ACS will be better for trends, while the long form census data, while clearer and more concise because it all is for a single data, won't show changes between decades, and because of unlucky timing might even be misleading (a 2010 long form would show higher levels of unemployment, and more persons in their mid-20s living with their parents).
So everything will still be covered, just in different format or different times? I had heard a while back that there would not be ancestry asked this decade. Yes or no?
Title: Re: Official US 2010 Census Results
Post by: minionofmidas on February 13, 2011, 05:52:30 PM
...though Allegheny did so by 0.2%
Hispanic share almost doubled - Hispanic population more than doubled. Black share also rose. State is now down to 55% Anglo.
Hispanic share almost doubled - Hispanic population more than doubled. Black share also rose. State is now down to 55% Anglo.
The Prince George's County exurban outmigration continues. The African-American population in neighboring Charles County nearly doubled, while the white population dropped by almost 10,000. African-Americans make up about 41% of the county's population. Whites are now barely a majority there, with 50.3%. Whites continue to leave Prince George's County, too.
I wonder if this reflects the "syndrome" that whites don't want to live with blacks when their percentage in the hood gets "too high," or whether it is more due to differential hood housing demand, with blacks paying a premium to live in high percentage black neighborhoods that are safe and middle class, with decent schools. Does anyone know? Is this more about "racism" or economics is my question. And I have no idea, at least in this neck of the woods (in the deep South I just might assume racism frankly), what the answer is.
Part of it is that whites are leaving Maryland (and much of the Northeast, I suspect) for other areas of the country. Maryland's non-Hispanic white population dropped by about 32,000 in the last 10 years. Part is people moving from suburban Prince George's to new exurban developments in Charles County. Since the overwhelming majority of Prince George's residents are black, it usually logically follows that those moving in to new developments up the road would be of the same race. And a good part of it is probably simple white flight to other areas of Maryland. The white population of Charles County's neighbors, St. Mary's and Calvert counties, both rose by over 10,000.
Is there data yet for which states had a net loss of whites?
Title: Re: Official US 2010 Census Results
Post by: muon2 on February 13, 2011, 06:05:13 PM
The congressional districts that appear to have lost population are (within state ordered from most declining):
AL-7
AR-4
CA-31, 53, 38, 47
FL-10
IL-4, 1, 2, 17, 7, 9, 6
IN-7, 6
IA-5
KS-1
LA-2, 3, 5
MI-14, 13, 5, 12, 1, 9, 15, 11
MN-4, 7
MS-2
MO-1
NE-3
NJ-10, 8
NY-28, 27, 24, 25, 26, 29
NC-1
OH-11, 10, 6, 17, 5, 1, 4
PA-14, 12, 5, 4, 2, 3
RI-1
SC-6
TN-9
VA-2
WV-3, 1
Most of which are self-explanatory (inner cities, black belt, plains, rust belt), but I was somewhat surprised at IL-6, VA-2, and FL-10.
AL-7
AR-4
CA-31, 53, 38, 47
FL-10
IL-4, 1, 2, 17, 7, 9, 6
IN-7, 6
IA-5
KS-1
LA-2, 3, 5
MI-14, 13, 5, 12, 1, 9, 15, 11
MN-4, 7
MS-2
MO-1
NE-3
NJ-10, 8
NY-28, 27, 24, 25, 26, 29
NC-1
OH-11, 10, 6, 17, 5, 1, 4
PA-14, 12, 5, 4, 2, 3
RI-1
SC-6
TN-9
VA-2
WV-3, 1
Most of which are self-explanatory (inner cities, black belt, plains, rust belt), but I was somewhat surprised at IL-6, VA-2, and FL-10.
The suburbs that make up IL-6 are essentially built out. There was a lot of housing built a generation ago, and the children have moved lot reducing the population. The growth areas occur when old properties have been removed for higher-density housing, but that is not a large factor in the last decade.
Title: Re: Official US 2010 Census Results
Post by: cinyc on February 14, 2011, 12:07:34 AM
Is there data yet for which states had a net loss of whites?
Correct.
Of the states with released 2010 redistricting files so far, the total non-Hispanic white population fell from 2000 figures in Louisiana (-1.5%), Maryland (-2.6%) and New Jersey (-5.9%).
It increased in Arkansas (+4.1%), Indiana (+2.0%), Iowa (+0.2%), Mississippi (+0.2%), Vermont (+1.3%) and Virginia (+5.6%).
Title: Re: Official US 2010 Census Results
Post by: minionofmidas on February 14, 2011, 04:32:38 AM
Not going to check all the others, but Mississippi's certainly fell (by 0.3). I noticed it at the time and doublechecked just right now.
Title: Re: Post OFFICIAL 2010 US Census data here
Post by: jimrtex on February 14, 2011, 06:20:57 AM
So everything will still be covered, just in different format or different times? I had heard a while back that there would not be ancestry asked this decade. Yes or no?
Massachusetts 10 26.4%
Massachusetts 9 25.8%
Pennsylvania 7 22.3%
Massachusetts 6 19.3%
Pennsylvania 13 18.8%
Pennsylvania 8 18.4%
Massachusetts 7 17.3%
New York 1 16.8%
New York 3 16.8%
Massachusetts 5 16.1%
New York 19 15.8%
Massachusetts 3 15.7%
New York 20 15.5%
New Jersey 3 15.3%
New Jersey 1 15.3%
New Hampshire 1 15.2%
New York 21 14.7%
New Jersey 5 14.2%
Massachusetts 1 13.9%
Rhode Island 2 13.9%
New Jersey 4 13.9%
New Hampshire 2 13.7%
New York 25 13.7%
Massachusetts 4 13.4%
Connecticut 2 13.3%
Pennsylvania 11 13.3%
Massachusetts 2 13.1%
New York 22 12.9%
New Jersey 2 12.9%
New York 29 12.9%
New Jersey 11 12.8%
New York 24 12.8%
Maryland 1 12.5%
Delaware AL 12.5%
Pennsylvania 6 12.5%
New York 23 12.3%
Maine 1 12.3%
Ohio 10 12.1%
Pennsylvania 18 12.1%
Illinois 3 12.0%
Rhode Island 1 11.8%
New York 27 11.8%
Vermont AL 11.7%
Connecticut 5 11.7%
New York 2 11.7%
Connecticut 3 11.4%
Illinois 13 11.3%
Pennsylvania 10 11.3%
Missouri 2 11.2%
Kentucky 4 11.1%
Top Irish CD by State:
Alabama 4 9.9%
Alaska AL 7.6%
Arizona 8 8.3%
Arkansas 3 9.1%
California 6 9.4%
Colorado 6 9.2%
Connecticut 2 13.3%
Delaware AL 12.5%
Florida 10 10.9%
Georgia 9 9.0%
Hawaii 2 3.6%
Idaho 1 7.3%
Illinois 3 12.0%
Indiana 5 8.8%
Iowa 2 9.4%
Kansas 3 9.4%
Kentucky 4 11.1%
Louisiana 1 7.4%
Maine 1 12.3%
Maryland 1 12.5%
Massachusetts 10 26.4%
Michigan 8 8.7%
Minnesota 4 8.2%
Mississippi 1 9.3%
Missouri 2 11.2%
Montana AL 10.0%
Nebraska 2 9.9%
Nevada 2 7.9%
New Hampshire 1 15.2%
New Jersey 3 15.3%
New Mexico 1 5.2%
New York 1 16.8%
North Carolina 11 9.0%
North Dakota AL 3.9%
Ohio 10 12.1%
Oklahoma 3 8.7%
Oregon 4 8.3%
Pennsylvania 7 22.3%
Rhode Island 2 13.9%
South Carolina 3 7.8%
South Dakota AL 5.9%
Tennessee 7 8.9%
Texas 4 8.5%
Utah 2 4.4%
Vermont AL 11.7%
Virginia 10 8.4%
Washington 5 8.9%
West Virginia 3 10.5%
Wisconsin 2 7.6%
Wyoming AL 8.8%
Title: Re: Official US 2010 Census Results
Post by: cinyc on February 14, 2011, 02:14:29 PM
Not going to check all the others, but Mississippi's certainly fell (by 0.3). I noticed it at the time and doublechecked just right now.
What are you looking at?
I'm getting my data from Table 3 in the custom tables release by the Census bureau titled "Hispanic or Latino and Race Alone or in Combination - All Ages". Mississippi's tables are available here (http://2010.census.gov/news/xls/st28-final_Mississippi.xls), in Excel format. That shows a gain of 4,149 non-Hispanic whites from 2000 to 2010, or 0.2%. Those charts counts people who listed two races as members of both races, which probably explains the discrepancy.
Iowa (-0.3%) would flip to the negative growth side if you exclude those of two or more races, too.
Title: Re: Official US 2010 Census Results
Post by: minionofmidas on February 14, 2011, 02:37:12 PM
Yes, I was looking at the more standard Hispanic Origin and Race table (table 2). I suggest you do too. -_-
Title: Re: Official US 2010 Census Results
Post by: bgwah on February 14, 2011, 07:46:45 PM
Is there a schedule anywhere? I want Washington data! :(
Title: Re: Official US 2010 Census Results
Post by: jimrtex on February 14, 2011, 10:40:53 PM
Is there a schedule anywhere? I want Washington data! :(
http://2010.census.gov/news/press-kits/redistricting.html
Title: Re: Official US 2010 Census Results
Post by: minionofmidas on February 15, 2011, 12:17:20 AM
Oooh, South Dakota. Native figures will be interesting.
Title: Re: Official US 2010 Census Results
Post by: bgwah on February 15, 2011, 01:27:51 AM
Is there a schedule anywhere? I want Washington data! :(
http://2010.census.gov/news/press-kits/redistricting.html
That doesn't seem terribly informative. :-\
Damnit, Gary! What's the point of having you in charge if you don't put WA first? :(
Title: Re: Official US 2010 Census Results
Post by: jimrtex on February 15, 2011, 01:05:12 PM
Is there a schedule anywhere? I want Washington data! :(
http://2010.census.gov/news/press-kits/redistricting.html
That doesn't seem terribly informative. :-\
Damnit, Gary! What's the point of having you in charge if you don't put WA first? :(
It is largely tied to when the states need the data. The first states were those that have odd-year elections for their legislatures and so need to complete legislative redistricting real soon (before the primaries). Illinois and Texas have early primaries next year, so they need to be completed before the filing deadline. Texas redistricting is done by the legislature so it has to be finished by May if it is done in the regular session. Washington has an August primary, and a commission to do the redistricting, so they could be among the last. It also takes longer for larger states, so Washington might lag a bit there.
The Census Bureau is required to provide all states results within 1 year of the census, so March 31st at the latest.
Title: Re: Official US 2010 Census Results
Post by: ill ind on February 15, 2011, 04:49:10 PM
So I take a look at the data for Illinois released today:
Big shocker: Non Hispanic population -.8%
Hispanic population +32.5%
If it weren't for Hispanics, our state's population wuold have been sunk.
Ill Ind
Big shocker: Non Hispanic population -.8%
Hispanic population +32.5%
If it weren't for Hispanics, our state's population wuold have been sunk.
Ill Ind
Title: Re: Official US 2010 Census Results
Post by: Linus Van Pelt on February 15, 2011, 05:00:37 PM
Cook shrinks a bit, older inner suburbs grow slightly, outer suburbs grow a lot (Kendall county more than doubled!), and the rest of the state looks like Iowa (cities grow a bit while rural counties shrink).
Not massively to the advantage of one party or another, since each party's strongest base area is shrinking.
Not massively to the advantage of one party or another, since each party's strongest base area is shrinking.
Title: Re: Official US 2010 Census Results
Post by: cinyc on February 15, 2011, 05:48:31 PM
So I take a look at the data for Illinois released today:
Big shocker: Non Hispanic population -.8%
Hispanic population +32.5%
If it weren't for Hispanics, our state's population wuold have been sunk.
Ill Ind
Big shocker: Non Hispanic population -.8%
Hispanic population +32.5%
If it weren't for Hispanics, our state's population wuold have been sunk.
Ill Ind
Yes. Illinois' non-Hispanic white (-3%) and black (-1.3%) population both fell. Asians and Hispanics grew.
Chicago shrunk by almost 7%, at just under 2.7 million. That's about 150,000 less than 2.85 million 2009 census estimate. If Houston's population has been grossly understimated, the Second City might be our fourth largest... but I doubt it.
Far west suburban Aurora (+38%) is now the second largest city in the state, passing Rockford (+2%). Far southwest suburban Joliet (+39%) rocketed from seventh to fourth. Naperville's population was up by 10.5% - but fell from fourth to fifth.
Like Chicago, Cook County lost population (-3.4%). DuPage tread water (+1.4%). The far-out Chicago suburban collar counties grew the most, particularly Kendall (+110%), Will (+35%), Kane (+27%) and McHenry (+19%).
Title: Re: Official US 2010 Census Results
Post by: cinyc on February 15, 2011, 06:01:24 PM
Oklahoma was also released today. The state grew by 8.7%, but the non-Hispanic white population only grew by 0.7%. The Hispanic population is up by 85.2%; the non-Hispanic Native American population grew by 16.0%.
Oklahoma City grew (+14.6%); Tulsa shrunk (-0.3%) - though their respective counties both grew (Oklahoma County +8.8%; Tulsa County +7.1%). The more rapid growth was in counties bordering those two - Canadian County, west of OKC, grew by 32%; Cleveland County, south of OKC, grew by 23%; Wagoner County, southeast of Tulsa, grew by 27%; Rogers to Tulsa's east, was up by 23%.
South Dakota will be next. Legislative officials were sent the files today.
Title: Re: Official US 2010 Census Results
Post by: minionofmidas on February 15, 2011, 11:38:35 PM
Self-redesignation as American Indian continues apace in Oklahoma, I see. (One will have to wait until the release of the individual tribes count in a couple of years to see if there's also a population explosion among the more genuinely Indian population.)
Title: Re: Official US 2010 Census Results
Post by: cinyc on February 16, 2011, 12:11:55 AM
The data released so far doesn't match the sometimes trumpeted theme that people are moving away from the suburbs back into the cities. Many of the cities we've seen that have grown thus far are those that include areas that very suburban to begin with, like Indianapolis and Oklahoma City, smaller towns, or exurban edge cities like Aurora, Illinois. Old, dense cities like Chicago and Baltimore continue to lose population. And suburban growth continues, especially in exurban areas further flung from the central city.
Of course, there will be exceptions to this (Washington D.C., for sure, likely New York City, too) - but it is a trend we should continue to watch.
Of course, there will be exceptions to this (Washington D.C., for sure, likely New York City, too) - but it is a trend we should continue to watch.
Title: Re: Official US 2010 Census Results
Post by: Verily on February 16, 2011, 12:30:04 AM
The data released so far doesn't match the sometimes trumpeted theme that people are moving away from the suburbs back into the cities. Many of the cities we've seen that have grown thus far are those that include areas that very suburban to begin with, like Indianapolis and Oklahoma City, smaller towns, or exurban edge cities like Aurora, Illinois. Old, dense cities like Chicago and Baltimore continue to lose population. And suburban growth continues, especially in exurban areas further flung from the central city.
Of course, there will be exceptions to this (Washington D.C., for sure, likely New York City, too) - but it is a trend we should continue to watch.
Of course, there will be exceptions to this (Washington D.C., for sure, likely New York City, too) - but it is a trend we should continue to watch.
The problem with this assumption was always that the trend is limited to a fairly small area of cities, the yuppie urban core. In DC and New York, that area is quite large, but most elsewhere (save the West Coast cities) it is still fairly small. Somewhere like Chicago, the yuppie core probably did see a lot of growth, but it was offset by continued black middle class migration to the suburbs and dying off of the elderly working class whites. (Both of those are mitigated somewhat by Hispanic and Asian immigration, but those tend to be a little bit slower than the factors causing decline. Not always, though.)
Still, a few cities really turned it around this cycle. Newark saw population growth (even while Essex County as a whole declined).
Title: Re: Official US 2010 Census Results
Post by: jimrtex on February 16, 2011, 11:43:50 AM
Self-redesignation as American Indian continues apace in Oklahoma, I see. (One will have to wait until the release of the individual tribes count in a couple of years to see if there's also a population explosion among the more genuinely Indian population.)
It appears that you need 2005-9 to get a complete picture.
2007-9 for selected states: WA to TX + CO + OK + MO + WI + FL
2009: CA and TX
Title: Re: Official US 2010 Census Results
Post by: Linus Van Pelt on February 16, 2011, 12:02:03 PM
Just to add on to Verily and Cinyc's comments, another issue is that areas can often decrease in population when they become gentrified and "hip". The reason is that upper-middle class people, especially those without kids who predominate in such areas, use more square feet per person than low-income people, especially minority families. If a bunch of minority families with kids are leaving an area while childless professionals who like to take up their own apartment or live just with one or two roommates are entering, the number of people per existing residential unit will likely decline. But the fluffier sections of the newspaper will include a lot of articles suggesting that "people" are moving in to the area because the journalists and intended readers know more of the people moving in than out, and it intuitively seems to the new middle class residents that they're living densely, because they are, in fact, living more densely than the white suburbanites they compare themselves to.
This can be offset sometimes if the total number of occupied residential spaces is increasing, either because there was a lot of vacant blight to start with, or because industrial spaces are converted into condos.
We'll have to see when the block results come out, but I suspect we'll find certain areas where this process is at its strongest, like the border areas between white brownstone Brooklyn and Bed Stuy/Crown Heights or the areas moving from Hispanic to liberal middle-class white in northwest Chicago, are either shrinking or at least increasing much less quickly than one might think.
Title: Re: Official US 2010 Census Results
Post by: danny on February 16, 2011, 02:52:45 PM
You can see how in Chicago the population changed in this map (http://www.chicagotribune.com/news/local/ct-met-0216-census-gfx.eps-20110215,0,7750399.graphic).
Basically central Chicago grew while most of the rest lost population.
Basically central Chicago grew while most of the rest lost population.
Title: Re: Official US 2010 Census Results
Post by: Brittain33 on February 16, 2011, 02:56:26 PM
I'm thinking of all the careful effort people put into drawing three 50% African-American districts for IL-1, IL-2, and IL-7, and how that didn't survive contact with real data.
Title: Re: Official US 2010 Census Results
Post by: bgwah on February 16, 2011, 03:20:38 PM
Vermont's black population grew 105%? Interesting...
Title: Re: Official US 2010 Census Results
Post by: ag on February 16, 2011, 03:58:48 PM
SD is out. Black population is up by 117%, but it is still only 1.3% :)))) Hispanics also more than doubled - about 2.7% now and American Indian is up15.3% to 8.8%. Whites only up 4.5% but still it is quite white out there.
Title: Re: Official US 2010 Census Results
Post by: minionofmidas on February 16, 2011, 04:10:27 PM
Populations of Shannon and Todd didn't rise all that much. Mind you, grow they did. Most rural white counties' populations fell. Some of the smaller rez counties too - Buffalo, Corson, Dewey. Dewey fell by more than 10 while Ziebach grew by as much - what's going on here, intrarez urbanization? (Estimates say that's happening in Navajoland, hence my guess.)
Native share of Rapid City was 10% in 2000 IIRC, over 12 now.
Native share of Rapid City was 10% in 2000 IIRC, over 12 now.
Title: Re: Official US 2010 Census Results
Post by: Verily on February 16, 2011, 04:25:10 PM
You can see how in Chicago the population changed in this map (http://www.chicagotribune.com/news/local/ct-met-0216-census-gfx.eps-20110215,0,7750399.graphic).
Basically central Chicago grew while most of the rest lost population.
Basically central Chicago grew while most of the rest lost population.
Pretty much exactly what I predicted, then. Except that Hispanic growth seems to have halted (and that seems to be the main difference in terms of trends from 2000); I wonder why that is? Anyone from the Chicago area know?
Title: Re: Official US 2010 Census Results
Post by: Torie on February 16, 2011, 04:57:55 PM
Two or three precincts in downtown LA must have gone through the roof, as office buildings were converted into housing, or new housing towers built, in a rather massive way. I suspect we are talking about say 15,000 new residents here, at the cost of next to zero being displaced. And I bet about 70%-80% of them are Asian. :)
Title: Re: Official US 2010 Census Results
Post by: muon2 on February 16, 2011, 05:01:33 PM
So I take a look at the data for Illinois released today:
Big shocker: Non Hispanic population -.8%
Hispanic population +32.5%
If it weren't for Hispanics, our state's population wuold have been sunk.
Ill Ind
Big shocker: Non Hispanic population -.8%
Hispanic population +32.5%
If it weren't for Hispanics, our state's population wuold have been sunk.
Ill Ind
Yes. Illinois' non-Hispanic white (-3%) and black (-1.3%) population both fell. Asians and Hispanics grew.
Chicago shrunk by almost 7%, at just under 2.7 million. That's about 150,000 less than 2.85 million 2009 census estimate. If Houston's population has been grossly understimated, the Second City might be our fourth largest... but I doubt it.
Far west suburban Aurora (+38%) is now the second largest city in the state, passing Rockford (+2%). Far southwest suburban Joliet (+39%) rocketed from seventh to fourth. Naperville's population was up by 10.5% - but fell from fourth to fifth.
Like Chicago, Cook County lost population (-3.4%). DuPage tread water (+1.4%). The far-out Chicago suburban collar counties grew the most, particularly Kendall (+110%), Will (+35%), Kane (+27%) and McHenry (+19%).
Without Chicago, Cook gained about 18K in population.
It looks like the Hispanic growth was enough to have IL not lose a 2nd CD this decade.
Title: Re: Official US 2010 Census Results
Post by: cinyc on February 16, 2011, 06:10:54 PM
Populations of Shannon and Todd didn't rise all that much. Mind you, grow they did. Most rural white counties' populations fell. Some of the smaller rez counties too - Buffalo, Corson, Dewey. Dewey fell by more than 10 while Ziebach grew by as much - what's going on here, intrarez urbanization? (Estimates say that's happening in Navajoland, hence my guess.)
Native share of Rapid City was 10% in 2000 IIRC, over 12 now.
Native share of Rapid City was 10% in 2000 IIRC, over 12 now.
Ziebach County and urbanization aren't two words that I'd expect in the same sentence. It's simply not that large. The county's population population grew from 2,519 to 2,899 That's 380 new residents - fewer people than live in a large NYC apartment building.
We'd have to look at the tract level data to figure out what happened. Perhaps there was some spillover from Eagle Butte, which is on the border between the two counties of Cheyenne River Indian Agency Reservation, but largely in Dewey.
Title: Re: Official US 2010 Census Results
Post by: cinyc on February 16, 2011, 06:18:34 PM
You can see how in Chicago the population changed in this map (http://www.chicagotribune.com/news/local/ct-met-0216-census-gfx.eps-20110215,0,7750399.graphic).
Basically central Chicago grew while most of the rest lost population.
Basically central Chicago grew while most of the rest lost population.
Areas near the Loop up to about Lincoln Park grew, as did some census tracts on the Far northwest side, near O'Hare, and southwest side near Midway. Everything else lost population, as did the near South suburbs.
Otherwise, Cook County's growth is largely at the far fringes, especially in far Southwest areas. That makes sense, since that's where some of the county's last available empty tracts were during the past decade.
Title: Re: Official US 2010 Census Results
Post by: bgwah on February 17, 2011, 02:01:14 AM
So Chicago lost 17% of its black population? Wow. But statewide the decline was only 1%? Hmm, what suburbs did they move to? Looks like ~60,000 moved to suburban Cook, with Will County being the runner-up at a net gain of ~23k...
Title: Re: Official US 2010 Census Results
Post by: Torie on February 17, 2011, 10:53:58 AM
So Chicago lost 17% of its black population? Wow. But statewide the decline was only 1%? Hmm, what suburbs did they move to? Looks like ~60,000 moved to suburban Cook, with Will County being the runner-up at a net gain of ~23k...
Wow, indeed. Just wow. What that suggests to me is that there has been considerable upward mobility in the black population in the last 10 years in Chicagoland. Am I wrong? Or are inner city neighborhoods being gentrified, and the blacks pushed to undesirable suburbs, or back to the South? Or both? As to the back to the South thing, there is this tendency for when Hispanics move in, the lower SES blacks move out. More should be written about that. But what happens when Hispanics are everywhere doing the grunt work?
By the way, how many Mexican restaurants did Chicago have when I arrived there in 1969 as a Freshman? Yes you guessed it - one, way up on the northside just south of the Evanston border. Now Chicago has how many Mexicans? 700,000 or something?
Title: Re: Official US 2010 Census Results
Post by: Nhoj on February 17, 2011, 03:07:39 PM
Texas data is out.
Title: Re: Official US 2010 Census Results
Post by: danny on February 17, 2011, 03:31:40 PM
Non Hispanic whites went from 52.4% to 45.3% while Hispanics went from 32% to 37.6%, if these trends continue then by the next census Texas will be Hispanic plurality.
Title: Re: Official US 2010 Census Results
Post by: Storebought on February 17, 2011, 03:56:15 PM
Houston population, 2009 Census Estimate: 2,257,926
Houston population, 2010 Census Result: 2,099,451
%Difference: 7.5
Dallas population, 2009 Census Estimate: 1,299,543
Dallas population, 2010 Census Result: 1,197,816
%Difference: 8.5
These are massive overestimates.
Houston population, 2010 Census Result: 2,099,451
%Difference: 7.5
Dallas population, 2009 Census Estimate: 1,299,543
Dallas population, 2010 Census Result: 1,197,816
%Difference: 8.5
These are massive overestimates.
Title: Re: Official US 2010 Census Results
Post by: bgwah on February 17, 2011, 04:04:06 PM
So Chicago lost 17% of its black population? Wow. But statewide the decline was only 1%? Hmm, what suburbs did they move to? Looks like ~60,000 moved to suburban Cook, with Will County being the runner-up at a net gain of ~23k...
Wow, indeed. Just wow. What that suggests to me is that there has been considerable upward mobility in the black population in the last 10 years in Chicagoland. Am I wrong? Or are inner city neighborhoods being gentrified, and the blacks pushed to undesirable suburbs, or back to the South? Or both? As to the back to the South thing, there is this tendency for when Hispanics move in, the lower SES blacks move out. More should be written about that. But what happens when Hispanics are everywhere doing the grunt work?
By the way, how many Mexican restaurants did Chicago have when I arrived there in 1969 as a Freshman? Yes you guessed it - one, way up on the northside just south of the Evanston border. Now Chicago has how many Mexicans? 700,000 or something?
Chicago demolished a ton of its public housing---50,000 units or something---so that probably played a large role in this... Still, 17% is hard to comprehend. Maybe Muon2 will give us an answer! :P
Title: Re: Official US 2010 Census Results
Post by: jimrtex on February 17, 2011, 04:12:55 PM
Texas data is out.
The Houston city charter has a provision to increase the number of district members from 9 to 11 if the population exceeds 2,100,000. This was put in place as a sort of a compromise when district elections were imposed in response to the VRA.
A couple of years ago Houston was sued to have the two additional districts created, but the city argued that there was not accurate enough data to draw district boundaries.
But the census determined that the trigger was not reached (by 549 persons, or 0.026%).
There is also a trigger related to composition of the Metro (mass transit) board. Currently the mayor appoints 5 of the 9 members, and has effective control of Metro. But the trigger would switch control to members appointed by county commissioners and city councils of smaller cities.
Title: Re: Official US 2010 Census Results
Post by: jimrtex on February 17, 2011, 04:14:52 PM
Next week are:
Alabama
Colorado
Hawaii
Missouri
Nevada
Oregon
Utah
Washington
Alabama
Colorado
Hawaii
Missouri
Nevada
Oregon
Utah
Washington
Title: Re: Official US 2010 Census Results
Post by: RI on February 17, 2011, 04:16:11 PM
Next week are:
Washington
Washington
Hooray! ;D
Title: Re: Official US 2010 Census Results
Post by: Nhoj on February 17, 2011, 04:47:40 PM
Texas data is out.
The Houston city charter has a provision to increase the number of district members from 9 to 11 if the population exceeds 2,100,000. This was put in place as a sort of a compromise when district elections were imposed in response to the VRA.
A couple of years ago Houston was sued to have the two additional districts created, but the city argued that there was not accurate enough data to draw district boundaries.
But the census determined that the trigger was not reached (by 549 persons, or 0.026%).
There is also a trigger related to composition of the Metro (mass transit) board. Currently the mayor appoints 5 of the 9 members, and has effective control of Metro. But the trigger would switch control to members appointed by county commissioners and city councils of smaller cities.
Looks like a big western dump of states next week which should be good. Though I of course want see Wisconsin.
Title: Re: Official US 2010 Census Results
Post by: bgwah on February 17, 2011, 05:42:25 PM
Next week are:
Washington
Washington
Hooray! ;D
I'm so excited!
Title: Re: Official US 2010 Census Results
Post by: ill ind on February 17, 2011, 05:53:38 PM
Chicago demolished a ton of its public housing---50,000 units or something---so that probably played a large role in this... Still, 17% is hard to comprehend. Maybe Muon2 will give us an answer
Chicago esentially demolished all of its high-rise public housing. Some low-rise row house type remains, although alot of that has been or is being demolished as well.
The residents are given vouchers to use wherever they want--places that will take them anyways. Yes, a portion of the public housing population has left Chicago for the suburbs including the one in which I reside.
Ill_Ind
Title: Re: Official US 2010 Census Results
Post by: minionofmidas on February 17, 2011, 06:05:50 PM
So, where in Texas was underestimated?
Title: Re: Official US 2010 Census Results
Post by: Landslide Lyndon on February 18, 2011, 01:51:20 AM
Non Hispanic whites went from 52.4% to 45.3% while Hispanics went from 32% to 37.6%, if these trends continue then by the next census Texas will be Hispanic plurality.
Is this going to make Republican gerrymandering harder or it won't have much of an effect overall?
Title: Re: Official US 2010 Census Results
Post by: cinyc on February 18, 2011, 02:20:26 AM
So, where in Texas was underestimated?
Of the 20 largest cities, Houston, San Antonio, Dallas, Arlington, Plano, Brownsville and McAllen were all overestimated. Dallas' population was the most overestimated, followed by Houston and Plano. Brownsville and McAllen were the least overestimated, by under 2%.
The populations of Austin, Fort Worth, El Paso, Corpus Christi, Laredo, Lubbock, Garland, Irving, Amarillo, Grand Prairie, Pasadena, Mesquite and McKinney were underestimated: Grand Prairie was underestimated the most at about 7% (with a different fraction, depending on whether you use the estimate or actual numbers as the denominator when determining the difference), Corpus Christi the next at about 6%, followed by Irving at about 5%. Austin and Amarillo were the least underestimated, by under 1%.
Of the top 20 counties, only Dallas (3%), Collin (1%) and Travis (0.2%) were overestimated in 2009. The population of the other 17 counties was underestimated, some counties greatly so. Bell County's population (Temple/Killeen) was underestimated by 8%, El Paso's by about 6%, and Nueces (Corpus Christi) and Fort Bend (SW of Houston) counties by about 5%. Denton (N of DFW) and Harris (Houston) counties were the least underestimated, at less than 1%. The state's population was underestimated by about 1.5% - but since the last estimate I've found was as on July 1, 2009, some of that change was likely due to pure population growth since the estimate.
Texas is one state where the non-Hispanic White population increased, albeit about five times slower than the state's population as a whole. - 4.2% versus 20.6%.
Title: Re: Official US 2010 Census Results
Post by: Brittain33 on February 18, 2011, 09:57:24 AM
El Paso's by about 6%,
That's an additional 40,000 or 50,000 voters going into the new TX-23 then, right?
Title: Re: Official US 2010 Census Results
Post by: dpmapper on February 18, 2011, 10:45:29 AM
El Paso's by about 6%,
That's an additional 40,000 or 50,000 voters going into the new TX-23 then, right?
There's no law saying that TX-23 has to stretch to El Paso. If I were the TX GOP I'd append the far western part of TX-23 to the Midland district (assuming they're not trying to make that one a majority-minority district as well).
Title: Re: Official US 2010 Census Results
Post by: Sam Spade on February 18, 2011, 10:57:13 AM
Non Hispanic whites went from 52.4% to 45.3% while Hispanics went from 32% to 37.6%, if these trends continue then by the next census Texas will be Hispanic plurality.
Is this going to make Republican gerrymandering harder or it won't have much of an effect overall?
Are you talking about now, or in the future? It might actually make things easier now, but you need to see how the numbers hit. As for the future, well, you're guess is as good as mine. The numbers kind of speak for themselves.
Title: Re: Official US 2010 Census Results
Post by: cinyc on February 18, 2011, 01:00:39 PM
El Paso's by about 6%,
That's an additional 40,000 or 50,000 voters going into the new TX-23 then, right?
That's about 40,000-50,000 additional El Paso County residents compared to the 2009 estimates, not necessarily that many voters. I'd give you an exact figure, but I foolishly didn't save my worksheet. In which congressional district(s) those residents end up is still and open question.
Some West and North Texas counties shrunk. Loving actually grew. It now has a whopping 82 residents.
Title: Re: Official US 2010 Census Results
Post by: Brittain33 on February 18, 2011, 01:22:17 PM
That's about 40,000-50,000 additional El Paso County residents compared to the 2009 estimates, not necessarily that many voters.
Right. Dumbass mistake.
Title: Re: Official US 2010 Census Results
Post by: Landslide Lyndon on February 18, 2011, 03:45:40 PM
Non Hispanic whites went from 52.4% to 45.3% while Hispanics went from 32% to 37.6%, if these trends continue then by the next census Texas will be Hispanic plurality.
Is this going to make Republican gerrymandering harder or it won't have much of an effect overall?
Are you talking about now, or in the future? It might actually make things easier now, but you need to see how the numbers hit. As for the future, well, you're guess is as good as mine. The numbers kind of speak for themselves.
For now of course, nobody knows what happens in ten years.
Also, not that Texas has become a minority-majority state, does that mean that the DOJ can ask that almost half of its districts be VRA?
Title: Re: Official US 2010 Census Results
Post by: Sam Spade on February 18, 2011, 04:16:21 PM
Non Hispanic whites went from 52.4% to 45.3% while Hispanics went from 32% to 37.6%, if these trends continue then by the next census Texas will be Hispanic plurality.
Is this going to make Republican gerrymandering harder or it won't have much of an effect overall?
Are you talking about now, or in the future? It might actually make things easier now, but you need to see how the numbers hit. As for the future, well, you're guess is as good as mine. The numbers kind of speak for themselves.
For now of course, nobody knows what happens in ten years.
Also, not that Texas has become a minority-majority state, does that mean that the DOJ can ask that almost half of its districts be VRA?
Well, first consider that VAP (not total population) is 49.6% white, 33.6% Hispanic. Then you've got to rebalance using actual citizen VAP, which will be even less Hispanic. Under LULAC, it's either going to be VAP or citizen VAP (though I suspect it's citizen VAP) for permissible minority-majority CDs.
If it's citizen VAP (and probably even if it's VAP), then consider that you're going to need at least 60%-65% of baseline Hispanics (not VAP or citizen VAP) in a CD to get Hispanic minority-majority VAP or citizen VAP. There's only so many districts I can draw that will reach that number because the Hispanic population is pretty spread out (too many 20%-30% Hispanic voting districts, especially in the 'burbs) outside of the inner city core, which will be required to maintain certain CDs - for example Gene Green's CD is tough to get that much higher than 70% - inclusion of even a trivial amount of whiter suburbs creates problems. Also, keep in mind LULAC can be used as a sword too to prevent requiring ridiculous looking strip districts, as the Austin to border CD was no good to create a Hispanic CD.
You draw the districts under 60% Hispanic - the Supreme Court will yell at you for impermissible dilution and you'll get bad results, the Republicans will win far more often than you want them to, especially if there's no blacks or its not an inner city core or Austin, they'll almost always win. Another structural problem with creating good Hispanic Democratic districts, which connects to this, is that too many blacks are locked up in east Texas where they're f-cked and you can't get to them.
The fact is that 3 more Hispanic CDs may well be required than 2000, but I suspect it won't be any more, unless patterns are changed from what I was seeing. And apart from the Dallas CD, the GOP will attempt to use Doggett and Green for the other two, if need be. I need to see what the voting districts look like and draw a few maps. The voting districts won't be changed much except to split or combine, so it's very useful.
Title: Re: Official US 2010 Census Results
Post by: minionofmidas on February 20, 2011, 12:09:02 PM
I made myself a little excel table of Native population change in South Dakota. :)
Title: Re: Official US 2010 Census Results
Post by: muon2 on February 20, 2011, 02:32:07 PM
Non Hispanic whites went from 52.4% to 45.3% while Hispanics went from 32% to 37.6%, if these trends continue then by the next census Texas will be Hispanic plurality.
Is this going to make Republican gerrymandering harder or it won't have much of an effect overall?
Are you talking about now, or in the future? It might actually make things easier now, but you need to see how the numbers hit. As for the future, well, you're guess is as good as mine. The numbers kind of speak for themselves.
For now of course, nobody knows what happens in ten years.
Also, not that Texas has become a minority-majority state, does that mean that the DOJ can ask that almost half of its districts be VRA?
Well, first consider that VAP (not total population) is 49.6% white, 33.6% Hispanic. Then you've got to rebalance using actual citizen VAP, which will be even less Hispanic. Under LULAC, it's either going to be VAP or citizen VAP (though I suspect it's citizen VAP) for permissible minority-majority CDs.
If it's citizen VAP (and probably even if it's VAP), then consider that you're going to need at least 60%-65% of baseline Hispanics (not VAP or citizen VAP) in a CD to get Hispanic minority-majority VAP or citizen VAP. There's only so many districts I can draw that will reach that number because the Hispanic population is pretty spread out (too many 20%-30% Hispanic voting districts, especially in the 'burbs) outside of the inner city core, which will be required to maintain certain CDs - for example Gene Green's CD is tough to get that much higher than 70% - inclusion of even a trivial amount of whiter suburbs creates problems. Also, keep in mind LULAC can be used as a sword too to prevent requiring ridiculous looking strip districts, as the Austin to border CD was no good to create a Hispanic CD.
You draw the districts under 60% Hispanic - the Supreme Court will yell at you for impermissible dilution and you'll get bad results, the Republicans will win far more often than you want them to, especially if there's no blacks or its not an inner city core or Austin, they'll almost always win. Another structural problem with creating good Hispanic Democratic districts, which connects to this, is that too many blacks are locked up in east Texas where they're f-cked and you can't get to them.
The fact is that 3 more Hispanic CDs may well be required than 2000, but I suspect it won't be any more, unless patterns are changed from what I was seeing. And apart from the Dallas CD, the GOP will attempt to use Doggett and Green for the other two, if need be. I need to see what the voting districts look like and draw a few maps. The voting districts won't be changed much except to split or combine, so it's very useful.
The standards for Hispanic districts will probably make up some of the key redistricting cases in this decade. One part is the VAP versus CVAP problem you alluded to. The 5th circuit used CVAP in LULAC, but the SCOTUS avoided the question and decided the case on other grounds. In Bartlett the SCOTUS noted the issue of CVAP, but again avoided the question since it was less relevant for a Black population and they could decide the case without going into CVAP. CVAP will be further complicated since the 2000-cycle of cases had citizenship on the census long form, but it is absent on the short-form only 2010 census. The statistics from the ACS are all that's available and they are much weaker statistically than the long-form numbers from 2000.
In the 7th circuit there was a rejection of plaintiff's claims for a 65% standard for Hispanic districts to account for citizenship in Gonzales v Aurora. They didn't have Bartlett yet and the case wasn't taken to the SCOTUS. There is also the question of whether it is required to create 50%+ VAP Hispanic districts where a CVAP majority isn't possible.
A second issue that will arise is the conflict between Black and Hispanic districts. SCOTUS opinions have been about the minority group's voting rights compared to the White majority. Bartlett makes clear that the only protected section 2 groups are single race majorities. There is no guidance to resolve a situation where either a Black-majority or Hispanic-majority district can be drawn, but not both.
This will be an interesting cycle for redistricting cases. :)
Title: Re: Official US 2010 Census Results
Post by: Sam Spade on February 20, 2011, 03:09:10 PM
muon2, in the suburban/urban areas of Houston, DFW and San Antonio, in order to draw more 50% Hispanic VAP CDs, you'll have to dilute the inner Hispanic urban core, as the suburbs are filled with far too many 10%-30% Hispanic VTD. Even then, I'll be lucky to get 2, maybe 3 more CDs. And no one's gonna like that, as you'll marginalize the present Dem CDs and the new ones.
Title: Re: Official US 2010 Census Results
Post by: minionofmidas on February 20, 2011, 03:18:57 PM
I fully expect a doctrine to emerge that fake Hispanic Republican districts like Sam and Kraven have been drawing for Texas (districts that meet a certain threshold for Hispanic percentage but still can be depended on to vote for their Whites' choice, thanks partly to turnout and citizenship differentials, thanks partly to the fact that Hispanics in some parts of the nation, mostly in Texas, are closer to a fifty-fifty split than Whites) are just as unprotected as fake Coalition districts (where you're adding a White Republican-leaning area and some nearby minority areas, and the result votes Democratic and is plurality White, and a White Democrat wins as a result).
Or rather, the court's will to (quite rightly) consider these things frivolous has evidently emerged already, what's lacking yet is clear legal language.
Or rather, the court's will to (quite rightly) consider these things frivolous has evidently emerged already, what's lacking yet is clear legal language.
Title: Re: Official US 2010 Census Results
Post by: cinyc on February 20, 2011, 11:30:45 PM
I made myself a little excel table of Native population change in South Dakota. :)
And? Anything stick out other than the Ziebach County anomoly? Pennington County?
Title: Re: Official US 2010 Census Results
Post by: muon2 on February 20, 2011, 11:52:18 PM
muon2, in the suburban/urban areas of Houston, DFW and San Antonio, in order to draw more 50% Hispanic VAP CDs, you'll have to dilute the inner Hispanic urban core, as the suburbs are filled with far too many 10%-30% Hispanic VTD. Even then, I'll be lucky to get 2, maybe 3 more CDs. And no one's gonna like that, as you'll marginalize the present Dem CDs and the new ones.
Sam, I think that the best plan is first to look at how districts perform at electing candidates of choice, probably by regression analysis of voting patterns. However, once suitably performing districts are drawn then, if there is not a roughly proportional number of districts for the minority, additional majority minority districts would be drawn where possible. That would eliminate the dilution problem in the urban core, yet still provide some level of VRA protection for additional population so that the remainder is not easily cracked.
Title: Re: Official US 2010 Census Results
Post by: Sam Spade on February 21, 2011, 12:45:39 AM
muon2, in the suburban/urban areas of Houston, DFW and San Antonio, in order to draw more 50% Hispanic VAP CDs, you'll have to dilute the inner Hispanic urban core, as the suburbs are filled with far too many 10%-30% Hispanic VTD. Even then, I'll be lucky to get 2, maybe 3 more CDs. And no one's gonna like that, as you'll marginalize the present Dem CDs and the new ones.
Sam, I think that the best plan is first to look at how districts perform at electing candidates of choice, probably by regression analysis of voting patterns. However, once suitably performing districts are drawn then, if there is not a roughly proportional number of districts for the minority, additional majority minority districts would be drawn where possible. That would eliminate the dilution problem in the urban core, yet still provide some level of VRA protection for additional population so that the remainder is not easily cracked.
And I'm just telling you that you're going to end up coming to my conclusion. You almost don't need regression analysis when you know most of these areas personally. :) But let me extrapolate.
By my maths, by VAP numbers, it says that we should aim for 12/36 Hispanic majority-minority (50%) CDs under the VRA (33.6% VAP/36 CDs). Now, the CDs in El Paso and along the border/South Texas are just going to have more than 50% VAP by their nature, and, furthermore, you're going to require more like 55% VAP (and maybe more) to ensure in these areas that they don't vote the "wrong way" all the time (they still may anyway, if present trends continue, which is, of course, a giant if), so there's going to be some slippage based on this factor alone which is probably worth at least one CD, maybe two.
Meanwhile, in the cities I mentioned, as I'm sure you realize - in Houston, it's going to be hard enough to draw two majority-minority Hispanic CDs. But maybe the DOJ forces it on them - Al Green won't be happy, but that's his problem. I don't really see how you do more, because all of the rest of the big Hispanic numbers (i.e. over 40%) are locked within blacks, or impossible to get without diluting blacks (I know the f-ing geography too well) or are, surprise, surprise, voting Republican, less than the other areas, but enough to cause dilution problems.
In DFW, one Hispanic district will be drawn, and can be, but I don't see how you do another. Just look and see how many 20%-30% Hispanic VTDs there are in the DFW area and how impossible they are to unlock without screwing up other places.
In Austin, no one's ever figured out how to unlock the Hispanics, and there's really only one answer - combine them with the other half of San Antonio Hispanics, but I already proposed that as something that may well be done. The liberal whites will get screwed then, but they already are. I would try to combine the other half of San Antonio Hispanics with somewhere, but I then just get another marginal Hispanic majority CD. Ugh.
So that leaves us with 9 majority-minority CDs, one lost because of normal population inequalities and the Hispanic undervote, and at least two others lost because of the damn spread out nature of the Texas Hispanic population (do I need to mention how many Hispanics are lost in west Texas - they don't really vote the right way, so no one cares that much - and I tried unlocking them but Lewis told me it was illegal... :().
Maybe you can figure out a way to create an Austin Hispanic majority-minority CD without attaching it to San Antonio - that's about the only other way I can think of to get another minority-majority CD, but the surrounding areas are simply not that favorable to the task - I'll reexamine Williamson and Hays when the new numbers come out.
Title: Re: Official US 2010 Census Results
Post by: minionofmidas on February 21, 2011, 07:45:49 AM
I made myself a little excel table of Native population change in South Dakota. :)
And? Anything stick out other than the Ziebach County anomoly? Pennington County?
Aw hell, here's the table. Despite excel always looking terrible on the forum. All counties with Native (only) population over 5% or over 500 in 2010 listed.
County 2010 pop 2010 native 2010 share 2000 pop 2000 native 2000 share pop change native ch non change
Bennett 3431 2072 60,39% 3574 1826 51,09% -4,00% 13,47% -22,25% borders Pine Ridge & Rosebud
Bon Homme 7070 494 6,99% 7260 214 2,95% -2,62% 130,84% -6,67% borders Yankton
Brown 36531 1078 2,95% 35460 954 2,69% 3,02% 13,00% 2,74% Aberdeen
Brule 5255 425 8,09% 5364 436 8,13% -2,03% -2,52% -1,99% borders Crow Creek
Buffalo 1912 1575 82,37% 2032 1640 80,71% -5,91% -3,96% -14,03% includes bulk of Crow Creek
Charles Mix 9128 2830 31,00% 9350 2561 27,39% -2,37% 10,50% -7,23% includes Yankton
Codington 27227 512 1,88% 25897 361 1,39% 5,14% 41,83% 4,62% small portion of Lake Traverse
Corson 4050 2635 65,06% 4181 2471 59,10% -3,13% 6,64% -17,25% SD portion of Standing Rock
Day 5710 535 9,37% 6267 456 7,28% -8,89% 17,32% -10,94% includes part of Lake Traverse
Dewey 5301 3914 73,84% 5972 4390 73,51% -11,24% -10,84% -12,33% part of Cheyenne River
Fall River 7094 474 6,68% 7453 448 6,01% -4,82% 5,80% -5,50% Black Hills
Gregory 4271 312 7,31% 4792 267 5,57% -10,87% 16,85% -12,51% borders Rosebud
Hughes 17022 1728 10,15% 16481 1398 8,48% 3,28% 23,61% 1,40% Pierre, part of Crow Creek
Hyde 1420 113 7,96% 1671 129 7,72% -15,02% -12,40% -15,24% part of Crow Creek
Jackson 3031 1547 51,04% 2930 1398 47,71% 3,45% 10,66% -3,13% includes part of Pine Ridge
Lyman 3755 1420 37,82% 3895 1292 33,17% -3,59% 9,91% -10,30% includes most of Lower Brule
Marshall 4656 343 7,37% 4576 282 6,16% 1,75% 21,63% 0,44% small portion of Lake Traverse
Meade 25434 563 2,21% 24253 475 1,96% 4,87% 18,53% 4,60% borders Cheyenne River
Mellette 2048 1092 53,32% 2083 1068 51,27% -1,68% 2,25% -5,81% borders Rosebud & Pine Ridge
Minnehaha 169468 3933 2,32% 148281 2678 1,81% 14,29% 46,86% 13,69% Sioux Falls
Moody 6486 889 13,71% 6595 778 11,80% -1,65% 14,27% -3,78% includes Flandreau
Pennington 100948 9042 8,96% 88565 6773 7,65% 13,98% 33,50% 12,37% Rapid City
Roberts 10149 3458 34,07% 10016 2956 29,51% 1,33% 16,98% -5,23% includes part of Lake Traverse
Shannon 13586 12784 94,10% 12466 11608 93,12% 8,98% 10,13% -6,53% bulk of Pine Ridge
Stanley 2966 196 6,61% 2772 135 4,87% 7,00% 45,19% 5,04% small portion of Lower Brule, borders Cheyenne River
Todd 9612 8297 86,32% 9050 7642 84,44% 6,21% 8,57% -6,61% Rosebud
Tripp 5644 769 13,63% 6430 691 10,75% -12,22% 11,29% -15,05% borders Rosebud
Walworth 5438 769 14,14% 5974 690 11,55% -8,97% 11,45% -11,64% borders Cheyenne River, Standing Rock
Yankton 22438 537 2,39% 21652 342 1,58% 3,63% 57,02% 2,77% Yankton (city)
Ziebach 2801 2023 72,22% 2519 1801 71,50% 11,19% 12,33% 8,36% part of Cheyenne River
State 814180 69476 8,53% 754844 60988 8,08% 7,86% 13,92% 7,33%
35 counties 290298 3117 1,07% 267033 2828 1,06% 8,71% 10,22% 8,70%
I did a sort-of-similar table for Oklahoma, too.
Title: Re: Official US 2010 Census Results
Post by: muon2 on February 21, 2011, 11:07:21 AM
muon2, in the suburban/urban areas of Houston, DFW and San Antonio, in order to draw more 50% Hispanic VAP CDs, you'll have to dilute the inner Hispanic urban core, as the suburbs are filled with far too many 10%-30% Hispanic VTD. Even then, I'll be lucky to get 2, maybe 3 more CDs. And no one's gonna like that, as you'll marginalize the present Dem CDs and the new ones.
Sam, I think that the best plan is first to look at how districts perform at electing candidates of choice, probably by regression analysis of voting patterns. However, once suitably performing districts are drawn then, if there is not a roughly proportional number of districts for the minority, additional majority minority districts would be drawn where possible. That would eliminate the dilution problem in the urban core, yet still provide some level of VRA protection for additional population so that the remainder is not easily cracked.
And I'm just telling you that you're going to end up coming to my conclusion. You almost don't need regression analysis when you know most of these areas personally. :) But let me extrapolate.
By my maths, by VAP numbers, it says that we should aim for 12/36 Hispanic majority-minority (50%) CDs under the VRA (33.6% VAP/36 CDs). Now, the CDs in El Paso and along the border/South Texas are just going to have more than 50% VAP by their nature, and, furthermore, you're going to require more like 55% VAP (and maybe more) to ensure in these areas that they don't vote the "wrong way" all the time (they still may anyway, if present trends continue, which is, of course, a giant if), so there's going to be some slippage based on this factor alone which is probably worth at least one CD, maybe two.
Meanwhile, in the cities I mentioned, as I'm sure you realize - in Houston, it's going to be hard enough to draw two majority-minority Hispanic CDs. But maybe the DOJ forces it on them - Al Green won't be happy, but that's his problem. I don't really see how you do more, because all of the rest of the big Hispanic numbers (i.e. over 40%) are locked within blacks, or impossible to get without diluting blacks (I know the f-ing geography too well) or are, surprise, surprise, voting Republican, less than the other areas, but enough to cause dilution problems.
In DFW, one Hispanic district will be drawn, and can be, but I don't see how you do another. Just look and see how many 20%-30% Hispanic VTDs there are in the DFW area and how impossible they are to unlock without screwing up other places.
In Austin, no one's ever figured out how to unlock the Hispanics, and there's really only one answer - combine them with the other half of San Antonio Hispanics, but I already proposed that as something that may well be done. The liberal whites will get screwed then, but they already are. I would try to combine the other half of San Antonio Hispanics with somewhere, but I then just get another marginal Hispanic majority CD. Ugh.
So that leaves us with 9 majority-minority CDs, one lost because of normal population inequalities and the Hispanic undervote, and at least two others lost because of the damn spread out nature of the Texas Hispanic population (do I need to mention how many Hispanics are lost in west Texas - they don't really vote the right way, so no one cares that much - and I tried unlocking them but Lewis told me it was illegal... :().
Maybe you can figure out a way to create an Austin Hispanic majority-minority CD without attaching it to San Antonio - that's about the only other way I can think of to get another minority-majority CD, but the surrounding areas are simply not that favorable to the task - I'll reexamine Williamson and Hays when the new numbers come out.
I think we aren't so far apart. I have no doubt that reaching 12 Hispanic CDs in TX is nigh impossible. That's the target, however, and one should make a good effort to reach that without diluting other districts so much that they cease to be opportunities.
For instance, since one is still under the goal one looks at areas like Harris Co for 2 districts rather than one. For the Latinos there it's a matter of having two opportunities, rather than zero or one. I posted that one on the TX thread back in Jan, and your comments suggest that the map may well go that way, especially as it doesn't impact the GOP districts there.
In DFW I agree that there is only one district, precisely because you can't draw two at over 50% VAP. And I too will be curious to see the actual numbers in central TX.
Title: Re: Official US 2010 Census Results
Post by: Sam Spade on February 21, 2011, 11:45:51 AM
I think we aren't so far apart. I have no doubt that reaching 12 Hispanic CDs in TX is nigh impossible. That's the target, however, and one should make a good effort to reach that without diluting other districts so much that they cease to be opportunities.
Unfortunately, the truth is that reaching 11 CDs is nigh impossible too because of the spread out nature of things. Certainly if its CVAP, but almost certainly VAP.
Which leaves us the question of whether 10 is possible - it's only possible if you can draw an Austin-centered Hispanic district while avoiding San Antonio, the new numbers will tell us on that front. Otherwise, you have to draw the Austin-San Antonio district to get enough Hispanics by reaching into the barrio (which means you have to go through non-Hispanic areas) and you're not going to get 10 CDs (the border has not grown fast enough, Corpus Christi lost population!, as I'm sure the south side barrio in Bexar did too). And I'm sure certain people will insist that the present situation should stay intact, as there should be just an Austin-centered district based on some other logic.
On Houston, the Hispanic district will be drawn if it makes sense (and the numbers are there - I think they will be). But expect the blacks to complain to high heaven - knowing the Texas GOP, I would expect them to do things for the Hispanics, but who knows. As I said before, it really doesn't make that much difference to the Republicans, vote-wise.
Lastly, I can tell you that the Hispanics outside the Houston, DFW and Austin metros are going to demand 50% CVAP - otherwise it's too easy to design districts that will vote Republican.
Title: Re: Official US 2010 Census Results
Post by: muon2 on February 21, 2011, 12:20:25 PM
Lastly, I can tell you that the Hispanics outside the Houston, DFW and Austin metros are going to demand 50% CVAP - otherwise it's too easy to design districts that will vote Republican.
In the last round CVAP could be easily surmised from the long form data. That leaves only the ACS which has much less statistical reliability than the long form data. Also, the Census Bureau acknowledges that the 2009 ACS citizenship data doesn't always match up well with the new 2010 census block groups, since it used 2000 geography. The 2010 ACS with the new geography will be out probably late this year, so where does that leave states like TX and IL that have to create maps rather early?
Title: Re: Official US 2010 Census Results
Post by: Torie on February 21, 2011, 12:25:24 PM
With such poor data, I just don't think SCOTUS will sign off on CVAP (I kind of doubt they would even with good data actually). Every map would be litigated to death, over a factual issue, with whore experts on each side. It would be a nightmare. In fact, I would be kind of surprised if a SCOTUS vote tanking CVAP did not secure in excess of five votes.
But, to the extent one can avoid the legal risk, without undue partisan cost, just do it obviously.
CVAP will still be in play however due to the dilution issue, but I suspect the standard will be high to toss a map out because the minority VAP percentage is too high, unless there is clear and convincing evidence that the VAP percentage was pushed up considerably beyond the percentage necessary for the minority to elect a candidate of their choice, and that was animated by partisan - or to bleach out the congressional delegation - motives.
Title: Re: Official US 2010 Census Results
Post by: minionofmidas on February 21, 2011, 12:26:54 PM
So we' ve just uncovered why the Census Bureau implemented the thing in the first place?
Title: Re: Official US 2010 Census Results
Post by: cinyc on February 21, 2011, 02:28:10 PM
Native increases in Yankton and Bon Homme Counties are certainly puzzling.
Aw hell, here's the table. Despite excel always looking terrible on the forum. All counties with Native (only) population over 5% or over 500 in 2010 listed.
Aw hell, here's the table. Despite excel always looking terrible on the forum. All counties with Native (only) population over 5% or over 500 in 2010 listed.
The Yankton and Bon Homme increases could be people moving from and/or marrying and having kids with Native Americans from the Yankton reservation in nearby Charles Mix County. Yankton is the closest larger-sized market town to the reservation, so it makes some sense that rural folks looking for better economic opportunities might move there.
Thanks for the chart.
Title: Re: Official US 2010 Census Results
Post by: jimrtex on February 22, 2011, 02:38:19 AM
Aw hell, here's the table. Despite excel always looking terrible on the forum.
and concat(rept(" ",8-len(b1)),b1) to right justify with leading blanks. Set the values of 20 and 8 based on the column content. Then concat(I1:m1) or whatever to merge all the formatted columns. Then paste that to the forum, and surround with tt tags to get fixed pitch spacing.
Title: Re: Official US 2010 Census Results
Post by: cinyc on February 22, 2011, 05:57:58 PM
Colorado, Hawaii, Oregon and Washington were shipped to state legislators today. They will likely be released to the public tomorrow.
Title: Re: Official US 2010 Census Results
Post by: bgwah on February 23, 2011, 03:19:43 PM
New states are out! :)
Title: Re: Official US 2010 Census Results
Post by: cinyc on February 23, 2011, 03:33:45 PM
Colorado, Oregon and Washington were just released.
El Paso County (Colorado Springs) is now the largest county in Colorado, surpassing Denver County and Jefferson Counties. Jefferson County grew by an anemic 1.4%, and is now in fourth, behind those two and Arapahoe.
Colorado grew by 16.9%, with the non-Hispanic White population growing by 9.9%.
In Oregon, Deschutes County (Bend) was the fastest-growing, at 36.7%. Multnomah County (Portland) grew at about the statewide average (11.3% vs. 12.0%); Portland-suburban Washington County grew faster than that, at 18.9%. Redmond (94%), Grant's Pass (50%), Bend (47%) and Hillsboro (31%) were the fastest-growing cities in the state.
Oregon's non-Hispanic White population grew by 5.2%.
In Washington, Franklin County (Pasco/Tri-Cities) grew the most - by 58.4%, followed by Clark (Portland Suburbs) at 23.2%, Benton (Richland/Kennewick/Tri-Cities) at 23.0%, Mason (north of Olympia) at 22.9% and Thurston (Olympia) at 21.7%. King and Pierce Counties grew slightly less than the state as a whole (11.2 and 13.5% vs. 14.1%).
The city of Seattle grew by 8% - far less rapidly than suburban Seattle areas like Marysville (137%), Renton (82%) and Auburn (78%) or interior cities like Pasco (86%), Kennewick (35%) and Yakima (27%). Spokane (7%) and Tacoma (3%) grew even slower than Seattle.
The non-Hispanic white population grew by 4.8%.
Hawaii hasn't been released yet. It might take an additional day to get in touch with their legislative leaders, given the time difference.
------------------------------------------------------
Note that the fastest growing is of the 20 largest counties ranked by the census bureau.
Only two Washington counties lost population, both on the Oregon border - Pacific and Garfield. Most counties in Eastern Oregon lost population, save a few on the Columbia River. In Colorado, most counties bordering Kansas lost population, as did a few bordering New Mexico and Wyoming, as well as Lake and Clear Creek counties in the Rockies.
Title: Re: Official US 2010 Census Results
Post by: RI on February 23, 2011, 03:47:40 PM
far less rapidly than suburban Seattle areas like Marysville (137%)
I'm sorry, but I find that idea hilarious. :P
Title: Re: Official US 2010 Census Results
Post by: cinyc on February 23, 2011, 03:57:41 PM
far less rapidly than suburban Seattle areas like Marysville (137%)
I'm sorry, but I find that idea hilarious. :P
Which idea is hilarious? Marysville is the fastest-growing city in the state in percentage terms. Granted, its 2000 base population was much lower than most - but even so, it picked up more residents than any city except Seattle and Renton. It jumped from the state's 36th largest city to its 15th.
Snohomish County (17.7%) grew at a faster rate than King, Pierce or the state as a whole.
You can classify a city that is 35 miles away from the metro's main city along its main highway and rail line in one of its major suburban counties as whatever you like - suburban, exurban, suburban Everett or whatever. It's in the Seattle metro.
Title: Re: Official US 2010 Census Results
Post by: RI on February 23, 2011, 04:12:01 PM
far less rapidly than suburban Seattle areas like Marysville (137%)
I'm sorry, but I find that idea hilarious. :P
Which idea is hilarious? Marysville is the fastest-growing city in the state in percentage terms. Granted, its 2000 base population was much lower than most - but even so, it picked up more residents than any city except Seattle and Renton. It jumped from the state's 36th largest city to its 15th.
Snohomish County (17.7%) grew at a faster rate than King, Pierce or the state as a whole.
No, no. I dont doubt you. Ive just lived in or near Marysville (about 15 minutes west of) for most of my life, and my dad used to work for the City of Marysville as their finance director once upon a time, and the notion that Marysville is a Seattle suburb is a strange one to me. If anything, it's a suburb (sorta, it's complicated) of Everett.
Also, on the population growth, a good chunk of that growth in Marysville was from annexations of surrounding suburban areas that were previously unincorporated. It did grow, and quite a bit, dont get me wrong, its just a bit inflated.
Title: Re: Official US 2010 Census Results
Post by: cinyc on February 23, 2011, 04:25:48 PM
far less rapidly than suburban Seattle areas like Marysville (137%)
I'm sorry, but I find that idea hilarious. :P
Which idea is hilarious? Marysville is the fastest-growing city in the state in percentage terms. Granted, its 2000 base population was much lower than most - but even so, it picked up more residents than any city except Seattle and Renton. It jumped from the state's 36th largest city to its 15th.
Snohomish County (17.7%) grew at a faster rate than King, Pierce or the state as a whole.
No, no. I dont doubt you. Ive just lived in or near Marysville (about 15 minutes west of) for most of my life, and my dad used to work for the City of Marysville as their finance director once upon a time, and the notion that Marysville is a Seattle suburb is a strange one to me. If anything, it's a suburb (sorta, it's complicated) of Everett.
Also, on the population growth, a good chunk of that growth in Marysville was from annexations of surrounding suburban areas that were previously unincorporated. It did grow, and quite a bit, dont get me wrong, its just a bit inflated.
Growth due to annexations is one thing that takes further analysis to unravel. The census bureau does not differentiate between growth in the old city area or growth in annexed areas.
It does make sense that Marysville would have seen explosive growth in the past decade, as the Seattle-Tacoma metro area raced up the I-5 corridor. Auburn is another area at the fringes of the highway system where one would have expected to see explosive growth, too.
Title: Re: Official US 2010 Census Results
Post by: cinyc on February 23, 2011, 06:45:04 PM
I think Alabama, Missouri, Nevada and Utah shipped to legislative leaders today. We might get those states plus Hawaii tomorrow afternoon.
Title: Re: Official US 2010 Census Results
Post by: Linus Van Pelt on February 23, 2011, 08:55:16 PM
Question for the northwesterners: why is Deschutes county (Bend, OR) growing so fast?
Title: Re: Official US 2010 Census Results
Post by: RI on February 23, 2011, 09:04:45 PM
Question for the northwesterners: why is Deschutes county (Bend, OR) growing so fast?
I'm not an expert on Bend, but I believe it's a combination of it being the big town near the Mt. Bachelor ski resort area and because it's seen a jump in retirees settling in.
Title: Re: Official US 2010 Census Results
Post by: cinyc on February 23, 2011, 09:55:30 PM
Question for the northwesterners: why is Deschutes county (Bend, OR) growing so fast?
I think you're seeing the same type of thing that partially drove growth in places like Montrose, Grand Junction and Eagle County, Colorado. Bend is an outdoorsy lifestyle town that attracts both retirees and outdoor enthusiasts. Tourism is its number one industry. (Grand Junction also had a bit of an oil and gas play, though).
Also, its 2000 base population isn't as high as someplace like Portland, which makes the percentage growth higher than it would otherwise be. But the city did have the second-highest population increase after Portland, and the county the third-highest after the two largest Portland-area counties.
Title: Re: Official US 2010 Census Results
Post by: RI on February 23, 2011, 10:46:50 PM
Question for the northwesterners: why is Deschutes county (Bend, OR) growing so fast?
I think you're seeing the same type of thing that partially drove growth in places like Montrose, Grand Junction and Eagle County, Colorado. Bend is an outdoorsy lifestyle town that attracts both retirees and outdoor enthusiasts. Tourism is its number one industry. (Grand Junction also had a bit of an oil and gas play, though).
Also, its 2000 base population isn't as high as someplace like Portland, which makes the percentage growth higher than it would otherwise be. But the city did have the second-highest population increase after Portland, and the county the third-highest after the two largest Portland-area counties.
That's pretty much my interpretation on the matter.
Title: Re: Official US 2010 Census Results
Post by: Brittain33 on February 24, 2011, 08:56:38 AM
I think Bend also experienced growth the same way Las Vegas and Phoenix did--it was a low-cost housing market of a certain size convenient to some wealthy, high-cost housing markets.
Title: Re: Official US 2010 Census Results
Post by: Torie on February 24, 2011, 09:02:03 AM
Bend has a good climate. It's drier. If you want to live east of the Cascades in Oregon, Bend is by far the best game in town as to amenities, and has good airline connections to Portland and SF. My dentist decamped to there. He is deliriously happy so I'm told. He bought a nice little estate on the river, and sold his house at the top of the market in Coto de Caza for about 3 million. That must have made him even happier. :)
Title: Re: Official US 2010 Census Results
Post by: cinyc on February 24, 2011, 01:15:46 PM
I think Bend also experienced growth the same way Las Vegas and Phoenix did--it was a low-cost housing market of a certain size convenient to some wealthy, high-cost housing markets.
Well, Bend had, at one time, one of the most overvalued housing markets in the country, according to Forbes. But home prices were probably still lower than comparable housing in denser West Coast urban areas.
If I were to liken Bend to any southern Mountain West town, it would be St. George, Utah in Utah's Dixie - another town that we're likely to see experienced extremely high growth when Utah's numbers are released this afternoon. It's a desert town a few hours from a major city (Las Vegas) that is near recreational opportunities in the nearby mountains. Retirees flocked there over the past decade, and others followed.
Title: Re: Official US 2010 Census Results
Post by: cinyc on February 24, 2011, 03:26:34 PM
Alabama, Hawaii, Missouri, Nevada and Utah are now out. The highlights, in reverse alphabetical order:
Utah
In Utah, growth was largely in the Salt Lake City area, particularly in the I-15 corridor from Salt Lake City to Provo. The state's fastest-growing cities were Lehi (+149%), Spanish Fork (+71%), South Jordan (+71%), Draper (+67%), Riverton (+55%), West Jordan (+52%) and St. George (+47%), all but the last of which are in that corridor. Salt Lake City proper barely grew (+3%) and suburban Sandy lost population (-1%).
The fastest-growing counties were Wasatch (+55%), on the other side of the mountains for which it is named from Provo (perhaps exurban spillover in the Heber City area - but the population is still under 25k), Washington (+53%), on the state's southwest corner in Utah's dixie, home to the city of St. George, Tooele (+43%), immediately west of Salt Lake County, and Utah (+40%), home of Provo and BYU. Salt Lake County grew slower than the state (14.6% vs. 23.8%), but still picked up more residents than all but Utah County - and more residents than live in all but the top 5 counties.
The state's non-Hispanic white population grew by 16.7%.
Nevada
As expected, the overwhelming majority of Nevada's growth was in Clark County (Las Vegas), which grew faster than the state as a whole (41.8% vs. 35.1%). Only Lyon County, arguably exurban Reno, grew faster at 50.7% - but from a much lower base. And the only other county to grow faster than the state was Nye (35.3%). I suspect much of its growth was in the Pahrump area, arguably exurban Las Vegas. Washoe County (Reno) grew at a respectable 24.1%, and picked up more residents than live in any other county but Clark. Ultra-rural Lander (-0.3%), Mineral (-5.9%) and Esmeralda (-19.1%) counties lost population. Esmeralda's population fell to just 783.
On the city level, the fastest-growers were Fernley in Lyon County (+127%), North Las Vegas (+88%), Mesquite, on I-15 at the Arizona border (+63%), Henderson (+47%) and Sparks, near Reno (+36%). Las Vegas proper grew by 22%, but picked up more residents than any other city. Reno proper grew by 25%, but picked up more residents than any cities but Las Vegas and North Las Vegas. Rural West Wendover (-7%), Lovelock (-5%) and Wells (-4%) lost population. Boulder City barely grew.
The state's non-Hispanic White population grew by 12.2%.
Missouri
St. Louis City (-8.3%) and County (-1.7%) both lost population, while Kansas City (+4.1%) and most other cities gained population. The fastest-growing of the top-20 cities were O'Fallon (+71.8%) in St. Louis' St. Charles County suburbs, Lee's Summit (+29.2%) in the Kansas City suburbs, the college town of Columbia (+28.4%) and Joplin (+10.2%) in the southwest corner of the state. No other of the top 20 cities grew by more than 10%. University City (-5.5%), adjacent to St. Louis, Raytown (-2.8%), adjacent to Kansas City, and Ballwin (-2.8%) in St. Louis County lost population.
On the county level, St. Louis County's population fell below 1,000,000, while neighboring St. Charles County grew by 27%. Other counties with rapid growth include Christian (+43%), south of Springfield, Lincoln (+35%), north of St. Charles, Pulaski (+27%), which includes Fort Leonard Wood, Cass (+21%), Platte (+21%) and Clay (+20%), all in the Kansas City area, plus Boone County (+20%), home of Columbia.
Missouri's non-Hispanic white population grew by 3.5%, half as fast as the state as a whole (7.0%).
Hawaii
The Neighbor Islands grew faster than Oahu (+8.8%), with the big Island of Hawaii leading the way at 24.5%. Maui County was next, growing at a 20.9% clip, followed by Kauai County at 14.8%. Nevertheless, Honolulu County (Oahu) picked up more residents than all the other counties combined. Kalawao County, comprising the former leper colony of Kalaupapa on the island of Molakai, lost 38.8% of its residents and is now down to 90 residents. Loving County, Texas is still smaller, with 82 residents.
Hawaii's census geography is a bit strange because it doesn't have municipalities below the county level, and census designated place borders have changed since 2000, rendering comparisons impossible. Of the CDPs with the same borders in 2000, the Ewa Gentry CDP, presumably on Oahu west of Pearl Harbor, grew by leaps and bounds (359%), as did Pearl City (54%). Kahului and Kihei CDPs on Maui grew 31% and 25%, respectively. Interior Oahu Miilani Town CDP (-3%) and Windward Oahu Kaneohe (-1.1%) lost population.
Hawaii's non-Hispanic white population grew by 11.6%, almost as fast as the state as a whole (12.3%). Hawaii's non-Hispanic African-American population fell by 4.4%, while its non-Hispanic Asian population grew at a relatively slow 3.9%. The non-Hispanic Native Hawaiian and Pacific Islander population grew by 18.2%. Non-Hispanics of two or more races increased by 20.7%, while Hispanics increased by 37.8%.
Alabama
The city of Birmingham lost over 30,000 residents in the past decade, 12.6% of its population. Despite only growing by 2.1%, the state capital of Montgomery ended up only about 6,500 residents away from passing Birmingham as the state's largest city.
Birmingham's loss was its suburbs' gain - Vestavia Hills and Hoover in Jefferson County grew by 39.0% and 30.1%; Alabaster in Shelby County by 34.2%. But gains in suburban Jefferson County were not enough to offset population losses in Birmingham and Bessemer (-7.5%), causing the county as a whole to lose 0.5% of its residents over the past decade.
Other cities with rapid growth include the Huntsville suburb of Madison (+46.4%), the Montgomery suburb of Prattville (+39.7%), Enterprise (+25.4%), near Fort Rucker in the southeast corner of the state, and the college town of Auburn (+24.2%). The cities of Mobile (-1.9%) and Gadsen (-5.4%) both lost population.
On the county level, most counties in Western Alabama lost population. The fastest-growing counties were generally in the Huntsville area, outer areas of the Birmingham metro, and Montgomery suburbs. Shelby County, near Birmingham, led the pack with 36% growth, followed by Baldwin County on the Redneck Riviera across Mobile Bay from Mobile at 29%, Birmingham-area St. Clair County at 29%, Limestone County near Huntsville at 26%, Lee County (Auburn) at 22% Madison County (Huntsville) at 21%, and Elmore County north of Montgomery at 20%. Madison, Shelby and Baldwin gained the most total population.
Alabama's non-Hispanic white population grew by 2.5%, one-third of the state's overall 7.5% growth. The Hispanic population more than doubled (+144.8%). Alabama's non-Hispanic black population grew slightly faster than the overall state population (+8.2%).
Title: Re: Official US 2010 Census Results
Post by: Torie on February 24, 2011, 10:22:46 PM
When I was a kid, St. George, Utah had about 5,000 people. It was a pit stop for folks coming up from LA going on to Salt Lake, Denver or Yellowstone or whatever. I knew the town well. Sleepy little place. My Dad had his booze in the trunk. Now it has quite vast housing tracks, golf courses and the like. It is the climate of course. It is kind of an LDS Palm Springs.
Title: Re: Official US 2010 Census Results
Post by: jimrtex on February 24, 2011, 10:45:12 PM
Surprising is that Salt Lake City could fall by the wayside as a state capital that is also the largest city in its state, while Montgomery could reclaim its claim.
Clark County doesn't quite have enough population for 3 of Nevada's 4 CD. It is 74,000 short. You can either go along the Utah border to Idaho, or take the entire pointed lower pointed part of the state to get enough population. So now the cow counties are not only overwhelmed by Reno and Las Vegas they will be divided up.
Clark County doesn't quite have enough population for 3 of Nevada's 4 CD. It is 74,000 short. You can either go along the Utah border to Idaho, or take the entire pointed lower pointed part of the state to get enough population. So now the cow counties are not only overwhelmed by Reno and Las Vegas they will be divided up.
Title: Re: Official US 2010 Census Results
Post by: cinyc on February 24, 2011, 11:53:41 PM
Delaware, Kansas, Nebraska, North Carolina and Wyoming will be released next week.
Title: Re: Official US 2010 Census Results
Post by: cinyc on February 25, 2011, 12:10:09 AM
Surprising is that Salt Lake City could fall by the wayside as a state capital that is also the largest city in its state, while Montgomery could reclaim its claim.
Salt Lake City's still a long way off from being dethroned as the largest city in Utah. Its population is about 186,500. The next largest city, West Valley City, has about 57,000 fewer residents at about 129,500. If West Valley City continues to grow at the same pace as 2000-2010, it would probably take 3 decades to pass Salt Lake City. Same with fast-growing West Jordan - it's about 2 to 3 decades off from passing SLC, assuming current growth rates, which probably aren't sustainable. Plus, Salt Lake City might have some land to grow out by the airport.
Montgomery, on the other hand...
Clark County doesn't quite have enough population for 3 of Nevada's 4 CD. It is 74,000 short. You can either go along the Utah border to Idaho, or take the entire pointed lower pointed part of the state to get enough population. So now the cow counties are not only overwhelmed by Reno and Las Vegas they will be divided up.
I think you almost have to put Nye with the Clark County district, given it is pretty much exurban Las Vegas now that its population is centered in Pahrump instead of Tonopah. After that, you'd need to find another 30,200 residents - most logically first from Lincoln, Esmeralda and Mineral Counties, and then either going up to White Pine and environs or across to take in southern Lyon and Douglas. I'd probably do the former to keep as much of the Reno/Lake Tahoe/Carson City area together as possible.
Title: Re: Official US 2010 Census Results
Post by: RBH on February 25, 2011, 01:32:03 AM
Large Missouri cities racial break downs (White/Not Hispanic, Black/Not Hispanic, Hispanic)
Kansas City: 59% W/30% B/10% H
St. Louis: 44% W/49% B/3% H
Springfield: 89% W/4% B/4% H
Independence: 86% W/6% B/8% H
Columbia: 79% W/11% B/3% H
Lee's Summit: 86% W/8% B/4% H
O'Fallon: 90% W/4% B/3% H
St. Joseph: 88% W/6% B/6% H
St. Charles: 87% W/6% B/4% H
Blue Springs: 88% W/6% B/5% H
Of 693391 African Americans in Missouri, 294700 live in KC or STL. And the 3rd largest number of African Americans in a Missouri city is University City (14535) but there's 15116 in Spanish Lake CDP.
Southwest City is now majority Hispanic. With 493 Hispanics in a 970 person town. It's on the Missouri/Arkansas/Oklahoma border. Hispanics almost have a majority in Noel, Missouri, which is east of Southwest City. Verona (SW MO, Lawrence County) and Milan (NE MO, Sullivan County) have over 40% Hispanics, while Milan's Hispanic percentage doubling in 10 years. And La Monte is 35.8% Hispanic. I think I know why Milan's Hispanic population is soaring (plants/jobs), and I think the same is true for LaMonte, where the percentage tripled in 10 years.
Would be fun to find the biggest demographic changes from 2000 to 2010 in the US though.
------------------
Also, Springdale, AR has 15332 some other race residents (21%) out of 69797 residents. Up from 11% in 2010. Partially thanks to the Marshallese population? And 5.7% classified themselves as Native Hawaiian/Other Pacific Islander. A lower number of NH/OPI (3976) than the estimate of Marshallese in 2000 (4000). So, there's a strong shot that the Marshalese make up a lot more of the SOR than Hispanic/Latino origin residents.
Arkansas has 5863 NH/OPI residents. With 4128 in Washington County and 671 in Benton County and 3967 in Springdale. So you can do the math there.
Title: Re: Official US 2010 Census Results
Post by: minionofmidas on February 25, 2011, 02:14:35 PM
What's the nonhispanic SOR population.
Amazing. I noticed way back in 2000 that Arkansas' Pacific Islander pop. was elevated compared to what I'd expected, but I never guessed it was all in one place, and that not even Little Rock.
Amazing. I noticed way back in 2000 that Arkansas' Pacific Islander pop. was elevated compared to what I'd expected, but I never guessed it was all in one place, and that not even Little Rock.
Title: Re: Official US 2010 Census Results
Post by: RBH on February 25, 2011, 03:24:57 PM
What's the nonhispanic SOR population.
Amazing. I noticed way back in 2000 that Arkansas' Pacific Islander pop. was elevated compared to what I'd expected, but I never guessed it was all in one place, and that not even Little Rock.
Amazing. I noticed way back in 2000 that Arkansas' Pacific Islander pop. was elevated compared to what I'd expected, but I never guessed it was all in one place, and that not even Little Rock.
SOR in Springdale is 15332 and HLO is 24692. Which seems like a pretty big ratio (most ratios i've seen are 3:1 Hispanic:SOR)
I wish there were a break down for SOR too.
Title: Re: Official US 2010 Census Results
Post by: jimrtex on February 25, 2011, 03:35:10 PM
What's the nonhispanic SOR population.
Amazing. I noticed way back in 2000 that Arkansas' Pacific Islander pop. was elevated compared to what I'd expected, but I never guessed it was all in one place, and that not even Little Rock.
Amazing. I noticed way back in 2000 that Arkansas' Pacific Islander pop. was elevated compared to what I'd expected, but I never guessed it was all in one place, and that not even Little Rock.
The NHOPI population in the census is more than double what was being reported in the ACS. Springdale is HQ of Tyson Foods, so they work in chicken processing plants.
In the 2005-9 ACS there were 1253 Other Micronesian (ie not Guamanian or Chamorro) in Arkansas. 1209 were in Washington County and 1207 were in Springdale.
I found a story of a Marshallese who came in the 1980s and would always tell his relatives and friends of the jobs available. Marshallese don't need visas, so they are preferred workers for low-paying unpleasant working conditions. Supposedly, the food processing workers in Springdale have been assisted by relatives, as opposed to brought here by brokers, for employment in nursing homes and amusement parks. The Marshall Islands opened a consulate in Springdale in 2009.
Title: Re: Official US 2010 Census Results
Post by: jimrtex on February 25, 2011, 03:56:04 PM
What's the nonhispanic SOR population.
Amazing. I noticed way back in 2000 that Arkansas' Pacific Islander pop. was elevated compared to what I'd expected, but I never guessed it was all in one place, and that not even Little Rock.
Amazing. I noticed way back in 2000 that Arkansas' Pacific Islander pop. was elevated compared to what I'd expected, but I never guessed it was all in one place, and that not even Little Rock.
SOR in Springdale is 15332 and HLO is 24692. Which seems like a pretty big ratio (most ratios i've seen are 3:1 Hispanic:SOR)
I wish there were a break down for SOR too.
White: 45,185 total, 36,798 Non-Hispanic, 8,387 Hispanic = 18.6% Hispanic
Black: 1,251, 1,160, 91 7.3%
AIAN: 679, 534, 145, 21.4%
Asian 1363, 1336, 27, 2.0%
SOR 15332, 105, 15227, 99.3%
NHOPI 3976, 3967, 9, 0.2%
White-Black 252, 239, 13, 5.2%
White-AIAN: 574, 520, 54 9.4%
White-Asian: 151, 139, 12 7.9%
White-SOR: 601, 16, 585, 97.3%
Other 2+: 433, 291, 142 32.8%
Title: Re: Official US 2010 Census Results
Post by: Sounder on February 25, 2011, 06:37:50 PM
Question for the northwesterners: why is Deschutes county (Bend, OR) growing so fast?
It's beautiful and a paradise. It is on the east side of the Cascades, so it is sunny with a more continental climate. It is home to the premier ski resort in the Cascades (Mt. Bachelor) and the large Sunriver Resort. The Deschutes River is famous for fishing and rafting. The 10,000+ ft. tall Three Sisters (http://en.wikipedia.org/wiki/Three_Sisters_%28Oregon%29) volcanoues and Mt. Bachelor (http://en.wikipedia.org/wiki/Mount_Bachelor) tower off in the distance. Black Butte, Newberry Crater (http://en.wikipedia.org/wiki/Newberry_Volcano), and Pilot Butte (http://en.wikipedia.org/wiki/Pilot_Butte_%28Oregon%29) (Bend's extinct volcano) show off the area's volcanism.
Sisters, Sunriver, and Bend are all popular vacation and retirement destinations. Quite a few former pro athletes live in the county.
I think Bend also experienced growth the same way Las Vegas and Phoenix did--it was a low-cost housing market of a certain size convenient to some wealthy, high-cost housing markets.
Not at all. Bend is isolated. It is on the east side of the Cascade Range. It also isn't that cheap. I am sure it did experience growth from Californians cashing out and fleeing California, but so did everywhere else out west.
Title: Re: Official US 2010 Census Results
Post by: RBH on February 25, 2011, 09:13:35 PM
Changes! (North County, STL edition)
Bellefontaine Neighbors, MO
2000: 54% White/44% African-American (pop. 11271)
2010: 26% White/73% African-American (pop. 10860)
Riverview village, MO
2000: 58% White/40% African-American (pop. 3146)
2010: 27% White/70% African-American (pop. 2856)
Spanish Lake CDP, MO
2000: 42% White/55% African-American (pop. 21337)
2010: 20% White/77% African-American (pop. 19650)
Title: Re: Official US 2010 Census Results
Post by: Verily on February 25, 2011, 10:26:19 PM
That majority black MO-01 may be possible after all. The 2005-2009 ACS estimate for Bellefontaine Neighbors was 50.3% black, 48.4% white, so I guess the ACS did not pick up on white flight in North STL County very well. Had Riverview Village as 59.5% black, too (although was much closer for Spanish Lake, estimating 73.9% black).
Title: Re: Official US 2010 Census Results
Post by: cinyc on February 26, 2011, 02:46:00 AM
That majority black MO-01 may be possible after all. The 2005-2009 ACS estimate for Bellefontaine Neighbors was 50.3% black, 48.4% white, so I guess the ACS did not pick up on white flight in North STL County very well. Had Riverview Village as 59.5% black, too (although was much closer for Spanish Lake, estimating 73.9% black).
It's still going to be very difficult to do. By my math, the average Missouri CD will have about 748,000 residents. A majority would be about 374,000. There are about 390,000 African Americans in St. Louis city and county combined - before taking into account Hispanic status. I doubt you'd be able to draw a district that captures 95% of St. Louis City and County's African-Americans - and that's before deciding whether black Hispanics should qualify under whatever race-based standard you are applying.
I'm not sure why creating such a district is necessary, since any district centered on St. Louis city will likely vote for the Democrat, anyway, similar to how the African-American population would vote.
Title: Re: Official US 2010 Census Results
Post by: muon2 on February 26, 2011, 10:33:19 AM
That majority black MO-01 may be possible after all. The 2005-2009 ACS estimate for Bellefontaine Neighbors was 50.3% black, 48.4% white, so I guess the ACS did not pick up on white flight in North STL County very well. Had Riverview Village as 59.5% black, too (although was much closer for Spanish Lake, estimating 73.9% black).
It's still going to be very difficult to do. By my math, the average Missouri CD will have about 748,000 residents. A majority would be about 374,000. There are about 390,000 African Americans in St. Louis city and county combined - before taking into account Hispanic status. I doubt you'd be able to draw a district that captures 95% of St. Louis City and County's African-Americans - and that's before deciding whether black Hispanics should qualify under whatever race-based standard you are applying.
I'm not sure why creating such a district is necessary, since any district centered on St. Louis city will likely vote for the Democrat, anyway, similar to how the African-American population would vote.
It's not only about the party preferred by the black population, but by the candidates preferred by the minority group. If there is a clear difference in voting preference between blacks and whites, even in the primary, and it is possible to create a >50% VAP black district, then failure to do so can be the basis for a federal VRA challenge.
Title: Re: Official US 2010 Census Results
Post by: cinyc on February 26, 2011, 01:54:12 PM
That majority black MO-01 may be possible after all. The 2005-2009 ACS estimate for Bellefontaine Neighbors was 50.3% black, 48.4% white, so I guess the ACS did not pick up on white flight in North STL County very well. Had Riverview Village as 59.5% black, too (although was much closer for Spanish Lake, estimating 73.9% black).
It's still going to be very difficult to do. By my math, the average Missouri CD will have about 748,000 residents. A majority would be about 374,000. There are about 390,000 African Americans in St. Louis city and county combined - before taking into account Hispanic status. I doubt you'd be able to draw a district that captures 95% of St. Louis City and County's African-Americans - and that's before deciding whether black Hispanics should qualify under whatever race-based standard you are applying.
I'm not sure why creating such a district is necessary, since any district centered on St. Louis city will likely vote for the Democrat, anyway, similar to how the African-American population would vote.
It's not only about the party preferred by the black population, but by the candidates preferred by the minority group. If there is a clear difference in voting preference between blacks and whites, even in the primary, and it is possible to create a >50% VAP black district, then failure to do so can be the basis for a federal VRA challenge.
Yes. But could a district that is at most 52% African-American still vote against the candidate the minority supposedly wants, anyway - and that's before doing whatever the VRA requires to be done with non-Hispanic blacks or even trying to figure out if a district that is majority VAP black is possible in the St. Louis area. My guess is that it can't be drawn and even if it is, it won't matter because the incumbent black Democrat, William Clay, will win MO-01 regardless of how it is drawn as long as it includes most of St. Louis City.
This racial stuff is overrated and unnecessary in a country that has elected a black President. I hope the Supreme Court strikes down the VRA when states overreach this cycle.
Title: Re: Official US 2010 Census Results
Post by: nclib on February 26, 2011, 06:48:58 PM
Alabama, Hawaii, Missouri, Nevada and Utah are now out. The highlights, in reverse alphabetical order:
Utah
In Utah, growth was largely in the Salt Lake City area, particularly in the I-15 corridor from Salt Lake City to Provo. The state's fastest-growing cities were Lehi (+149%), Spanish Fork (+71%), South Jordan (+71%), Draper (+67%), Riverton (+55%), West Jordan (+52%) and St. George (+47%), all but the last of which are in that corridor. Salt Lake City proper barely grew (+3%) and suburban Sandy lost population (-1%).
The fastest-growing counties were Wasatch (+55%), on the other side of the mountains for which it is named from Provo (perhaps exurban spillover in the Heber City area - but the population is still under 25k), Washington (+53%), on the state's southwest corner in Utah's dixie, home to the city of St. George, Tooele (+43%), immediately west of Salt Lake County, and Utah (+40%), home of Provo and BYU. Salt Lake County grew slower than the state (14.6% vs. 23.8%), but still picked up more residents than all but Utah County - and more residents than live in all but the top 5 counties.
Where are you getting the tabular form for data like this? The website is hard to navigate.
Title: Re: Official US 2010 Census Results
Post by: jimrtex on February 26, 2011, 08:33:02 PM
Alabama, Hawaii, Missouri, Nevada and Utah are now out. The highlights, in reverse alphabetical order:
Utah
In Utah, growth was largely in the Salt Lake City area, particularly in the I-15 corridor from Salt Lake City to Provo. The state's fastest-growing cities were Lehi (+149%), Spanish Fork (+71%), South Jordan (+71%), Draper (+67%), Riverton (+55%), West Jordan (+52%) and St. George (+47%), all but the last of which are in that corridor. Salt Lake City proper barely grew (+3%) and suburban Sandy lost population (-1%).
The fastest-growing counties were Wasatch (+55%), on the other side of the mountains for which it is named from Provo (perhaps exurban spillover in the Heber City area - but the population is still under 25k), Washington (+53%), on the state's southwest corner in Utah's dixie, home to the city of St. George, Tooele (+43%), immediately west of Salt Lake County, and Utah (+40%), home of Provo and BYU. Salt Lake County grew slower than the state (14.6% vs. 23.8%), but still picked up more residents than all but Utah County - and more residents than live in all but the top 5 counties.
Utah
In Utah, growth was largely in the Salt Lake City area, particularly in the I-15 corridor from Salt Lake City to Provo. The state's fastest-growing cities were Lehi (+149%), Spanish Fork (+71%), South Jordan (+71%), Draper (+67%), Riverton (+55%), West Jordan (+52%) and St. George (+47%), all but the last of which are in that corridor. Salt Lake City proper barely grew (+3%) and suburban Sandy lost population (-1%).
The fastest-growing counties were Wasatch (+55%), on the other side of the mountains for which it is named from Provo (perhaps exurban spillover in the Heber City area - but the population is still under 25k), Washington (+53%), on the state's southwest corner in Utah's dixie, home to the city of St. George, Tooele (+43%), immediately west of Salt Lake County, and Utah (+40%), home of Provo and BYU. Salt Lake County grew slower than the state (14.6% vs. 23.8%), but still picked up more residents than all but Utah County - and more residents than live in all but the top 5 counties.
Where are you getting the tabular form for data like this? The website is hard to navigate.
http://2010.census.gov/news/press-kits/redistricting.html
Click on a state in those that have been released, and then under "Release Information" in the box in the upper right click on "Custom Tables" which is a link to Excel (.xls) spread sheets with some summary information. Only the 20 largest cities and counties are included.
If on the above page you click on the map, you will get an interactive widget that lets you put the cursor and get a population read out for each county.
And the data is now in the American Fact Finder. If you haven't used the new version of American Fact Finder, run some of the tutorials - or it probably won't make any sense.
Title: Re: Official US 2010 Census Results
Post by: cinyc on February 26, 2011, 09:58:54 PM
Alabama, Hawaii, Missouri, Nevada and Utah are now out. The highlights, in reverse alphabetical order:
Utah
In Utah, growth was largely in the Salt Lake City area, particularly in the I-15 corridor from Salt Lake City to Provo. The state's fastest-growing cities were Lehi (+149%), Spanish Fork (+71%), South Jordan (+71%), Draper (+67%), Riverton (+55%), West Jordan (+52%) and St. George (+47%), all but the last of which are in that corridor. Salt Lake City proper barely grew (+3%) and suburban Sandy lost population (-1%).
The fastest-growing counties were Wasatch (+55%), on the other side of the mountains for which it is named from Provo (perhaps exurban spillover in the Heber City area - but the population is still under 25k), Washington (+53%), on the state's southwest corner in Utah's dixie, home to the city of St. George, Tooele (+43%), immediately west of Salt Lake County, and Utah (+40%), home of Provo and BYU. Salt Lake County grew slower than the state (14.6% vs. 23.8%), but still picked up more residents than all but Utah County - and more residents than live in all but the top 5 counties.
Utah
In Utah, growth was largely in the Salt Lake City area, particularly in the I-15 corridor from Salt Lake City to Provo. The state's fastest-growing cities were Lehi (+149%), Spanish Fork (+71%), South Jordan (+71%), Draper (+67%), Riverton (+55%), West Jordan (+52%) and St. George (+47%), all but the last of which are in that corridor. Salt Lake City proper barely grew (+3%) and suburban Sandy lost population (-1%).
The fastest-growing counties were Wasatch (+55%), on the other side of the mountains for which it is named from Provo (perhaps exurban spillover in the Heber City area - but the population is still under 25k), Washington (+53%), on the state's southwest corner in Utah's dixie, home to the city of St. George, Tooele (+43%), immediately west of Salt Lake County, and Utah (+40%), home of Provo and BYU. Salt Lake County grew slower than the state (14.6% vs. 23.8%), but still picked up more residents than all but Utah County - and more residents than live in all but the top 5 counties.
Where are you getting the tabular form for data like this? The website is hard to navigate.
What jimrtex said, plus looking at the county population change jpeg maps that come with the press release announcing the data for each state. The press releases are usually first put here (http://2010.census.gov/news/press-kits/redistricting.html).
I've been doing the summaries shortly after the press release at about 3PM. Additional data may or may not have been put up on American Factfinder since then. And yes, the new American Factfinder is a bit confusing when you first try to use it.
Title: Re: Official US 2010 Census Results
Post by: cinyc on February 28, 2011, 05:20:38 PM
Nebraska shipped to legislators today, and is expected to be released to the public around 3PM tomorrow.
Title: Re: Official US 2010 Census Results
Post by: cinyc on March 01, 2011, 03:34:02 PM
Nebraska was just released.
The fastest-growing of the top 20 counties was Sarpy (+29.6%), in Omaha's south suburbs. That was followed by Lancaster (+14.0%), home of the state capital of Lincoln, and Douglas (+11.5%), home of Omaha and its western suburbs. No other of the top 20 counties grew by more than 10%, though Hall (+9.5%), Buffalo (+9.1%) and Washington (+7.7%) did grow faster than the state (+6.7%). Hall and Buffalo are home to the market towns of Grand Island and Kearney, in central Nebraska; Washington is immediately north of Omaha. Gage (-3.0%), Madison (-1.0%) and Dawson (-0.2%) counties lost population - as did most smaller counties in the state. Those three counties are home to smaller market towns that also likely lost population.
Omaha is still the state's largest city, growing 4.9% since 2000. Its population is over 400,000. The two fastest-growing cities in the state were LaVista (+34.7%) and Papillion (+15.5%), both Omaha suburbs in Sarpy County. Lincoln was next, growing at a 14.5% clip, followed by the Omaha suburb of Bellevue (+13.0%), Grand Island (+13.0%), Kearney (+12.2%) and South Sioux City (+12.0%). South Sioux City is across the Missouri River from its Iowa namesake. Alliance (-5.2%), in Western Nebraska, York (-3.9%), east of Grand Island, and Beatrice (-0.3%), in Southeast Nebraska, lost population.
Nebraska's non-Hispanic white population grew by just 0.4%. The Hispanic population grew by 77%, non-Hispanic Asians by 47% and non-Hispanic Blacks by 20%. Omaha has about as many Hispanics as African Americans (before taking into account whether those blacks are Hispanic or not Hispanic). Lexington, west of Kearney on I-80, is majority Hispanic. South Sioux City is almost half Hispanic.
Census hasn't said whether it shipped any of the 4 remaining states promised this week to legislators today.
Title: Re: Official US 2010 Census Results
Post by: Verily on March 01, 2011, 03:55:07 PM
Lexington was majority Hispanic in 2000, too. What's the percentage now?
Also, with Douglas and Sarpy Counties both growing faster than the state, what will they do with NE-02?
Also, with Douglas and Sarpy Counties both growing faster than the state, what will they do with NE-02?
Title: Re: Official US 2010 Census Results
Post by: Linus Van Pelt on March 01, 2011, 04:40:18 PM
Delaware and (more interestingly) North Carolina shipped today.
Title: Re: Official US 2010 Census Results
Post by: cinyc on March 01, 2011, 05:04:01 PM
Lexington was majority Hispanic in 2000, too. What's the percentage now?
Also, with Douglas and Sarpy Counties both growing faster than the state, what will they do with NE-02?
Also, with Douglas and Sarpy Counties both growing faster than the state, what will they do with NE-02?
60.4%.
Douglas plus Sarpy has about 67,000 more residents than required for one CD (about 609,000). They are now about 11% over the population required for one district, versus about 3% over in 2000. I'm not sure much would need to change except which portions of Sarpy are included with Douglas. But that doesn't necessarily mean the legislature or whomever is drawing the lines might not want to do something else, like split Douglas.
Title: Re: Official US 2010 Census Results
Post by: cinyc on March 01, 2011, 08:06:57 PM
For whatever reason, the 2009 census estimate for Omaha was way off - 454,731 versus an actual Census 2010 population of 408,958. The estimate for Douglas County as a whole, though, was accurate - 510,199 versus 517,110. About 10,000 of Omaha's 18,951 new residents were gained in the annexation of the former city of Elkhorn, per the Omaha World-Herald (http://www.omaha.com/article/20110301/NEWS01/110309991#metro-population-hits-865-350).
Title: Re: Official US 2010 Census Results
Post by: RBH on March 01, 2011, 08:36:22 PM
Majority Hispanic Cities in Nebraska
Schuyler: 65.4% (up from 45.1%)
Lexington: 60.4% (up from 51.15%)
Between 45-50%
Madison: 48.8% (up from 33.9%)
South Sioux City: 45.3% (up from 24.8%)
Schuyler: 65.4% (up from 45.1%)
Lexington: 60.4% (up from 51.15%)
Between 45-50%
Madison: 48.8% (up from 33.9%)
South Sioux City: 45.3% (up from 24.8%)
Title: Re: Official US 2010 Census Results
Post by: True Federalist (진정한 연방 주의자) on March 01, 2011, 08:53:22 PM
Delaware and (more interestingly) North Carolina shipped today.
Title: Re: Official US 2010 Census Results
Post by: cinyc on March 01, 2011, 09:00:57 PM
Delaware and (more interestingly) North Carolina shipped today.
Later this week. My guess is Thursday, but we'll see.
Title: Re: Official US 2010 Census Results
Post by: jimrtex on March 01, 2011, 11:19:01 PM
Delaware and (more interestingly) North Carolina shipped today.
Title: Re: Official US 2010 Census Results
Post by: cinyc on March 01, 2011, 11:47:23 PM
Delaware and (more interestingly) North Carolina shipped today.
And they've usually been released around 3PM Eastern - but Delaware and North Carolina are expected to be released at 2PM Eastern tomorrow.
Title: Re: Official US 2010 Census Results
Post by: cinyc on March 02, 2011, 02:48:12 PM
North Carolina and Delaware have been released.
North Carolina
Every major North Carolina county grew - but among the top 20, no county faster than Union County (+62.8%), Charlotte's southeast suburbs/exurbs. Mecklenburg (Charlotte) is still the largest county in the state, just barely edging out Wake County (Raleigh) by under 20,000 residents. Wake grew at a 43.5% clip, picking up more residents than live in all but the top 5 North Carolina counties. Johnston County, Raleigh's southeast suburbs, was next fastest growing, at 38.5%, followed by Cabbarus County, in Charlotte's northeast suburbs/exurbs at 35.8%, Mecklenburg at 32.2%, Iredell, in Charlotte's northern suburbs/exurbs, at 30.0%, New Hanover (Wilmington) at 26.4% and Pitt (Greenville) at 25.7%.
Overall, only 7 of North Carolina's 100 counties lost population - Mitchell, in the mountains, and Halifax, Martin, Washington, Hyde, Lenoir and Jones in the tidewater.
The town of Huntersville, a north Charlotte suburb, was the fastest-growing of the state's top 20 municipalities, growing by 87.4%. Raleigh was next, growing at a 46.3% pace, followed by Cary (west of Raleigh) at 43.1%, Concord (NE of Charlotte) at 41.2%, Wilmington at 40.4%, Greenville at 39.8% and Charlotte at 35.2%. Charlotte grew by about 190,000 residents, and has just about as many residents as will be required for one Congressional district.
North Carolina's non-Hispanic white population grew by 10.2%, less than the statewide growth of 18.5%. North Carolina's Hispanic population more than doubled (+111.1%), and its non-Hispanic Asian population almost did (+83.8%). Its non-Hispanic black population grew slightly lower than the state (+17.2%).
Delaware
All three of Delaware's counties grew. Kent County (Dover) grew the fastest at 28.1%, while Sussex County (Georgetown & beach communities) picked up the most new residents. Sussex grew at an impressive 25.9% clip. New Castle County (Wilmington) lagged the other two counties, growing at 7.6%. Nevertheless, New Castle County picked up a few thousand more residents than Kent County. All three counties picked up somewhere between 35,000 to 41,000 residents.
On the municipal level, Wilmington, Delaware's largest city, lost 2.5% of its population. New Castle County more than offset Wilmington's population loss with explosive growth in two towns south of the Chesapeake and Delaware Canal - Townsend grew by 492% and Middletown by 206%. In northern Kent County, Clayton grew by 129% and Smyrna by 76.5%. Other towns with very fast growth included Camden, Kent County (+65.0%), Millsboro, Sussex County (+64.3%), Milton, Sussex County (+55.5%), Bridgeville, Sussex County (+42.6%) and Milford, Sussex County (+42.0%). Lewes, a Sussex County city on Delaware Bay with a direct ferry to New Jersey, lost 6.3% of its population. The capital city of Dover (+12.2%) and Wilmington-suburban Newark (+10.2%), home of the University of Delaware, both grew, but more slowly than the state as a whole (+14.6%).
Delaware's non-Hispanic white population grew by 3.3%. Its Hispanic (+96.4%) and non-Hispanic Asian (+75.7%) populations almost doubled, while its non-Hispanic black population (25.8%) grew faster than the state. Georgetown, Sussex County, is almost half Hispanic.
Title: Re: Official US 2010 Census Results
Post by: cinyc on March 02, 2011, 04:18:26 PM
Kansas and Wyoming shipped to legislators today and are expected to be released to the public at 3PM Eastern tomorrow.
Next week, we will get Arizona, California, Connecticut, Idaho, Ohio, Pennsylvania and Wisconsin. It should be a very interesting week.
Next week, we will get Arizona, California, Connecticut, Idaho, Ohio, Pennsylvania and Wisconsin. It should be a very interesting week.
Title: Re: Official US 2010 Census Results
Post by: RBH on March 02, 2011, 04:22:44 PM
NC towns with the highest Hispanic percentages
1,000-9,999:
Robbins- 50.3% (up from 48.4%)
Siler City- 49.8% (up from 39.3%)
10,000-99,999:
Monroe- 29.4% (up from 21.4%, Jesse Helms must be thrilled)
Asheboro- 26.9% (up from 19.9%)
And Morrisville's Asian population goes from 9.06% to 27.23% in 10 years. The town has grown from 5208 to 18576 in that time. Which means the town had 472 Asians in 2000 and 5058 in 2010.
In the 2000 data, half of Morrisville's Asian population then was Indian-American.
Title: Re: Official US 2010 Census Results
Post by: True Federalist (진정한 연방 주의자) on March 02, 2011, 07:17:48 PM
Why are they taking so effing long to ship South Carolina? I can understand why they didn't give us the earliest priority, but I would have thought that they would have wanted to give a leg up to the States that have a change in the number of U.S. Representatives.
Title: Re: Official US 2010 Census Results
Post by: RBH on March 02, 2011, 07:22:43 PM
next week:
Arizona, California, Connecticut, Idaho, Ohio, Pennsylvania, Wisconsin
Sorry South Carolina!
Arizona, California, Connecticut, Idaho, Ohio, Pennsylvania, Wisconsin
Sorry South Carolina!
Title: Re: Official US 2010 Census Results
Post by: danny on March 02, 2011, 08:45:10 PM
Why are they taking so effing long to ship South Carolina? I can understand why they didn't give us the earliest priority, but I would have thought that they would have wanted to give a leg up to the States that have a change in the number of U.S. Representatives.
It doesn't matter if you change the number of representatives because all the states have to change the boundaries anyway (even single district states have local elections).
Title: Re: Official US 2010 Census Results
Post by: True Federalist (진정한 연방 주의자) on March 02, 2011, 09:18:32 PM
Why are they taking so effing long to ship South Carolina? I can understand why they didn't give us the earliest priority, but I would have thought that they would have wanted to give a leg up to the States that have a change in the number of U.S. Representatives.
It doesn't matter if you change the number of representatives because all the states have to change the boundaries anyway (even single district states have local elections).
Yes and no. If you lose one or more seats, you have to decide which incumbents you want force together or encourage to retire. If you gain one or more seats, you have to decide which districts you want to take the brunt of the dislocations,creating a new seat causes. Those things take more time than simply shifting district boundaries around.
Not only that South Carolina is likely to have to worry about whether they will need to create one or two minority-majority districts. The GOP will want only one, but there will inevitably be a lawsuit when it passes such a plan. Ideally, to have time to deal with the repercussions of any lawsuits, they'd get the data in time to pass a plan this session (which ends at the beginning of June), instead of having to wait until next January. In order for there to be no delays in South Carolina, everything need to be in place no later than March 2, 2012 (one year from today as a matter of fact). That the first deadline on our political calendar, as the party county chairmen have to place advertisements detailing where party candidates for offices in that county may file, and which offices they may file for. The clock is ticking here and we have just one year.
Title: Re: Official US 2010 Census Results
Post by: cinyc on March 02, 2011, 09:36:27 PM
Why are they taking so effing long to ship South Carolina? I can understand why they didn't give us the earliest priority, but I would have thought that they would have wanted to give a leg up to the States that have a change in the number of U.S. Representatives.
Does South Carolina have ANY regularly scheduled elections in 2011 - major county, local or whatever? If not, Census should wait to release it last behind states who have at least some elections this year, but before those who do not require DOJ preclearance.
Title: Re: Official US 2010 Census Results
Post by: True Federalist (진정한 연방 주의자) on March 02, 2011, 10:27:06 PM
Why are they taking so effing long to ship South Carolina? I can understand why they didn't give us the earliest priority, but I would have thought that they would have wanted to give a leg up to the States that have a change in the number of U.S. Representatives.
Does South Carolina have ANY regularly scheduled elections in 2011 - major county, local or whatever? If not, Census should wait to release it last behind states who have at least some elections this year, but before those who do not require DOJ preclearance.
Depends on what you mean by "regular". Elections for county and state offices are all held on the usual biennial dates, but municipalities and school boards get to pick their own election dates, which may or may not be the Tuesday after the first Monday of November. Slightly under half will use the traditional election day, but there are regularly scheduled local elections every month except January and August someplace in South Carolina this year. At least they are largely non-partisan.
For example, most of the smaller municipalities in Charleston county will hold elections on the regular election day of November 8 this year, but Charleston itself will hold its municipal election on November 1, and North Charleston on November 2. The municipal elections in the cities of Charleston and Spartanburg and the Spartanburg County school board elections appear to be the biggest elections this November.
The only two partisan local elections (i.e., with primaries) scheduled this year according to the State Election Commission are those in the cities of Aiken and Georgetown.
As I said earlier when I complained, I can understand why South Carolina wasn't one of the first, but given the realities of when the Legislature will leave Columbia, we do need to not be one of the last.
For those who want to get an idea of the insanity of South Carolina local elections, here's a link to the schedule the State Election Commission has.
http://www.scvotes.org/files/2011-03-02%20Election%20Calendar.pdf
Even before any special elections are added to the mix, it is a total of twenty-two different election days.
Title: Re: Official US 2010 Census Results
Post by: cinyc on March 02, 2011, 11:01:33 PM
Thanks. The problem for South Carolina is that there are states left that hold major county and city elections in 2011 - and the county legislative district boundaries need to be adjusted for population shifts in the next few months. New York is one example of this - and we haven't gotten our 2010 census data, either. The timing for those states is much more critical than a state that just needs to have something done by this time next year.
After tomorrow, the Census will be halfway done with the 2010 census release - 26 of the 50 states will have been released. We will be up to 33 of 50 (or 51, if DC counts) after next week. That leaves 17 states plus DC (if it counts) to be released over the last three weeks of March. They're on schedule.
After tomorrow, the Census will be halfway done with the 2010 census release - 26 of the 50 states will have been released. We will be up to 33 of 50 (or 51, if DC counts) after next week. That leaves 17 states plus DC (if it counts) to be released over the last three weeks of March. They're on schedule.
Title: Re: Official US 2010 Census Results
Post by: True Federalist (진정한 연방 주의자) on March 03, 2011, 11:32:46 AM
The timing for those states is much more critical than a state that just needs to have something done by this time next year.
Problem is, unless DOJ preclearance and the inevitable VRA lawsuits are taken care of more quickly than I expect, the General Assembly needs to pass a plan this session, not at the start of the next session to have things done by this time next year. This session is scheduled to end, as does every regular session, on the first Thursday of June. June 2. There are provisions for extending the session if the budget is delayed, but non-budget matters require a 2/3 vote of each house after June 2. The GOP is in control, but it doesn't have a 2/3 majority in either House. A partisan redistricting plan will not pass during an extended session.
Title: Re: Official US 2010 Census Results
Post by: minionofmidas on March 03, 2011, 11:37:22 AM
I suggest South Carolina census results be embargoed until June 2nd, then. ;D
Title: Re: Official US 2010 Census Results
Post by: cinyc on March 03, 2011, 03:42:25 PM
Kansas and Wyoming have been released.
Kansas
Geary County was the fastest-growing of Kansas' top 20 counties, growing at a 23.0% clip. It is home to part of Fort Riley, and near the university town of Manhattan. The next-fastest growing counties were Johnson (+20.6%), home to Kansas City's southern suburbs, Miami (+15.6%), immediately south of Johnson - which is still small, but is the most logical place for further KC exurbanization as it spreads down the US 69 corridor, Riley (+13.2%), home to Manhattan and the rest of Fort Riley, Leavenworth (+11.0%), due west of KC, Douglas (+10.9%), home of the University of Kansas in Lawrence, Butler (+10.8%), home of some eastern Wichita suburbs, and Wichita's county, Sedgwick (+10.0%).
Six of the state's top 20 counties lost population, most notably, Wyandotte (-0.2%), which includes Kansas City, Kansas and a few small suburbs. The other population losers of the top 20 were counties with small-to-medium-sized market towns: Finney (Garden City; -9.2%), Lyon (Emporia; -6.2%), Montgomery (Independence/Coffeyville; -2.2%), McPherson (McPherson; -1.3%) and Reno (Hutchinson; -0.4%). And most smaller counties in the rest of the state also lost population.
On the other hand, many of Kansas' cities gained population. Kansas City's suburbs like Olathe (+35.4%), Shawnee (+29.6%), Lenexa (+19.8%), Overland Park (+16.3%) and Leawood (+15.2%) generally grew fastest, along with the Wichita suburb of Derby (+24.4%) and Junction City (+23.7%), near Fort Riley. Kansas City, Kansas lost about 1,000 people (-0.7%), while Manhattan (+16.6%), Wichita (+11.1%), Lawrence (+9.4%) and Topeka (+4.9%) gained population. The mid-sized market cities of Emporia (-6.9%) and Garden City (-6.3%) were net losers, while some other similar-sized market cities like Dodge City (+8.6%), Liberal (+4.4%), Salina (+4.4%) and Hutchinson (+3.2%) gained population. The Wichita suburb of Prairie Village (-2.8%) somehow managed to lose population, as did Leavenworth (-0.5%).
Kansas' non-Hispanic white population fell by 0.2%. Its Hispanic population increased by almost 60% and its non-Hispanic Asian population by almost 45%. Kansas' non-Hispanic Black population grew by 7.5%, slightly faster than the state as a whole (6.1%).
Dodge City and Liberal are majority Hispanic. Garden City is almost majority Hispanic. Kansas City and Wichita have more Hispanic residents than African Americans.
Wyoming
Wyoming's fastest-growing county by far was Sublette, an oil and gas boomtown in Western Wyoming. It grew by 73.1%, but due to its small 2000 population, only picked up about 4,300 residents. Campbell County (+36.9%) was next, picking up the most new residents - it is home to the city of Gillette and also has seen a lot of growth in the mineral extraction industry. Sublette's neighbor, Lincoln County (+24.2%) and Campbell's neighbor, Johnson County (+21.1%) followed. Teton County (Jackson Hole; +16.7%), Sweetwater County (Green River/Rock Springs; +16.5%) and Converse County (west of Casper; +14.8%) grew faster than the state (+14.1%). Rural Platte (-1.6%) and Hot Springs counties lost population.
Of the state's top 20 municipalities, Gillette (+48.1%) grew the fastest and picked up the most residents. Rock Springs (+23.1%) grew the next-fastest, followed by the very small communities of Buffalo (+17.6%), Powell (+17.5%), Douglas (+15.7%) and Newcastle (+15.2%). The state capital of Cheyenne remained the state's largest city, growing by 12.2% and widening its lead over Casper (+11.4%) by about 750 to 4,150 residents. The college town of Laramie grew by 13.3%. Riverton grew by 14.0%, putting its population over 10,000 and giving the state 9 cities with a population of 10,000 or more.
Wyoming's non-Hispanic White population grew by 10.3%. Its non-Hispanic Asian population (+60.3%) grew faster than its Hispanic population (+58.6%) - though from much smaller base. Wyoming's non-Hispanic black population was up 24.2% and non-Hispanic American Indian population increased by 15.1%. There are now almost as many non-Hispanic Asians as non-Hispanic blacks in Wyoming. Both groups comprise 0.8% of the state's population.
Title: Re: Official US 2010 Census Results
Post by: ndcohn on March 03, 2011, 04:01:39 PM
Auburn's population growth is also due to annexation.
I'm sorry, but I find that idea hilarious. :P
Which idea is hilarious? Marysville is the fastest-growing city in the state in percentage terms. Granted, its 2000 base population was much lower than most - but even so, it picked up more residents than any city except Seattle and Renton. It jumped from the state's 36th largest city to its 15th.
Snohomish County (17.7%) grew at a faster rate than King, Pierce or the state as a whole.
No, no. I dont doubt you. Ive just lived in or near Marysville (about 15 minutes west of) for most of my life, and my dad used to work for the City of Marysville as their finance director once upon a time, and the notion that Marysville is a Seattle suburb is a strange one to me. If anything, it's a suburb (sorta, it's complicated) of Everett.
Also, on the population growth, a good chunk of that growth in Marysville was from annexations of surrounding suburban areas that were previously unincorporated. It did grow, and quite a bit, dont get me wrong, its just a bit inflated.
Growth due to annexations is one thing that takes further analysis to unravel. The census bureau does not differentiate between growth in the old city area or growth in annexed areas.
It does make sense that Marysville would have seen explosive growth in the past decade, as the Seattle-Tacoma metro area raced up the I-5 corridor. Auburn is another area at the fringes of the highway system where one would have expected to see explosive growth, too.
far less rapidly than suburban Seattle areas like Marysville (137%)
I'm sorry, but I find that idea hilarious. :P
Which idea is hilarious? Marysville is the fastest-growing city in the state in percentage terms. Granted, its 2000 base population was much lower than most - but even so, it picked up more residents than any city except Seattle and Renton. It jumped from the state's 36th largest city to its 15th.
Snohomish County (17.7%) grew at a faster rate than King, Pierce or the state as a whole.
No, no. I dont doubt you. Ive just lived in or near Marysville (about 15 minutes west of) for most of my life, and my dad used to work for the City of Marysville as their finance director once upon a time, and the notion that Marysville is a Seattle suburb is a strange one to me. If anything, it's a suburb (sorta, it's complicated) of Everett.
Also, on the population growth, a good chunk of that growth in Marysville was from annexations of surrounding suburban areas that were previously unincorporated. It did grow, and quite a bit, dont get me wrong, its just a bit inflated.
Growth due to annexations is one thing that takes further analysis to unravel. The census bureau does not differentiate between growth in the old city area or growth in annexed areas.
It does make sense that Marysville would have seen explosive growth in the past decade, as the Seattle-Tacoma metro area raced up the I-5 corridor. Auburn is another area at the fringes of the highway system where one would have expected to see explosive growth, too.
Title: Re: Official US 2010 Census Results
Post by: cinyc on March 03, 2011, 04:10:40 PM
Auburn's population growth is also due to annexation.
All of it or just some of it - and how much of that growth was in the old area of town or new area after annexation versus just caused by annexation?
Census makes it difficult to answer those questions without looking deeper at tract and block-level results.
Title: Re: Official US 2010 Census Results
Post by: Dgov on March 07, 2011, 06:58:56 AM
Anyone know when new Mexico is going to come out? I want to know how close to majority-Hispanic the State is.
Title: Re: Official US 2010 Census Results
Post by: JohnnyLongtorso on March 07, 2011, 07:34:52 AM
Anyone know when new Mexico is going to come out? I want to know how close to majority-Hispanic the State is.
They're going to release everything by April 1.
Title: Re: Official US 2010 Census Results
Post by: cinyc on March 07, 2011, 04:10:25 PM
Anyone know when new Mexico is going to come out? I want to know how close to majority-Hispanic the State is.
If the past is any indication, on a Tuesday-Friday between March 15 and March 31. Possibly on a Saturday, but usually not. It will not be this week.
California will be released around 3:30PM Eastern tomorrow.
Title: Re: Official US 2010 Census Results
Post by: cinyc on March 08, 2011, 03:46:17 PM
California has been released.
San Diego County jumped Orange to become the second-largest in the state. The fastest-growing of the top 20 counties was Riverside (+41.7%), followed by Kern (Bakersfield) (+26.9%), San Joaquin (Stockton/Tracy) (+21.6%) and Tulare (Visalia) (+20.2%). Basically, Inland Empire and Central Valley counties. Riverside picked up the most new residents - over 640,000, followed by San Bernadino (+19.1%; 325,000), Los Angeles (+3.1%; almost 300,000) and San Diego (+10.0%; 280,000). Orange County grew by 5.8%, Santa Clara by 5.9%, Alameda by 4.6%, Sacramento by 16.0%, Contra Costa by 10.6%, San Francisco by 3.7% and San Mateo by a paltry 1.6%.
Los Angeles remains by far the largest city in the state with almost 3.8 million residents (+2.6%). San Diego (+6.9%) cracked 1.3 million. The fastest-growing of the top 20 cities in the state is Fontana (+52.1%) in San Bernadino County. Irvine, Orange County was next (+48.4%), followed by Bakersfield (+40.6%), Chula Vista, San Diego County (+40.5%), Stockton (+19.7%) and Riverside (+19.1%). Santa Ana (-4.0%) and Oakland (-2.2%) lost population. Long Beach barely grew (+0.2%).
California grew by 10.0%. Its non-Hispanic White population fell by 5.4% from 2000. Non-Hispanic whites now comprise 40.1% of California's population, Latinos 37.6%, non-Hispanic Asians 12.8% and non-Hispanic blacks 5.8%. California's non-Hispanic Black (-0.8%) and non-Hispanic American Indian (-9.3%) also fell from 2000.
Title: Re: Official US 2010 Census Results
Post by: minionofmidas on March 08, 2011, 03:56:54 PM
Its Indian population fell? Lol. What's going on here?
California has a huge number of reservations but most of them are tiny. It also has a lot of people of (often part) native Californian descent who are not members of any recognized sovereign nation and who usually pass as Chicanos for most of their daily lives - a lot of them identify as Native American on Census records though, or at least did in 2000. Actually, quite a few offrez-residing recognized California natives do the same thing.
And needless to say, it has huge numbers of whites with a part Indian great-grandparent, or Whites with an Indian grandparent who're actually registered members of an Indian nation, or Whites with a false family tradition of Indian ancestry somewhere deep in the recesses of the 19th or 18th century. A lot of whom report as Native or more commonly as White and Native. But if those reporting practices were changing, we would have seen that in stats for other states as well, wouldn't we?
Title: Re: Official US 2010 Census Results
Post by: cinyc on March 08, 2011, 04:01:34 PM
Its Indian population fell? Lol. What's going on here?
California has a huge number of reservations but most of them are tiny. It also has a lot of people of (often part) native Californian descent who are not members of any recognized sovereign nation and who usually pass as Chicanos for most of their daily lives - a lot of them identify as Native American on Census records though, or at least did in 2000. Actually, quite a few offrez-residing recognized California natives do the same thing.
And needless to say, it has huge numbers of whites with a part Indian great-grandparent, or Whites with an Indian grandparent who're actually registered members of an Indian nation, or Whites with a false family tradition of Indian ancestry somewhere deep in the recesses of the 19th or 18th century. A lot of whom report as Native or more commonly as White and Native. But if those reporting practices were changing, we would have seen that in stats for other states as well, wouldn't we?
California has a huge number of reservations but most of them are tiny. It also has a lot of people of (often part) native Californian descent who are not members of any recognized sovereign nation and who usually pass as Chicanos for most of their daily lives - a lot of them identify as Native American on Census records though, or at least did in 2000. Actually, quite a few offrez-residing recognized California natives do the same thing.
And needless to say, it has huge numbers of whites with a part Indian great-grandparent, or Whites with an Indian grandparent who're actually registered members of an Indian nation, or Whites with a false family tradition of Indian ancestry somewhere deep in the recesses of the 19th or 18th century. A lot of whom report as Native or more commonly as White and Native. But if those reporting practices were changing, we would have seen that in stats for other states as well, wouldn't we?
I think you answered your own question. California's NON-HISPANIC American Indian population fell. Its overall American Indian population rose by 8.8%. So did its overall White population (+6.4%) for that matter.
When Hispanicness matters more than Nativeness in the racial classifications of the day, that's the result you end up getting.
I should have made the non-Hispanic part clearer in my original post. I've since edited it.
The only counties that lost population were Alpine, Sierra and Plumas. Placer County near Sacramento isn't among the top 20 largest counties of the state, but grew by more than 25%.
Title: Re: Official US 2010 Census Results
Post by: cinyc on March 08, 2011, 04:11:38 PM
Connecticut, Pennsylvania and Ohio were shipped today. They are expected to be released around 2PM Eastern tomorrow.
Title: Re: Official US 2010 Census Results
Post by: minionofmidas on March 08, 2011, 04:18:38 PM
Alpine lost population? It has only 1200 people... and that's after some reasonably robust growth in the last few decades. It also has utterly bizarre demographics - it's, like, half Mormon and quarter Peyotist. With no other established place of worship existing in the county (any practicing mainstream Christians probably drive elsewhere.)
Title: Re: Official US 2010 Census Results
Post by: cinyc on March 08, 2011, 04:29:05 PM
Alpine lost population? It has only 1200 people... and that's after some reasonably robust growth in the last few decades. It also has utterly bizarre demographics - it's, like, half Mormon and quarter Peyotist. With no other established place of worship existing in the county (any practicing mainstream Christians probably drive elsewhere.)
Alpine's population fell from 1,208 to 1,175 (-2.7%). At least that was better than the 2009 estimate - 1,041. Sierra fell from 3,555 to 3,240 (-8.9%). That was better than the 2009 estimate - 3,174. Plumas fell from to 20,824 to 20,007 (-3.9%). Its 2009 estimate was fairly accurate, but off on the high side - 20,122.
FWIW, Placer County grew by 40.3%, slightly slower than Riverside. It picked up just over 100,000 new residents.
Title: Re: Official US 2010 Census Results
Post by: minionofmidas on March 08, 2011, 04:37:22 PM
That rate of growth means LA County loses almost an entire district. (From 14.9 to 14.0.)
Looking at the California racial table, I realize that the detailed count of tribal identifications from the 2000 Census did not include any Hispanic data - that is, people who identified as Indian only on the race question, wrote in one of the relevant California tribal groupings (Chumash, Diegueno, what have you), and also checked Hispanic Origin would have been undistinguishable in that table from those who did not identify as Hispanic. Given the large numbers of Cherokee, Sioux, Blackfeet (why is Blackfeet such a popular identity with fake Indians? That would be worth a study...) in the state, and the fact that half its Indian population also identifies as Hispanic makes you wonder if most of the California Natives of that class that I described above weren't already being counted as Hispanic. Though maybe it was most before and almost all now, who knows. One would have to take a very close look at community-level figures to find out. (of course, a lot of those Native Hispanic repliers are Mexican Indigenas. Interesting factoid: Mexicans living near Indian reservations are somewhat more likely to identify as Indian - perhaps the presence of Natives in the vicinity raises self-awareness of Native ancestry?)
The non-hispanic Native alone or in combination population also rose, just barely. So 17,000 new part-Indian identifiers, despite the Anglo population also falling. Hmmm... :)
Title: Re: Official US 2010 Census Results
Post by: RBH on March 08, 2011, 04:46:26 PM
The drop from 14.9 to 14 has to mean that a Dem loses a district, right? I don't know if the Republicans living in LA County can be drawn out so easily
Title: Re: Official US 2010 Census Results
Post by: minionofmidas on March 08, 2011, 04:49:00 PM
The drop from 14.9 to 14 has to mean that a Dem loses a district, right? I don't know if the Republicans living in LA County can be drawn out so easily
Title: Re: Official US 2010 Census Results
Post by: RBH on March 08, 2011, 05:38:09 PM
Various numbers!
California is 40.1% Non Hispanic White and 37.6% Hispanic. With 12.8% being non-Hispanic Asian (0.2% is Hispanic Asian).
Alameda County is 26% Asian, Contra Costa is 14.4% Asian, Los Angeles County is 13.7% Asian, Orange County is 17.9% Asian, Sacramento is 14% Asian, San Francisco is 33.3% Asian, San Mateo is 24.8% Asian, Santa Clara is 32% Asian. (Other 10%+ Asian counties are San Diego, San Joaquin, Solano, Sutter, and Yolo Counties)
Hispanic majority counties: Colusa, Fresno, Imperial (80%), Kings, Madera, Merced, Monterey, San Benito, and Tulare
10%+ African American Counties: Alameda, Sacramento, Solano
Title: Re: Official US 2010 Census Results
Post by: cinyc on March 08, 2011, 05:43:19 PM
FWIW - and probably not much, given that the California redistricting panel will be drawing completely new lines - best I can tell from trying to import the data into Excel (which caused an error):
CA-3, 4, 11, 21, 22, 25, 41, 44, 45 and 49 are significantly overpopulated (by 70,000 or more residents). CA-25 (Santa Clarita, Antelope and part of Victor Valleys), 44 and 45 (Inland Empire) are the most over, by 140,000+ residents. (CA-25 is 211,000 over.) All three are held by Republicans.
CA-31 in Los Angeles County is the most under, needing over 91,500 new residents. CA-7, 9, 12, 14, 29, 32, 33, 38, 46, 47 all need more than 40,000 new residents.
CA-1, 2, 5 and 23 are within 7,500 residents of ideal, CA-1 the most ideal (+1107).
Title: Re: Official US 2010 Census Results
Post by: jimrtex on March 08, 2011, 08:53:43 PM
Its Indian population fell? Lol. What's going on here?
California has a huge number of reservations but most of them are tiny. It also has a lot of people of (often part) native Californian descent who are not members of any recognized sovereign nation and who usually pass as Chicanos for most of their daily lives - a lot of them identify as Native American on Census records though, or at least did in 2000. Actually, quite a few offrez-residing recognized California natives do the same thing.
And needless to say, it has huge numbers of whites with a part Indian great-grandparent, or Whites with an Indian grandparent who're actually registered members of an Indian nation, or Whites with a false family tradition of Indian ancestry somewhere deep in the recesses of the 19th or 18th century. A lot of whom report as Native or more commonly as White and Native. But if those reporting practices were changing, we would have seen that in stats for other states as well, wouldn't we?
California has a huge number of reservations but most of them are tiny. It also has a lot of people of (often part) native Californian descent who are not members of any recognized sovereign nation and who usually pass as Chicanos for most of their daily lives - a lot of them identify as Native American on Census records though, or at least did in 2000. Actually, quite a few offrez-residing recognized California natives do the same thing.
And needless to say, it has huge numbers of whites with a part Indian great-grandparent, or Whites with an Indian grandparent who're actually registered members of an Indian nation, or Whites with a false family tradition of Indian ancestry somewhere deep in the recesses of the 19th or 18th century. A lot of whom report as Native or more commonly as White and Native. But if those reporting practices were changing, we would have seen that in stats for other states as well, wouldn't we?
In 2010 in California, a majority (55%) of those who report they are AIAN alone are Hispanic.
The non-Hispanic White+AIAN population is up 4.4% from 134K to 140K
Non-Hispanic AIAN is down from 179K to 162K
NH Black+AIAN up 15.8% from 22K to 26K
NH W+B+AIAN up 49.8% from 16K to 24K
Title: Re: Official US 2010 Census Results
Post by: ○∙◄☻¥tπ[╪AV┼cVê└ on March 08, 2011, 10:34:17 PM
Alpine lost population? It has only 1200 people... and that's after some reasonably robust growth in the last few decades. It also has utterly bizarre demographics - it's, like, half Mormon and quarter Peyotist. With no other established place of worship existing in the county (any practicing mainstream Christians probably drive elsewhere.)
It also votes for Democrats, against parental notification for abortions, and for legalized pot. The fact that they're losing population might mean that it'll be a while before they get a black.
Title: Re: Official US 2010 Census Results
Post by: ○∙◄☻¥tπ[╪AV┼cVê└ on March 08, 2011, 10:47:23 PM
There was some significant white-flight from Alameda county, it lost 8% of whites. But what was even bigger was black-flight, which was 12%. Despite all of this, Alameda county grew by 5% thanks to gains in other races, including Asians increasing by 34% to 26% of the county population.
Title: Re: Official US 2010 Census Results
Post by: RBH on March 09, 2011, 12:13:50 AM
In the category of self redefinition
Lost Hills CDP, California
2000: 71.83% Some Other Race, 96.75% Hispanic
2010: 92.54% Some Other Race, 97.6% Hispanic
SORs are Hispanic in 99% of instances, but the SOR percentage is 45% of the Hispanic percentage in most instances.
Hispanics in California are 46.37% White, 44.47% Some Other Race, 6.04% Two+ Races, 1.43% American Indian, 0.97% Black, 0.61% Asian, and 0.11% Native Hawaiian/Pacific Islander.
The only other CDPs to have over 70% Some Other Race were Oasis (71.51%) and Yettem (70.14%).
On the reverse of that. Cowan CDP had 50.6% Hispanic, but 10.06% Some Other Race and 86% White.
Other low SOR Majority-Hispanic areas are Kings Beach CDP, Volta CDP, Poplar-Cotton Center CDP. All Under 15% SOR. Amongst Cities, Atwater is 52.57% Hispanic, and 18.82% Some Other Race.
Also, quite a few of the Majority Asian cities saw their Asian percentage go up by over 15%
Title: Re: Official US 2010 Census Results
Post by: Verily on March 09, 2011, 01:27:58 PM
Alpine lost population? It has only 1200 people... and that's after some reasonably robust growth in the last few decades. It also has utterly bizarre demographics - it's, like, half Mormon and quarter Peyotist. With no other established place of worship existing in the county (any practicing mainstream Christians probably drive elsewhere.)
Reasonably robust growth? Alpine grew by at most a few dozen people 1980-2000.
Title: Re: Official US 2010 Census Results
Post by: minionofmidas on March 09, 2011, 01:48:18 PM
It's called "misremembering". Basically my brain plotted its 1970-2000 growth as evenly distributed. :P
Title: Re: Official US 2010 Census Results
Post by: Verily on March 09, 2011, 01:51:41 PM
True, it exploded in population in 1970. No idea why, but maybe you know.
Title: Re: Official US 2010 Census Results
Post by: cinyc on March 09, 2011, 02:30:05 PM
Connecticut, Pennsylvania and Ohio are out.
Connecticut
At a macro level, there isn't a ton of change to report about the counties or top 20 cities/towns of Connecticut. The top 10 cities remain the same. Bridgeport is the largest municipality, growing by 3.4%. New Haven (+5.0%) and Hartford (+2.6%) are next, followed by Stamford (+4.7%) and Waterbury (+2.9%). All of those 5 cities but New Haven have more Hispanic residents than African-Americans (even before taking into account Hispanic status) - I'm not sure whether this was also true in 2000. Among the top 20 municipalities, only Middletown (+10.4%), Danbury (+8.1%) and Hamden (+7.1%) experienced anything close to rapid growth - and that's being charitable. West Hartford lost 0.7% of its population. Greenwich (+0.1%), Bristol (+0.7%) and Milford (+0.9%) barely grew. By comparison, the state grew 4.9%.
Connecticut's counties don't matter much, as there is no county government. Nevertheless, Tolland, east of Hartford, grew the fastest (+12.0%), followed by Windham in the quiet (northeast) corner (+8.6%) and central Middlesex (+6.5%) and southeast coastal New London (+5.8%). Growth in the other four counties was less than the statewide average (3.9% to 4.7%).
Connecticut's non-Hispanic white population fell by 3.5%. It's Hispanic population grew by 49.6%, its non-Hispanic Asian population by 64.4% and its non-Hispanic African American population by 13.4%
Pennsylvania
Synopsis: Philly is flat; Pittsburgh (-8.6%) and Western PA lose big time; Lehigh Valley, Amish Country, Harrisburg area and some Philly Suburbs grow. Tiny Forest County grows the fastest in the state; NYC exurbs in Pike and Monroe Counties grow next fastest, but not in top 20 list. 2.2% of Non-Hispanic whites flee the state.
Ohio
Synopsis: All of the top 10 cities other than Columbus (+10.6%) lose population, Youngstown (-18.3%) Cleveland (-17.1%) and Dayton (-14.8%) and Cincinnati (-10.4%) by double digits. Columbus-area counties grow the most, especially Delaware (+58.4%). Hamilton County (Cincy) loses population (-5.1%), but some neighboring counties like Warren (+34.3%) grow. Northeast Ohio... Yikes! 1.9% of Non-Hispanic whites flee Ohio.
More to come.
Title: Re: Official US 2010 Census Results
Post by: RI on March 09, 2011, 03:07:13 PM
Is Forest County, PA a typo or did the population really double while every county around it lost population?
Title: Re: Official US 2010 Census Results
Post by: cinyc on March 09, 2011, 03:13:27 PM
Is Forest County, PA a typo or did the population really double while every county around it lost population?
I don't think it's a typo. Four words: Marcellus Natural Gas Shale. It might have been where the most drilling interest was last April. That, plus the fact that it was the smallest county in the state with a population of less than 5,000 makes it easy for a small number of new residents to cause a big swing that isn't quite as big in real numbers.
Title: Re: Official US 2010 Census Results
Post by: Horus on March 09, 2011, 04:33:20 PM
Here's a national gain/loss map so far.
()
()
Title: Re: Official US 2010 Census Results
Post by: Verily on March 09, 2011, 04:54:58 PM
Is Forest County, PA a typo or did the population really double while every county around it lost population?
I don't think it's a typo. Four words: Marcellus Natural Gas Shale. It might have been where the most drilling interest was last April. That, plus the fact that it was the smallest county in the state with a population of less than 5,000 makes it easy for a small number of new residents to cause a big swing that isn't quite as big in real numbers.
I seem to remember something about a big prison complex opening in Forest County. Estimates have had it growing rapidly since at least 2007 (when I made a map of growth estimates by county, and I remember Forest County being estimated to be growing anomalously fast then, too).
Title: Re: Official US 2010 Census Results
Post by: minionofmidas on March 09, 2011, 05:09:55 PM
http://en.wikipedia.org/wiki/Marienville,_Pennsylvania
Title: Re: Official US 2010 Census Results
Post by: cinyc on March 09, 2011, 05:18:06 PM
Is Forest County, PA a typo or did the population really double while every county around it lost population?
I don't think it's a typo. Four words: Marcellus Natural Gas Shale. It might have been where the most drilling interest was last April. That, plus the fact that it was the smallest county in the state with a population of less than 5,000 makes it easy for a small number of new residents to cause a big swing that isn't quite as big in real numbers.
I seem to remember something about a big prison complex opening in Forest County. Estimates have had it growing rapidly since at least 2007 (when I made a map of growth estimates by county, and I remember Forest County being estimated to be growing anomalously fast then, too).
Yeah, that would do it, especially when the county was very small to begin with.
Sheliak5 - Thanks for the map. Northeast Ohio doesn't look that bad compared to say, central South Dakota or Western Kansas. But Cuyahoga County probably lost more residents (about 110,000) than live in those areas.
Arizona, Idaho and Wisconsin will be released around 3PM tomorrow.
Title: Re: Official US 2010 Census Results
Post by: Linus Van Pelt on March 09, 2011, 09:12:19 PM
Nice work, Sheilak5! I was wondering whether someone would work on a map like that.
Title: Re: Official US 2010 Census Results
Post by: True Federalist (진정한 연방 주의자) on March 09, 2011, 09:43:12 PM
Here's a national gain/loss map so far.
()
()
Is that keyed relative to 2000 or to the average gain from 2000 to 2010?
Title: Re: Official US 2010 Census Results
Post by: Horus on March 09, 2011, 09:54:35 PM
A simple keyed to 2000 map. I'm working on the other as we speak though, it will take a bit longer of course.
Title: Re: Official US 2010 Census Results
Post by: RBH on March 09, 2011, 11:33:24 PM
More random numbers
for those wondering about Forest County.. 18% of the population is now African-American with 1243 of 1389 African Americans in Marienville. The Jenks Township population went from 1261 to 3629.
In case there was any doubt about the prison altering things there
Reading went from 37% Hispanic to 58% Hispanic.
Title: Re: Official US 2010 Census Results
Post by: phk on March 10, 2011, 12:36:14 AM
A simple keyed to 2000 map. I'm working on the other as we speak though, it will take a bit longer of course.
Do you have just California?
Title: Re: Official US 2010 Census Results
Post by: cinyc on March 10, 2011, 04:18:55 AM
Some Connecticut town maps, since I've done them in the past and have kept some 2000 data. All use the Atlas swing color scale (Redder is an increase; Bluer is a decrease. Something close to 0 usually ends up light blue).
First, overall town population change from 2000:
()
Winners: much of the Naugatuck Valley and parts of Eastern CT. Losers: Towns on the New York State Line, especially in Northeastern CT.
Next, what I call white flight - I didn't due this in absolute population gain or loss yet because I'd have to re-do my 2000 spreadsheets. Instead, I calculated percent change in the non-Hispanic White population - i.e. (town non-Hispanic White percentage in 2010) minus (town non-Hispanic White percentage in 2000):
()
As I said, the light blue towns were generally flat. The biggest decreases were in some of the larger cities and their suburbs, especially areas of suburban Hartford.
A lot of the change, naturally, was due to an influx of Hispanics, as you can see here:
()
Though, some was due to an increase in the relative percentage of non-Hispanic African-Americans, too, especially in the Hartford area:
()
Asians, for the heck of it.
()
Most relative percent increases were tiny - less than 5 points - except in Norwich and Rocky Hill. I'm sure this map would be more impressive in percentage increase terms.
Title: Re: Official US 2010 Census Results
Post by: cinyc on March 10, 2011, 03:49:51 PM
Arizona, Idaho and Wisconsin have been released:
Arizona
Arizona experienced rapid growth last decade (+24.6%). In percentage terms, no county grew faster than Pinal (SW Phoenix Exburbs/maybe a few N Tucson exuburbs), whose population more than doubled (+109.1%). In absolute terms, Maricopa County (Phoenix) picked up almost 745,000 new residents, growing almost as fast as the state as a whole (+24.2%). 59% of the state's new residents were in Maracopa. Other big gainers were Mohave, home to cities like Kingman, Bullhead City and Lake Havasu City near or on the California/Nevada border (+29.1%), Yavapai County, north of Maricopa (Prescott; +26.0%), Santa Cruz County, a Mexican border county south of Tucson's county of Pima (Nogales +23.6%) and Yuma County (+22.3%). Pima (Tucson) picked up the third-most residents, but only grew by 16.2%. Tiny Greenlee County on the New Mexico border lost 1.3% of its residents.
Some of the city growth numbers are phenomenal. The city of Maricopa, a Phoenix exurb nestled between two Indian reservations in Pinal County, grew by 4,081.0%. No, that's not a typo. Bristol Palin is in good company. By comparison, the west valley town of Buckeye, Maricopa County "only" grew by 678.3%. Other west-suburban Phoenix stragglers like Surprise (+281.0%), Goodyear (+245.2%) and Avondale (+112.5%) also experienced triple-digit growth. Casa Grande, Pinal County (+92.6%) and Gilbert in Southeast Maricopa (+90.0%) were other fast-growers. Gilbert picked up more residents (almost 99,000) than all Arizona cities but Phoenix (+9.4%; almost 125,000 new residents). Tucson grew by 6.9%.
One caveat - without further analysis, we can't tell how much of any growth was due to annexation versus gains in the municipality as it existed in 2000.
Arizona's non-Hispanic White population grew by 12.9%. Its Hispanic population increased by 46.3%. Hispanics now make up 29.6% of the state's population, up from 25.3%.
Idaho
Idaho grew by 21.1%. Most of the growth was in the Boise area and near Idaho Falls, with some additional growth in counties near or including Twin Falls and Spokane, Washington. The fastest-growing county was Teton (+69.5%), on the other side of Teton Pass from Jackson, Wyoming - but its still not one of the state's top 20 counties. Among the top 20, Canyon (+43.7%), west of Boise, grew fastest, followed by Madison (+36.7%) and Jefferson (+36.5%), both North of Idaho Falls; +36.7%), Ada (Boise; +30.4%), Kootenai (Spokane suburbs/Coeur d'Alene; +27.4%), and Bonneville (Idaho Falls; +26.3%). Jerome (+22.0%) and Twin Falls Counties (+20.1%), both in the Twin Falls area, grew at around the same rate as the state. Among the top 20 counties, Elmore, immediately east of Ada (Mountain Home; -7.2%) and Minidoka, in between Twin Falls and Pocatello (-0.5%) lost population.
On the municipal level, many of the biggest percentage gainers were Boise suburbs - Kuna (+182.6%) and Meridian's (+115.0%) population doubled, while Caldwell (+78.1%) and Nampa (+57.2%) also posted impressive gains. In the Idaho Falls area, Ammon's population more than doubled (+123.3%), and Rexburg, Madison County posted a 47.7% gain. Post Falls (+59.9%), Hayden (+45.1%) and Coeur d'Alene (27.9%) in the Spokane/Coeur d'Alene area also grew. And the Pocatello suburb of Chubbuck (+43.5%) grew faster than the state. Meriden picked up the most new residents (just over 40,000), followed by Nampa (almost 30,000), Caldwell (just over 20,000) and Boise (just under 20,000; +10.7%).
Idaho's non-Hispanic White population grew by 15.5%. Its non-Hispanic plack population almost doubled (+81.5%) - though there are still fewer non-Hispanic blacks in Idaho than Hispanics, non-Hispanic Asians or non-Hispanic American Indians. Idaho's Hispanic population grew by 73.0%, non-Hispanic Asians by 59.2% and non-Hispanic American Indians by 11.2%.
Wisconsin
Wisconsin grew by 6.0% - far less rapidly than Arizona or Idaho. Fast-growth was the exception, not the norm. In percentage terms, St. Croix, a growing exurban county in the Minneapolis-Saint Paul area, grew fastest of the top 20 counties (+33.6%). Nothing else came close. Dane (Madison) grew by 14.4%, picking up the most new residents (around 65,500). Three suburban/exurban Milwaukee-area counties came next - Jefferson (+13.1%), Washington (+12.3%) and Kenosha (+11.3%). No other major county grew by more than 10%. In absolute terms, Milwaukee-suburban Waukesha County (+8.1%) picked up nearly 30,000 new residents, while St. Croix County and Green Bay's Brown County (+9.4%) picked up over 21,000. Milwaukee County only grew by 0.8%, gaining just over 7,500 new residents. Unlike some more sparsely-populated counties primarily in northeastern Wisconsin, none of Wisconsin's top 20 counties lost population.
Among the top-20 cities, only Madison (+12.1%) experienced a double-digit gain. Kenosha (+9.8%) and Waukesha (+9.1%) in the Milwaukee area, Janesville (+6.9%) in southern Wisconsin and Eau Claire (+6.9%) in western Wisconsin grew faster than the state as whole. The city of Milwaukee lost 0.4% of its population. Other losers include Milwaukee-area Racine (-3.7%), the lake Michigan city of Sheboygan (-3.0%), Milwaukee County-suburban Brookfield (-1.9%), Wauwatosa (-1.9%) and West Allis (-1.4%) and La Crosse (-1.0%) on the Minnesota border in the southeastern part of the state.
Wisconsin's non-Hispanic white population increased by 1.2%. Its Hispanic population exploded by 74.2% - but Hispanics still remain under 6% of the state's population. Wisconsin's non-Hispanic Asian population increased by 45.5%, non-Hispanic blacks by 16.9% and non-Hispanic American Indians by 10.3%.
Title: Re: Official US 2010 Census Results
Post by: Brittain33 on March 10, 2011, 04:12:56 PM
You can see the development of Maricopa, AZ (the town) in Google Satellite views by backing out or in of zoom, one step at a time. At some point the image changes and you either gain or lose most of the housing.
Title: Re: Official US 2010 Census Results
Post by: cinyc on March 10, 2011, 05:03:03 PM
Next week: Alaska, Florida, Georgia, Kentucky, Minnesota, Montana, New Mexico, North Dakota and Tennessee.
Title: Re: Official US 2010 Census Results
Post by: Linus Van Pelt on March 10, 2011, 05:50:42 PM
Wisconsin seems to be holding people rather better than similar areas in neighbouring states, both comparing the rural southwest to rural Iowa and Illinois, and Milwaukee to other Great Lakes industrial cities.
Title: Re: Official US 2010 Census Results
Post by: cinyc on March 10, 2011, 06:15:19 PM
Wisconsin seems to be holding people rather better than similar areas in neighbouring states, both comparing the rural southwest to rural Iowa and Illinois, and Milwaukee to other Great Lakes industrial cities.
Milwaukee lost a little bit of its population, but, yes, it was no Cleveland. Of the Great Lakes states, Wisconsin might be the least dependent on manufacturing - that's my sense of the state, though I don't know if there's data to actually back up my impression.
I can't wait to see how much population Detroit lost. But it appears that we will have to wait yet another week for Michigan, New York, West Virginia, South Carolina and four New England states (Massachusetts, Maine, New Hampshire and Rhode Island). Those 8 states will be all that is left after next week's releases. Every state west of or on the Mississippi River will have been released. I think we might get DC and Puerto Rico at some point before April 1, too, most likely last.
Title: Re: Official US 2010 Census Results
Post by: Linus Van Pelt on March 10, 2011, 07:46:39 PM
Wisconsin seems to be holding people rather better than similar areas in neighbouring states, both comparing the rural southwest to rural Iowa and Illinois, and Milwaukee to other Great Lakes industrial cities.
Milwaukee lost a little bit of its population, but, yes, it was no Cleveland. Of the Great Lakes states, Wisconsin might be the least dependent on manufacturing - that's my sense of the state, though I don't know if there's data to actually back up my impression.
Actually Wisconsin is second in the nation (http://factfinder.census.gov/servlet/ThematicMapFramesetServlet?_bm=y&-_MapEvent=displayBy&-errMsg=&-_useSS=N&-_dBy=040&-redoLog=false&-_zoomLevel=&-tm_name=ACS_2009_5YR_G00_M00670&-tm_config=|b=50|l=en|t=5309|zf=0.0|ms=thm_def|dw=1.9557697048764706E7|dh=1.4455689123E7|dt=gov.census.aff.domain.map.LSRMapExtent|if=gif|cx=-1159354.4733499996|cy=7122022.5|zl=10|pz=10|bo=|bl=|ft=350:349:335:389:388:332:331|fl=403:381:204:380:369:379:368|g=01000US|ds=ACS_2009_5YR_G00_|sb=49|tud=false|db=050|mn=0|mx=79.7|cc=1|cm=1|cn=5|cb=|um=Percent|pr=1|th=ACS_2009_5YR_G00_M00670|sf=N|sg=&-PANEL_ID=tm_result&-_pageY=&-_lang=en&-geo_id=01000US&-_pageX=&-_mapY=&-_mapX=&-_latitude=&-_pan=&-ds_name=ACS_2009_5YR_G00_&-_longitude=&-_changeMap=Identify#?366,200) by % of adults employed in manufacturing. But Milwaukee's flagship industry is less vulnerable to the replacement of workers by machines because, well, it is the replacement of workers by machines. (http://www.rockwellautomation.com/)
Title: Re: Official US 2010 Census Results
Post by: True Federalist (진정한 연방 주의자) on March 10, 2011, 08:25:31 PM
Next week: Alaska, Florida, Georgia, Kentucky, Minnesota, Montana, New Mexico, North Dakota and Tennessee.
ARRRRRRRRRRRRRRRRRRRRRRRRRRRRRRRRRRRRRRRRRRRRRRRRRRRRRRRRRRRRRRRRRRRRRRRRRRG!
Title: Re: Official US 2010 Census Results
Post by: cinyc on March 10, 2011, 08:36:18 PM
Wisconsin seems to be holding people rather better than similar areas in neighbouring states, both comparing the rural southwest to rural Iowa and Illinois, and Milwaukee to other Great Lakes industrial cities.
Milwaukee lost a little bit of its population, but, yes, it was no Cleveland. Of the Great Lakes states, Wisconsin might be the least dependent on manufacturing - that's my sense of the state, though I don't know if there's data to actually back up my impression.
Actually Wisconsin is second in the nation (http://factfinder.census.gov/servlet/ThematicMapFramesetServlet?_bm=y&-_MapEvent=displayBy&-errMsg=&-_useSS=N&-_dBy=040&-redoLog=false&-_zoomLevel=&-tm_name=ACS_2009_5YR_G00_M00670&-tm_config=|b=50|l=en|t=5309|zf=0.0|ms=thm_def|dw=1.9557697048764706E7|dh=1.4455689123E7|dt=gov.census.aff.domain.map.LSRMapExtent|if=gif|cx=-1159354.4733499996|cy=7122022.5|zl=10|pz=10|bo=|bl=|ft=350:349:335:389:388:332:331|fl=403:381:204:380:369:379:368|g=01000US|ds=ACS_2009_5YR_G00_|sb=49|tud=false|db=050|mn=0|mx=79.7|cc=1|cm=1|cn=5|cb=|um=Percent|pr=1|th=ACS_2009_5YR_G00_M00670|sf=N|sg=&-PANEL_ID=tm_result&-_pageY=&-_lang=en&-geo_id=01000US&-_pageX=&-_mapY=&-_mapX=&-_latitude=&-_pan=&-ds_name=ACS_2009_5YR_G00_&-_longitude=&-_changeMap=Identify#?366,200) by % of adults employed in manufacturing. But Milwaukee's flagship industry is less vulnerable to the replacement of workers by machines because, well, it is the replacement of workers by machines. (http://www.rockwellautomation.com/)
Yeah, maybe not. I would have expected Ohio to rank higher. For whatever reason, traveling through Wisconsin doesn't seem to give the same depressing feeling you get traveling through Upstate New York, Northern Ohio or Michigan.
Title: Re: Official US 2010 Census Results
Post by: JohnnyLongtorso on March 10, 2011, 08:39:50 PM
Wisconsin seems to be holding people rather better than similar areas in neighbouring states, both comparing the rural southwest to rural Iowa and Illinois, and Milwaukee to other Great Lakes industrial cities.
Milwaukee lost a little bit of its population, but, yes, it was no Cleveland. Of the Great Lakes states, Wisconsin might be the least dependent on manufacturing - that's my sense of the state, though I don't know if there's data to actually back up my impression.
Actually Wisconsin is second in the nation (http://factfinder.census.gov/servlet/ThematicMapFramesetServlet?_bm=y&-_MapEvent=displayBy&-errMsg=&-_useSS=N&-_dBy=040&-redoLog=false&-_zoomLevel=&-tm_name=ACS_2009_5YR_G00_M00670&-tm_config=|b=50|l=en|t=5309|zf=0.0|ms=thm_def|dw=1.9557697048764706E7|dh=1.4455689123E7|dt=gov.census.aff.domain.map.LSRMapExtent|if=gif|cx=-1159354.4733499996|cy=7122022.5|zl=10|pz=10|bo=|bl=|ft=350:349:335:389:388:332:331|fl=403:381:204:380:369:379:368|g=01000US|ds=ACS_2009_5YR_G00_|sb=49|tud=false|db=050|mn=0|mx=79.7|cc=1|cm=1|cn=5|cb=|um=Percent|pr=1|th=ACS_2009_5YR_G00_M00670|sf=N|sg=&-PANEL_ID=tm_result&-_pageY=&-_lang=en&-geo_id=01000US&-_pageX=&-_mapY=&-_mapX=&-_latitude=&-_pan=&-ds_name=ACS_2009_5YR_G00_&-_longitude=&-_changeMap=Identify#?366,200) by % of adults employed in manufacturing. But Milwaukee's flagship industry is less vulnerable to the replacement of workers by machines because, well, it is the replacement of workers by machines. (http://www.rockwellautomation.com/)
Yeah, maybe not. I would have expected Ohio to rank higher. For whatever reason, traveling through Wisconsin doesn't seem to give the same depressing feeling you get traveling through Upstate New York, Northern Ohio or Michigan.
That's because they have beer to dull the pain.
Title: Re: Official US 2010 Census Results
Post by: Kevinstat on March 10, 2011, 09:04:03 PM
Next week: Alaska, Florida, Georgia, Kentucky, Minnesota, Montana, New Mexico, North Dakota and Tennessee.
ARRRRRRRRRRRRRRRRRRRRRRRRRRRRRRRRRRRRRRRRRRRRRRRRRRRRRRRRRRRRRRRRRRRRRRRRRRG!
Yeah, and Montana won't do Legislative redistricting until after the 2012 elections, and has only one congressional district. Interestingly enough, it would do congressional redistricting before the 2012 elections if it had more than one district. (I've read it didn't redraw its congressional districts after the 1980 census until after the 1982 elections, but there was a constitutional amendment moving the congressional redistricting to before the '2' year elections in 1984 (http://sos.mt.gov/elections/Forms/history/constitutionalmeasureslist2010.pdf), only to see the state drop to one congressional district in the next apportionment and not seeming likely to regain its second district anytime soon, making the change in the timing of congressional redistricting moot. I don't think Montana would have been allowed to keep it's second district until 1994 on the grounds that it wasn't time for them to redistrict yet - yeah I know for a fact that they wouldn't have but it's funny to think about).
Title: Re: Official US 2010 Census Results
Post by: minionofmidas on March 11, 2011, 07:02:44 AM
Wisconsin seems to be holding people rather better than similar areas in neighbouring states, both comparing the rural southwest to rural Iowa and Illinois, and Milwaukee to other Great Lakes industrial cities.
Milwaukee lost a little bit of its population, but, yes, it was no Cleveland. Of the Great Lakes states, Wisconsin might be the least dependent on manufacturing - that's my sense of the state, though I don't know if there's data to actually back up my impression.
Actually Wisconsin is second in the nation (http://factfinder.census.gov/servlet/ThematicMapFramesetServlet?_bm=y&-_MapEvent=displayBy&-errMsg=&-_useSS=N&-_dBy=040&-redoLog=false&-_zoomLevel=&-tm_name=ACS_2009_5YR_G00_M00670&-tm_config=|b=50|l=en|t=5309|zf=0.0|ms=thm_def|dw=1.9557697048764706E7|dh=1.4455689123E7|dt=gov.census.aff.domain.map.LSRMapExtent|if=gif|cx=-1159354.4733499996|cy=7122022.5|zl=10|pz=10|bo=|bl=|ft=350:349:335:389:388:332:331|fl=403:381:204:380:369:379:368|g=01000US|ds=ACS_2009_5YR_G00_|sb=49|tud=false|db=050|mn=0|mx=79.7|cc=1|cm=1|cn=5|cb=|um=Percent|pr=1|th=ACS_2009_5YR_G00_M00670|sf=N|sg=&-PANEL_ID=tm_result&-_pageY=&-_lang=en&-geo_id=01000US&-_pageX=&-_mapY=&-_mapX=&-_latitude=&-_pan=&-ds_name=ACS_2009_5YR_G00_&-_longitude=&-_changeMap=Identify#?366,200) by % of adults employed in manufacturing. But Milwaukee's flagship industry is less vulnerable to the replacement of workers by machines because, well, it is the replacement of workers by machines. (http://www.rockwellautomation.com/)
Yeah, maybe not. I would have expected Ohio to rank higher. For whatever reason, traveling through Wisconsin doesn't seem to give the same depressing feeling you get traveling through Upstate New York, Northern Ohio or Michigan.
Title: Re: Official US 2010 Census Results
Post by: cinyc on March 14, 2011, 04:44:18 PM
Alaska, Montana and New Mexico have shipped to legislators. Montana and New Mexico are expected to be released at 2PM Eastern tomorrow. Due to time zone differences, we'll likely have to wait until 2PM Wednesday for Alaska.
Title: Re: Official US 2010 Census Results
Post by: minionofmidas on March 15, 2011, 05:42:44 AM
Three states I was really looking forward to! :)
Title: Re: Official US 2010 Census Results
Post by: cinyc on March 15, 2011, 02:13:42 PM
Montana and New Mexico were released today:
Montana
Eastern Montana generally lost population, while Western Montana gained. On the county level, Gallatin (Bozeman) grew at the fastest rate of the top 20 counties, 32.0%. It also picked up the most new residents, over 20,000. Flathead (Kalispell/Whitehead/Part of Glacier National Park; +22.1%) was next, followed by Yellowstone (Billings; +14.4%), Missoula (+14.1%), Lewis and Clark (Helena; +13.8%), and Jefferson (South suburbs of Helena; +13.5%). Sanders County (+11.6%), west of Missoula on the Idaho border and home to part of the Flathead Indian Reservation, and Rivalli (Hamilton; +11.5%), south of Missoula along the Bitterroot Valey near the Idaho border, also grew faster than the state as a whole (+9.7%).
Among the top 20 counties, Hill (Havre/Canadian border;-3.5%), Fergus (Lewistown; -2.6%), Roosevelt (Culbertson/Fort Peck Indian Reservation; 1.8%), Silver Bow (Butte; -1.2%) and Park (Livingston/Part of Yellowstone NP; -0.4%) lost population.
Billings (+15.9%) remains the largest city in the state, with a population exceeding 100,000 for the first time in its history. It picked up the most new residents, over 14,000. The resort town of Kalispell (+40.1%) grew fastest among the top 20, followed by Bozeman (+35.5%), the Bozeman suburb of Belgrade (+29.0%), and two of Kalispell's Flathead Valley neighbors, Columbia Falls (+28.6%) and Whitefish (+26.3). Missoula grew by 17.1%. The state capital of Helena grew by 9.3%. Sidney (8.7%), Glendive (+4.4%) Great Falls (+3.2%) and Livingston (+2.8%) grew slower than the state as a whole. Havre (-3.2%), near the Canadian border, Anaconda-Deer Lodge (-1.3%) near Butte ,Butte-Silver Bow (-1.2%) itself, and Miles City (-0.9%) in eastern Montana all lost population.
Montana's non-Hispanic White population grew by 7.5%. Its Hispanic population increased by 58.0% to 2.9% of the population. Montana's non-Hispanic African American population increased by 47.7% and non-Hispanic Asian population by 34.3% - but to just 0.4% and 0.6% of the population, respectively. Montana's non-Hispanic American Indian population increased by 10.1% to 6.1%.
New Mexico
In general, New Mexico's fastest growth was in the Albuquerque-Santa Fe area, the Las Cruces-El Paso area, Farmington area and near the Texas border. Other counties were flat or even lost population.
The fastest-growing county was Sandoval (+46.3%), immediately north of Albuquerque. It picked up more residents than any county but Bernalillo (Albuquerque; +19.0%). Bernalillo gained over 105,000 residents in the past decade - more than live in all but 5 counties in the state. Other fast-growing counties include Las Cruces (19.8%), north of El Paso, Lea (Hobbs; +16.6%), on the Texas border, Valencia (+15.7%), immediately south of Albuquerque's county, and San Juan (Farmington; +14.3%), in the Northwest corner of the state. Santa Fe (+11.5%) and Roosevelt (Portales/Texas border; +10.1%) Counties also experienced double-digit growth, but grew more slowly than the state as a whole (+13.2%).
Many of the fastest-growing municipalities were Albuquerque suburbs. Rio Rancho in Sandoval County grew by 69.1%. South suburban Los Lunas village grew by 47.8% And Albuquerque itself grew by 21.7%, picking up more new residents than live in any other municipality but Las Cruces. Other growth areas included market towns in the rest of the state: Las Cruces (+31.4%), Farmington (+21.2%), Hobbs (+19.1%), Lovington (near Hobbs; +16.2%) and Clovis (+15.6%). Santa Fe (+9.2%), Gallup (+7.3%), Roswell (+6.8%) and Carlsbad (+2.0%) grew more slowly than the rest of the state, as did El Paso-suburban Sunland Park (+6.0%). Alamagordo (-14.6%), Las Vegas (-5.6%) and Silver City (-2.2%) lost population.
New Mexico has become plurality Hispanic. 46.3% of residents are Hispanic. 40.5% are non-Hispanic White. 8.5% are non-Hispanic American Indian. The non-Hispanic White population increased by 2.5%. The Hispanic population grew by 24.6%. Non-Hispanic American Indians were up by 8.6%. The Non-Hispanic Asian (+44.1%) and Non-Hispanic Black (+15.7%) populations grew faster than the state as a whole, but their numbers are still small - each under 2%.
Alaska shipped yesterday and will be released tomorrow. There's no word yet on which states (if any) shipped today.
Title: Re: Official US 2010 Census Results
Post by: cinyc on March 15, 2011, 03:35:22 PM
Minnesota, North Dakota and Tennessee shipped today. Those three states and Alaska should be released at 2PM Eastern tomorrow.
Title: Re: Official US 2010 Census Results
Post by: Sounder on March 15, 2011, 04:25:28 PM
The resort town of Kalispell (+40.1%) grew fastest among the top 20, followed by Bozeman (+35.5%), the Bozeman suburb of Belgrade (+29.0%), and two of Kalispell's Flathead Valley neighbors, Columbia Falls (+28.6%) and Whitefish (+26.3).
Great write up, but Kalispell isn't a resort town. Kalispell is the regional hub of NW Montana. Whitefish 15 miles north is the major resort town of the area. Lakeside and Bigfork on the Great Flathead Lake 15-20 miles south are smaller resort towns. Columbia Falls, despite being the closest major city to Glacier N.P. is an industrial town built around lumber mills and an aluminum plant.
Title: Re: Official US 2010 Census Results
Post by: cinyc on March 15, 2011, 04:40:59 PM
The resort town of Kalispell (+40.1%) grew fastest among the top 20, followed by Bozeman (+35.5%), the Bozeman suburb of Belgrade (+29.0%), and two of Kalispell's Flathead Valley neighbors, Columbia Falls (+28.6%) and Whitefish (+26.3).
Great write up, but Kalispell isn't a resort town. Kalispell is the regional hub of NW Montana. Whitefish 15 miles north is the major resort town of the area. Lakeside and Bigfork on the Great Flathead Lake 15-20 miles south are smaller resort towns. Columbia Falls, despite being the closest major city to Glacier N.P. is an industrial town built around lumber mills and an aluminum plant.
I tend to view the whole of Flathead County as a resort area. Yes, Whitefish is closer to the major ski resort and probably has better quality lodging, but Kalispell has a fair number of hotels and motels in its own right and a number of golf courses, plus is closer to Flathead Lake. I wouldn't doubt that Kalispell is more diverse economically. The Columbia Falls area seems to be spawning a bunch of tourism-related attractions and businesses, too, though perhaps not within city limits.
Title: Re: Official US 2010 Census Results
Post by: Sounder on March 15, 2011, 05:12:16 PM
I am sure the adjacent resort areas bring a lot of money into the area, but few would confuse Kalispell with a resort town. It's the hub city that supports the nearby resort and resource industrial towns. Hospital, "mall," community college, Costco, etc. Calling Kalispell a resort town would be like calling Wenatchee a resort town because it is 20 miles away from Mission Ridge, Entiat, and Leavenworth. Over the last decade, growth related industries (construction, real estate) were probably a more important driver of the economy than tourism. A lot of people are relocating to the area.
Title: Re: Official US 2010 Census Results
Post by: Dgov on March 15, 2011, 05:37:53 PM
New Mexico has become plurality Hispanic. 46.3% of residents are Hispanic. 40.5% are non-Hispanic White. 8.5% are non-Hispanic American Indian. The non-Hispanic White population increased by 2.5%. The Hispanic population grew by 24.6%. Non-Hispanic American Indians were up by 8.6%. The Non-Hispanic Asian (+44.1%) and Non-Hispanic Black (+15.7%) populations grew faster than the state as a whole, but their numbers are still small - each under 2%.
I wonder if this means that Whites are now a protected minority under the VRA section 5 (or 2 two, whichever governs Redistricting). Not that it really matters, as drawing 3 "fair" districts (1 in Albuquerque, 1 in North New Mexico, and 1 in Southern New Mexico) yields districts with approximately the same demographics (with the main difference being the northern one having a significant native population and correspondingly less whites).
Title: Re: Official US 2010 Census Results
Post by: minionofmidas on March 16, 2011, 08:45:51 AM
New Mexico
New Mexico has become plurality Hispanic. 46.3% of residents are Hispanic. 40.5% are non-Hispanic White. 8.5% are non-Hispanic American Indian. The non-Hispanic White population increased by 2.5%. The Hispanic population grew by 24.6%.
New Mexico has become plurality Hispanic. 46.3% of residents are Hispanic. 40.5% are non-Hispanic White. 8.5% are non-Hispanic American Indian. The non-Hispanic White population increased by 2.5%. The Hispanic population grew by 24.6%.
Title: Re: Official US 2010 Census Results
Post by: minionofmidas on March 16, 2011, 08:59:58 AM
Anybody know why Alamogordo's population fell? Cuts at the air force base?
Title: Re: Official US 2010 Census Results
Post by: cinyc on March 16, 2011, 10:34:48 AM
Anybody know why Alamogordo's population fell? Cuts at the air force base?
That would be my guess, at least in part. Wikipedia claims there were cuts to the German Air Force Flying Training Center there. But that cut alone wouldn't explain all of the 5,200 or so residents who left Alamogordo over the past decade. White Sands Missile Range and part of Fort Bliss are also in the area, though the more populated areas of Fort Bliss are closer to El Paso and the community of White Sands on the range is closer to Las Cruces.
Title: Re: Official US 2010 Census Results
Post by: Horus on March 16, 2011, 01:20:00 PM
Results for Minnesota are out now. Looks like blacks and asians both gained about 60%... and hispanics 70%. Highest overall population growth was in the western Minneapolis suburbs. Some of the northern counties held up better than I thought they would too. I'll wait on someone else to do a detailed analysis but those are some interesting figures.
Title: Re: Official US 2010 Census Results
Post by: danny on March 16, 2011, 01:23:05 PM
And both Minneapolis and St. Paul were almost flat, Minneapolis actually lost a total of just 40 people.
Title: Re: Official US 2010 Census Results
Post by: Nhoj on March 16, 2011, 01:28:53 PM
Results for Minnesota are out now. Looks like blacks and asians both gained about 60%... and hispanics 70%. Highest overall population growth was in the western Minneapolis suburbs. Some of the northern counties held up better than I thought they would too. I'll wait on someone else to do a detailed analysis but those are some interesting figures.
Title: Re: Official US 2010 Census Results
Post by: cinyc on March 16, 2011, 01:41:24 PM
And both Minneapolis and St. Paul were almost flat, Minneapolis actually lost a total of just 40 people.
St. Paul lost over 2,000 residents. Two larger Hennepin County suburbs also lost population, Bloomington, home of the Mall of America, and Minnetonka, in the western part of the county. Hennepin County itself gained population. St. Paul's County, Ramsey, lost population.
Alaska, North Dakota and Tennessee are also out. Memphis shrunk, but not by enough to be passed by Nashville-Davidson. The growth in the Mat-Su Valley of Alaska was very high. And Fargo is where it's at.
There will be more when I have a chance to write things up.
Title: Re: Official US 2010 Census Results
Post by: minionofmidas on March 16, 2011, 01:42:45 PM
Tennessee, North Dakota, Alaska also out. Memphis marginally lost population, Shelby County is majority black now (I think the estimates had been saying that since 2007 or so, though). State's Hispanic share more than doubled, to 4.6%. Nashville is 10% Hispanic.
Just 11 counties in North Dakota gained - including Fargo, Grand Forks, Bismarck and the reservations.
Just 11 counties in North Dakota gained - including Fargo, Grand Forks, Bismarck and the reservations.
Title: Re: Official US 2010 Census Results
Post by: minionofmidas on March 16, 2011, 01:53:37 PM
Okay, so the rises in Black population in Minnesota and North Dakota are a little strange. ND's actually doubled - its 2000 Black population was very largely affiliated with the air force bases.
Minnesota's is up from 3.4 to 5.1%, or by a hundred thousand people. That is, it's grown as fast as the Asian population percentagewise, and as fast as the Hispanic population in raw numbers.
Minnesota's is up from 3.4 to 5.1%, or by a hundred thousand people. That is, it's grown as fast as the Asian population percentagewise, and as fast as the Hispanic population in raw numbers.
Title: Re: Official US 2010 Census Results
Post by: Brittain33 on March 16, 2011, 01:57:04 PM
Okay, so the rises in Black population in Minnesota and North Dakota are a little strange. ND's actually doubled - its 2000 Black population was very largely affiliated with the air force bases.
Minnesota's is up from 3.4 to 5.1%, or by a hundred thousand people. That is, it's grown as fast as the Asian population percentagewise, and as fast as the Hispanic population in raw numbers.
Minnesota's is up from 3.4 to 5.1%, or by a hundred thousand people. That is, it's grown as fast as the Asian population percentagewise, and as fast as the Hispanic population in raw numbers.
A significant share of that number may be Somali, although the Internet gives conflicting estimates.
Title: Re: Official US 2010 Census Results
Post by: minionofmidas on March 16, 2011, 02:06:47 PM
Yeah, I recall that. Will be interesting to see ancestry breakdowns once they become available.
Title: Re: Official US 2010 Census Results
Post by: RBH on March 16, 2011, 02:07:40 PM
Shelby County, 2000: 48.4% Black NH, 46.2% White NH, 2.6% Hispanic
Shelby County, 2010: 49.48% Black NH, 42.2% White NH, 4.9% Hispanic
Memphis, 2000: 56.2% Black NH, 38.4% White NH, 2.9% Hispanic
Memphis, 2010: 60.1% Black NH, 31.5% White NH, 5.7% Hispanic
In case you were wondering.
Shelby County, 2010: 49.48% Black NH, 42.2% White NH, 4.9% Hispanic
Memphis, 2000: 56.2% Black NH, 38.4% White NH, 2.9% Hispanic
Memphis, 2010: 60.1% Black NH, 31.5% White NH, 5.7% Hispanic
In case you were wondering.
Title: Re: Official US 2010 Census Results
Post by: minionofmidas on March 16, 2011, 02:12:46 PM
Shelby County, 2010: 49.48% Black NH, 42.2% White NH, 4.9% Hispanic
Oh, and Memphis at 63.3% Black.
Title: Re: Official US 2010 Census Results
Post by: RBH on March 16, 2011, 02:29:33 PM
Shelby County, 2010: 49.48% Black NH, 42.2% White NH, 4.9% Hispanic
Oh, and Memphis at 63.3% Black.
I clicked the 18+ numbers.
And the numbers are 63.1% Black NH, 27.5% White NH.
Title: Re: Official US 2010 Census Results
Post by: cinyc on March 16, 2011, 02:45:25 PM
Alaska, Minnesota, North Dakota and Tennessee have been released:
Alaska
Alaska doesn't really have counties. Census uses Municipalities, Boroughs and Census Areas to describe regions. Among the top 20, Matanuska-Susitna Borough, Anchorage's northern exurbs, was the fastest-growing, up 50% from 2000. Surprisingly, North Slope Borough was next, up 27.7%. Estimates had shown a population decrease in oil country. Why there was a gain here is a bit of a conundrum - temporary oil workers working in Prudhoe Bay usually haven't counted as residents and North Slope's largest city, Barrow, actually lost population. Fairbanks-North Star Borough (+17.8%) was next, followed by its rural neighbor, Southeast Fairbanks Borough (+13.8%). Anchorage Municipality grew by 12.1%, slower than the state as a whole (+13.3%), but picked up more residents than any other county equivalent, even Mat-Su. Kenai Peninsula Borough (+11.5%), south of Anchorage, also experienced double-digit growth.
It appears that much of Southeast Alaska shrunk. Juneau City and Borough (+1.8%) and Sitka City and Borough (+0.5%) barely grew, while Ketchikan Gateway Borough (-4.2%) declined. Other geographic areas in Southeast Alaska weren't directly comparable due to incorporations and annexations.
Bush areas were mixed. The Yukon-Koyukuk Census Area, generally encompassing extremely rural areas of interior Alaska to the north and west of Fairbanks, lost 14.7% of its population. Valdez-Cordova Census Area (-5.5%), Kodiak Island Borough (-2.3%) and the Dillingham Census Area (-1.5%) on Bristol Bay lost population. Others not in the top 20 also lost population, including Bristol Bay, Lake and Peninsula Borough on the Alaska Peninsula that sticks out toward the Aleutians, and Yakutat in Southeast Alaska. On the other hand, some of the coastal bush county equivalents, including the Bethel Census Area (+6.3%), the Wade Hampton Census Area, south of Nome (+6.1%), Northwest Arctic Borough (Kotzebue; +4.4%), the Nome Census Area (+3.2%) and even the Aleutians West Census Area (+1.8%) grew, albeit more slowly than the state. The Aleutians East Census Area was too small to be in the top 20, but also grew from 15-30% - faster than the state.
On the municipal level, the fastest-growth among the top 20 incorporated places was in South Central Alaska, particularly in Mat-Su and Kenai Peninsula Boroughs. Sarah Palin's Wasilla was the fastest-growing incorporated place in the state, growing by 43.2%. Wasilla was followed by the city of Palmer, Mat-Su (+31.0%), Homer, at the end of the road in Kenai (+26.8%), and Anchorage (+12.1%). Bethel (+11.1%), the market town for much of rural southwest Alaska, and Soldotna, Kenai (+10.7%) also experienced double-digit growth. Fairbanks city grew by just 4.3%, but it was enough to pass Juneau city (+1.8%) and borough as second-largest in the state. The other larger municipalities in Southeast Alaska were stagnant or lost population. The city of Petersburg lost 8.6% of its population, while Sitka (+0.5%), Ketchikan (+1.6%) and Wrangell (+2.6%) were largely flat. Barrow (-8.1%), the northernmost city in America, Seward (-4.8%), at the end of the other road on the Kenai Peninsula, Kodiak (-3.2%), home to a Coast Guard base on Kodiak Island and the oil port city of Valdez (-1.5%) on Prince William Sound also lost population.
Alaska's non-Hispanic White population grew by 7.4%. Its Hispanic population blossomed by 51.8%, and non-Hispanic Asian population by just about as much - 51.4%. The non-Hispanic American Indian and Alaska Native Population grew by 6.3%. As a result, Alaska's non-Hispanic white population declined from 67.6% to 64.1% while its non-Hispanic Alaska Native population declined one point from 15.4% to 14.4%. The Hispanic and non-Hispanic Asian population both increased by 1.4 points. 5.5% of the state's population is Hispanic. 5.3% is non-Hispanic Asian.
Minnesota
Minnesota's growth was largely concentrated in Minneapolis-St. Paul's suburbs and exurbs, with a few exceptions. The fastest-growing of the top 20 counties in the state was MSP-southwest suburban Scott (+45.2%), followed by MSP-northwest suburban Wright (+38.6%) and Sherburne (+37.4%), MSP-northeast suburban Chisago (+31.1%) and MSP-east suburban Washington (+18.4%) - areas that BRTD will no doubt tell later us are all exurban hellholes. Two closer-in MSP suburban counties, Dakota (+12.0%) and Anoka (+11.0%) picked up around the same number of residents as some of these more exurban counties, but grew more slowly in percentage terms due to a higher population base, with Dakota County picking up the most new residents of any county in the state. At MSP's core, Hennepin County (Minneapolis) grew by 3.2%, while Ramsey County (St. Paul) lost 0.5% of its population.
Other rapid growth areas outside of the MSP suburbs/exurbs included Olmstead (Rochester; +16.1%), Clay (Moohead/Fargo; +15.2%), Blue Earth (Mankato; +14.4%), Crow Wing (Brainerd; +13.4%), Rice (Fairbault, south of MSP; +13.2%) and Stearns (St. Cloud; +13.1%) counties. St. Louis County (Duluth) lost 0.2% of its residents. Otter Tail County (+0.3%) barely grew - which is more than can be said about most smaller counties in southwestern Minnesota. Every county along the Canadian border except Cook lost population, with Lake of the Woods and Kittson leading the decline. Every county bordering the Dakotas except Clay and Polk lost population, as did every county along the Iowa border other than Nobels and Mower.
On the municipal level, the fastest-growers were again in the MSP suburbs and exurbs. Among the top 20 incorporated places, east-suburban Woodbury, Washington County lead the way with 33.4% growth. It was followed by south-suburban Lakeville, Dakota County (+29.7%), north-sububan Blaine, Anoka County (27.2%), and, within the MSP metro, northwest-suburban Maple Grove, Hennepin County (+22.2%). North-suburban Brooklyn Park, Hennepin County (+12.5%) and southwest-suburban Eden Prairie, Hennepin County (+10.7%) also experienced double-digit gains. Minneapolis (-0.0%) was flat, losing 40 residents. St. Paul (-0.7%) lost 2,083 residents. Some MSP suburbs like Bloomington (-2.7%) and Minnetonka (-3.1%) and Coon Rapids (-0.2%) lost population while others like Eagan (1.0%) and Edina (+1.1%) were flat.
Outside of the MSP metro, the city of Rochester grew the fastest among the top 20, at 24.4%. Rochester's population is now over 100,000, passing Duluth to become Minnesota's third largest city. St. Cloud (+11.4%) also grew.
Minnesota's non-Hispanic white population grew by 1.6%, much more slowly than the state as a whole (+7.8%). Its Hispanic population was up 74.5%, while its non-Hispanic black (+59.4%) and non-Hispanic Asian (+51.0%) also grew rapidly. Minnesota still has more non-Hispanic blacks than Hispanics of any race.
North Dakota
As Lewis Trondheim said, just 11 counties in North Dakota gained population. But they included the Williston and Dickinson areas of Western North Dakota and the Magic City of Minot as well as Fargo, Grand Forks, Bismarck and some reservations. Western North Dakota has seen an increase in oil and gas activity due to the discovery of recoverable oil in the Bakken formation.
Among North Dakota's 20 most populous counties, Cass (Fargo) grew the fastest, at a 21.6% clip. It also picked up the most new residents - over 26,000 - more than live in all but the top-5 North Dakota counties. Burleigh, home of the capital city of Bismarck, was next, growing at a 17.1% clip, followed by Mountrail (Stanley; +15.7%), in the western part of the state, Williams (Williston; 13.3%), Morton (Mandan; +8.6%), across the Missouri River from Bismarck, Stark (Dickinson; +6.9%), Ward (Minot; +4.9%), home to an Air Force Base in the north central part of the state, Rolette (+1.9%) on the Canadian border, home to Turtle Mountain Indian Reservation, and Grand Forks (+1.1%). McKenzie, across the Missouri River from Williston, home to a sliver of the Fort Berhold Indian Reservation was not in the top 20, but experienced double-digit growth. Sioux County, home of the Standing Rock Indian Reservation which straddles the border of the Dakotas, also grew.
Most counties lost population, among the top 20 counties, none more than Pembina (-13.7%), in the northeast corner of the state on the Canadian border. Walsh County, immediately to Pembina's south, lost 10.3%. Bottineau County (-10.1%) on the Canadian border also experienced a double-digit loss, as did many smaller, rural counties throughout the state.
On the municipal level, Horace a south Fargo suburb was the fastest-growing. Its population more than doubled, increasing by 165.6%, albeit from a tiny 2000 base of 915. West Fargo was the next fastest-growing, increasing its population by 72.9% - but from a much higher base of almost 15,000. The Bismarck-area suburb of Lincoln (+39.1%) and Fargo-area Casselton (+25.6%) were next, albeit also from very small bases. Williston (+17.6%) was next, followed by Fargo (+16.5%), which picked up more new residents than any other municipality. Minot (+11.8%) continued its "magic" growth. Dickinson (+11.1%) and Bismarck (+10.3%) grew by double-digits, while Bismarck's neighbor, Mandan (+9.6%) and Grand Forks (+7.1%) grew faster than the state (+4.7%). Most smaller cities not in metro areas or the Western part of the state, like Wahpeton (-9.6%), in the southeast corner of the state and Bottineau (-5.4%) lost population.
North Dakota's non-Hispanic White population grew by 1.5%. As previously mentioned, its non-Hispanic African American population (+105.3%) more than doubled, its non-Hispanic Asian population (+91.8%) almost did, and its Hispanic population (+73.0%) soared. But Hispanics still only comprise 2.0% of the state's population - and non-Hispanic Blacks and Asians closer to 1% each. North Dakota's non-Hispanic American Indian population grew by 15.6%.
Title: Re: Official US 2010 Census Results
Post by: cinyc on March 16, 2011, 05:30:56 PM
Tennessee
All but 8 of Tennessee's counties grew. The net losers were largely small and rural; the biggest net gainers were largely in the Nashville, Knoxville and, to a lesser extent, Chattanooga, Tri-Cities and Memphis areas.
The fastest-growing county in percentage terms was south-Nashville suburban Williamson County (+44.7%). Williamson's immediate eastern neighbor, Rutherford (+44.3%) was a very close second, picking up the most new residents in the state - over 80,000. Other Middle Tennesee counties near Nashville followed, including west-Nashville suburban Wilson (+28.4%), Montgomery (Clarksville; +27.9%), northeast-suburban Sumner (+23.1%), north-suburban Robertson (+21.8%), south-exurban Maury County (Spring Hill/Columbia; +16.5%) and Putnam County (Cookeville; +16.1%). Nashville-Davidson County (+10.0%) grew more slowly that the state as a whole (+11.5%), but picked up more new residents than all but Rutherford County - almost 57,000.
Outside of Middle Tennessee, Sevier County (+26.3%), home of Pigeon Forge, Gatlinburg, Dollywood and some Knoxville suburbs, grew fastest. In the Knoxville area, south Knoxville-suburban Blount County (+16.2%) and Knox County (+13.1%), home of Knoxville and the University of Tennessee, also experienced double-digit growth. Elsewhere in the state Washington County (Johnson City/Tri-Cities region; +14.7%) and Bradley County (Cleveland; +12.5%), near Chattanooga, experienced double-digit growth. Chattanooga's county, Hamilton, grew by 9.3%. Memphis' county, Shelby, grew by 3.4%. Two of Shelby County's neighbors - Fayette and Tipton - experienced double-digit growth but didn't make the top-20 county list. Fayette grew by 30% or more.
On the municipal level, Memphis shrunk by 0.5%, or about 3,200 residents. Nashville-Davidson grew by 10.0%, picking up more residents than any other city in the state, and ending up about 20,200 residents short of passing Memphis. Nashville-area suburbs grew fastest, particularly those to the city's south, including La Vergne, Rutherford County (+74.4%), Brentwood, Williamson County (+58.1%), Murfreesboro, Rutherford County (+58.0%), Smyrna, Rutherford County (+56.3%) and Franklin, Williamson County (+49.3%). Hendersonville, Sumner County grew by 26.5%. The Memphis suburbs of Collierville (+37.9%) and Bartlett (+34.7%) also experienced rapid growth, as did the Middle Tennessee cities of Clarksville (28.2%) and Cookeville (+27.2%). Johnson City (+13.9%) grew faster than the state as a whole, while its Tri-Cities colleague, Kingsport (+7.3%) lagged. Chattanooga (+7.8%) and Knoxville (+2.9%)proper also fell behind the state's growth rate, while the Chattanooga area city of Cleveland (+11.0%) more or less kept pace.
Tennessee's non-Hispanic White population also lagged the state, but grew by 6.5%. Its Hispanic population more than doubled (+134.2%) to 4.6% of the total population, while Tennessee's non-Hispanic Asian population grew by a respectable 61.0% to 1.4%. Tennesse's non-Hispanic black population grew by 13.1%.
---------------
Florida, Georgia and Kentucky have shipped to state legislators, and will be released to the rest of us around 2 PM tomorrow.
Title: Re: Official US 2010 Census Results
Post by: minionofmidas on March 16, 2011, 05:45:13 PM
the smallest growing major county in the state wasn't Shelby though, that was Sullivan (the main Tri-Cities county) at the extreme other end of the state.
Title: Re: Official US 2010 Census Results
Post by: cinyc on March 16, 2011, 05:55:57 PM
the smallest growing major county in the state wasn't Shelby though, that was Sullivan (the main Tri-Cities county) at the extreme other end of the state.
True.
I didn't bother listing the more slowly growing major Tennessee counties or cities - the write-up is long enough, already. All of the top 20 Tennessee counties gained population. All of the top 20 municipalities also gained population, except Memphis. It's not North Dakota. Also, I missed fast-growing Smyrna in the initial write-up, That's been fixed.
Title: Re: Official US 2010 Census Results
Post by: cinyc on March 16, 2011, 07:30:30 PM
North Slope Borough, Alaska's gain seems to be due to people declaring residency in Prudhoe Bay, CDP. The CDP's population grew 43,380%, from 5 residents in 2000 to 2,174 residents in 2010. The CDP had 47 residents in 1990. There haven't been any recent estimates.
I'm not exactly sure what's going on there. I doubt the CDP has many permanent residents - just oil field workers who rotate out of the area every few weeks. If they weren't considered residents in 2000, I don't know why they would be in 2010. Further investigation is required.
I'm not exactly sure what's going on there. I doubt the CDP has many permanent residents - just oil field workers who rotate out of the area every few weeks. If they weren't considered residents in 2000, I don't know why they would be in 2010. Further investigation is required.
Title: Re: Official US 2010 Census Results
Post by: Horus on March 16, 2011, 10:02:33 PM
Updated Map
()
()
Title: Re: Official US 2010 Census Results
Post by: I spent the winter writing songs about getting better on March 16, 2011, 11:11:35 PM
I don't think it's just Somalis, we've had an influx of blacks from Chicago here lately. I'm more interested in the breakdown within Minneapolis and St. Paul really...
North Dakota doesn't surprise me, that Somalis have been drifting to Fargo has been a well known fact there for awhile.
North Dakota doesn't surprise me, that Somalis have been drifting to Fargo has been a well known fact there for awhile.
Title: Re: Official US 2010 Census Results
Post by: cinyc on March 16, 2011, 11:25:33 PM
I don't think it's just Somalis, we've had an influx of blacks from Chicago here lately. I'm more interested in the breakdown within Minneapolis and St. Paul really...
North Dakota doesn't surprise me, that Somalis have been drifting to Fargo has been a well known fact there for awhile.
North Dakota doesn't surprise me, that Somalis have been drifting to Fargo has been a well known fact there for awhile.
Without taking into account Hispanic status, 19.4% of Minneapolis residents are black. St. Paul is 16.4% black.
Hennepin and Ramsey Counties are home to about 31% of Minnesota's population and 70% of the state's African-Americans.
Title: Re: Official US 2010 Census Results
Post by: memphis on March 16, 2011, 11:48:12 PM
FYI, Memphis had a sizeable annexation back in 2003, which masks what would have been a larger decline. We've been playing this game for decades. In 1910, Memphis was 18 sq mi. We're now at 314 sq mi, which is larger than the combined dry land parts of New York City. Without annexations, we'd have a longterm population decline comparable to or even worse than St. Louis.
Title: Re: Official US 2010 Census Results
Post by: minionofmidas on March 17, 2011, 12:39:54 AM
North Slope Borough, Alaska's gain seems to be due to people declaring residency in Prudhoe Bay, CDP. The CDP's population grew 43,380%, from 5 residents in 2000 to 2,174 residents in 2010. The CDP had 47 residents in 1990. There haven't been any recent estimates.
I'm not exactly sure what's going on there. I doubt the CDP has many permanent residents - just oil field workers who rotate out of the area every few weeks. If they weren't considered residents in 2000, I don't know why they would be in 2010. Further investigation is required.
I'm not exactly sure what's going on there. I doubt the CDP has many permanent residents - just oil field workers who rotate out of the area every few weeks. If they weren't considered residents in 2000, I don't know why they would be in 2010. Further investigation is required.
Title: Re: Official US 2010 Census Results
Post by: cinyc on March 17, 2011, 01:02:53 AM
North Slope Borough, Alaska's gain seems to be due to people declaring residency in Prudhoe Bay, CDP. The CDP's population grew 43,380%, from 5 residents in 2000 to 2,174 residents in 2010. The CDP had 47 residents in 1990. There haven't been any recent estimates.
I'm not exactly sure what's going on there. I doubt the CDP has many permanent residents - just oil field workers who rotate out of the area every few weeks. If they weren't considered residents in 2000, I don't know why they would be in 2010. Further investigation is required.
I'm not exactly sure what's going on there. I doubt the CDP has many permanent residents - just oil field workers who rotate out of the area every few weeks. If they weren't considered residents in 2000, I don't know why they would be in 2010. Further investigation is required.
The oil fields don't stop running on April 1. I'm sure that more than 5 people were there on April 1, 2000.
A similar thing happened in Red Dog Mine CDP. Its 2000 population was 32. Its 2010 population was 309.
Prudhoe Bay CDP, Red Dog Mine CDP in Northwest Arctic Borough, Port Clarence CDP in the Nome census area and Attu Station CDP in Aleutians West Borough all have residents but no households. The population of the last two areas was in the 20s in both 2000 and 2010, though.
Title: Re: Official US 2010 Census Results
Post by: minionofmidas on March 17, 2011, 01:13:42 AM
Yeah, it might have been something irregular though. Or just something about the time people's contracts expired and where they were from exactly.
Or perhaps more likely just a minor change to residency rules (I think there was one... anyways there was a new more detailed leaflet on what constitutes residency) that affected these places.
Or perhaps more likely just a minor change to residency rules (I think there was one... anyways there was a new more detailed leaflet on what constitutes residency) that affected these places.
Title: Re: Official US 2010 Census Results
Post by: minionofmidas on March 17, 2011, 01:17:57 AM
2000 text (http://www.census.gov/population/www/censusdata/resid_rules.html#noninst)
2010 text (http://www.census.gov/population/www/cen2010/resid_rules/resid_rules.html)
2010 text (http://www.census.gov/population/www/cen2010/resid_rules/resid_rules.html)
Title: Re: Official US 2010 Census Results
Post by: cinyc on March 17, 2011, 02:30:58 AM
Yeah, it might have been something irregular though. Or just something about the time people's contracts expired and where they were from exactly.
Or perhaps more likely just a minor change to residency rules (I think there was one... anyways there was a new more detailed leaflet on what constitutes residency) that affected these places.
Or perhaps more likely just a minor change to residency rules (I think there was one... anyways there was a new more detailed leaflet on what constitutes residency) that affected these places.
Perhaps workers are longer working 2-weeks on, 2-weeks off with vacation, but something that makes them be in Prudhoe for 183 days or more.
The big winner from all this will be HD-40. It's just 1.35% short of the 2010 ideal HD population and, unlike most Bush areas, won't need to pick up much new territory.
Southeast Alaska got absolutely hammered, at least relative to the rest of the state and
perhaps even in absolute terms. HDs 1-5 now only have the population for about 4.2 districts. If you exclude Yakutat, the whole panhandle pretty much neatly fits in 4 districts. Mat-Su is entitled to 5 seats and Anchorage about 16.5.
I might make some Alaska maps tomorrow if I have time.
Title: Re: Official US 2010 Census Results
Post by: cinyc on March 17, 2011, 04:04:37 PM
Florida, Georgia and Kentucky were released today.
Florida
All but two of Florida's counties grew in the past decade: Pinellas (St. Petersburg/Clearwater; -0.5%), which lost almost 5,000 residents, and Monroe, a.k.a. the Florida Keys, which lost 8.2% of its population. Growth elsewhere was generally pretty solid, with a few exceptions. The fastest-growing counties were Flagler (Palm Coast) in North Florida, nestled between Daytona Beach and Jacksonville and Sumter in the central part of the state, northwest of Orlando and northeast of Tampa. Sumter County is home to the Villages, Florida's friendliest hometown for active snowbird retirees. Both counties are not in the top 20. Without downloading more data, all I can say is that they grew from 60-92%.
16.
Among the top 20 counties, the big three Miami metro counties, Miami-Dade (+10.8%), Broward (+7.7%) and Palm Beach (+16.7%) lagged the state as a whole (+17.6%). Growth in the Tampa Bay-area counties was mixed. Hillsborough (Tampa; 23.1%) grew faster than the state, while Pinellas (-0.5%), on the far side of Tampa Bay shrunk and the far-flung northern exurbs in Pasco County (+34.8%) grew faster than most. On the south side of the bay, Bradenton's county, Manatee (+22.3%) outpaced the state while Sarasota County (+16.4%) slightly lagged. And the Orlando area clearly shined: Orange County (Orlando) blossomed by 27.8%, while its Lake County (+41.1%) suburbs and exurbs grew even more rapidly. Polk County (+24.4%), along the I-4 corridor in between Tampa and Orlando, also experienced healthy growth. But Orlando's northeastern suburbs and exurbs in Seminole County (+15.8%) grew slightly more slowly than the rest of the state. Osceola County,(Kissimmee), which includes part of the Disney World complex, also experienced very rapid growth (30 to 59.9%), but still isn't among Florida's top 20 counties. In the Jacksonville area, Duval County (Jacksonville; 11.1) grew more slowly than the state, which might be offset by very rapid growth (30 to 59.9%) in suburban/exurban areas immediately to the south of Duval in, Clay and St. Johns (St. Augustine) counties. Both counties are too small to be in the top 20.
Outside of the major metros, mid-Atlantic coast St. Lucie County (Fort Pierce/Port St. Lucie; 44.2%) was the fastest-growing county of the top 20. The Daytona Beach area/Voluisa County (+11.6%) and Space Coast/Brevard County (+14.1%) lagged the state, while the Ocala Area/Marion County (+28.0%) grew faster than it. And Southwest Florida's main counties, Lee (Fort Myers; +40.3%) and Collier (Naples; +27.9%) boomed despite the housing bust. Pensacola-area growth was extremely weak, with Escambia County (+1.1%) barely growing. Other panhandle counties, especially Walton and Wakulla, may have fared better - but they are too small to be in the top 20.
Hillsborough and Orange Counties are now home to over 1,000,000 residents. Orange County gained the most new residents - almost 250,000, closely followed by Miami-Dade and Hillsborough.
On the municipal level, the most rapid growth among the top 20 cities was in Port St. Lucie (+85.4%), adding over 75,000 new residents. Only Jacksonville (+11.7%), Florida's largest city, added more new residents the past decade. Other big gainers included the Broward County suburb of Miramar (+67.8%), Southwest Florida's Cape Coral (+50.9%) and the college town of Gainesville (+30.3%). Palm Bay (+29.9%), Orlando (+28.2%), Pompano Beach, Broward County (+27.7%), West Palm Beach (+21.7%) and Tallahassee (+20.4%) all grew more rapidly than the state. St. Petersburg (-1.4%) and Clearwater (-1.0%) in Tampa Bay's Pinnelas County and Hialeah, Miami-Dade County (-0.8%) lost population. Tampa (+10.6%), Miami (+10.2%) and Fort Lauderdale (+8.6%) grew, but lagged the state as a whole.
Florida's non-Hispanic white population grew by just 4.1%. Its Hispanic population increased by 57.4%. As a result, the non-Hispanic white share of the population dropped from 65.4% to 57.9%, while Hispanics grew from 16.8% to 22.5%. Florida's non-Hispanic Asian population grew even more rapidly than its Hispanic population - 70.1%, albeit from a much lower base. Its non-Hispanic black population grew 25.9%.
Georgia
As expected, the fastest-growing Georgia counties are largely second-ring suburbs and exurbs of Atlanta far outside of the I-285 Perimeter. Northeast-exurban Forsyth County lead the pack, growing by 78.4%. Although Forsyth is becoming more diverse as it grows, it is still 85% white (before taking into account Hispanic status). The county has more than double the number of Asians as African Americans, and about as Hispanics as members of both of those groups combined. Northwest-exurban Paulding County was next, growing by 74.3%. Paulding was closely followed by Southeast exurban Henry County (+70.9%), as the Atlanta metro sprawled further up and down the I-75 corridor. North-exurban Cherokee County (+51.1%), West-exurban Douglas (+43.6%), and Southwest-exurban Coweta (+42.7%) also posted impressive growth rates. But the most impressive growth occurred in Northeast-suburban Gwinnett County. Gwinnett grew by 36.9%, picking up over 216,000 new residents - more people than live in all but the top 6 counties of the state. It leaped past its inner-ring suburban neighbor, DeKalb County, which grew at an anemic 3.9% rate, to become the second-largest county in the state. Unlike Forsyth, Gwinnett is racially diverse - 53% white, 24% black and 11% Asian (before taking into account Hispanic status). 20% of Gwinnett is Hispanic - higher than any other large county in the Atlanta Metro other than its immediate northeast neighboring county, Hall (+29.0%). Carroll County, on the Alabama border the far western Atlanta exurbs, grew by 26.7%. And even more further-flung exurban counties like Newton and Barrow grew by over 50%, but are still too small to crack the top 20. And counties neighboring the currently fastest-growing counties also grew rapidly.
The core counties of the Atlanta metro - Fulton (Atlanta; +12.8%), DeKalb, Cobb (Marietta; +13.2%) and Clayton (+9.6%) by the Atlanta Airport all grew more slowly than the state as a whole (+18.3%).
Outside of the Atlanta Metro, Augusta-suburban Columbia (+38.9%) and Houston County (+26.3%), south of Macon, home to Warner-Robbins and its air force base, were the only top-20 counties that grew faster than the state. Augusta's county, Richmond (+0.4%), Macon's county, Bibb (1.1%), and Columbus' county, Muscogee (+1.9%) were flat. Clarke County (+15.0%), home of Athens and the University of Georgia, grew slightly more slowly than the rest of the state. A number of Southwestern Georgia's counties lost population, while a handful of smaller counties neighboring Savannah and Brunswick's home counties grew by more than 25%.
On the municipal level, Atlanta grew by just 0.8%, but is still more than double the size of Augusta-Richmond (+0.4%), its closest, equally stagnant rival. In fact, many of Georgia's older cities didn't grow much or even lost population. East Point, near the Atlanta Airport, lost 14.9% of its population. Macon lost more residents than East Point but only 6.1% of its population. Marietta, Cobb County lost 3.7%. Columbus (+1.9%), Savannah (+3.6%) and Rome (+3.8%) posted anemic growth. Alpharetta (+65.1%), a rich Fulton County suburb grew fastest among the top 20, followed by Dunwoody, Gwinnett County (+41.0%), Warner Robbins (+36.1%), Gainesville, Hall County (+32.2%) and Smyrna, Cobb County (+25.1%). Valdosta (+24.7%) in Southern Georgia also grew - though, as with Smyrna, it is unclear to me whether some of that growth was due to annexation.
Georgia's non-Hispanic white population increased by 5.6%, dropping to 55.9%. Its Hispanic population almost doubled (+96.1%) to 8.8%, as did its non-Hispanic Asian population (+81.7%). Non-Hispanic African American growth outpaced the state, too, growing by 24.8%. Georgia is now 30.0% non-Hispanic black. VAP is 28.8%.
Title: Re: Official US 2010 Census Results
Post by: JohnnyLongtorso on March 17, 2011, 05:35:20 PM
FL-03, Corrine Brown's gerrymandered monstrosity, is now majority-black.
Title: Re: Official US 2010 Census Results
Post by: Padfoot on March 17, 2011, 05:46:39 PM
Is it possible that there will be 6 majority Hispanic districts? 22.5% of 27 is just over 6 seats. I'm thinking there will have to be 4 Hispanic districts in the Miami area but I'm not sure that Hispanics are densely populated enough outside of that area to get a 5th or 6th seat elsewhere in the state.
Title: Re: Official US 2010 Census Results
Post by: Brittain33 on March 17, 2011, 05:56:51 PM
If you divide Florida along the southern border of districts 5, 8, and 24, that neatly divides the excess population for two districts between either half of the state.
It looks like one new district in central Florida, not far from (but not near) Orlando, and perhaps a Gulf Coast district that sends 16 and 25 back to the Atlantic Ocean or moves 13 up a little bit to the north.
Or maybe a new D district is created in Orlando and Webster still has a district nearby he can represent when they clean up the mess of the old gerrymander to put FL-24 in there.
Title: Re: Official US 2010 Census Results
Post by: cinyc on March 17, 2011, 06:34:50 PM
Is it possible that there will be 6 majority Hispanic districts? 22.5% of 27 is just over 6 seats. I'm thinking there will have to be 4 Hispanic districts in the Miami area but I'm not sure that Hispanics are densely populated enough outside of that area to get a 5th or 6th seat elsewhere in the state.
Orange plus Polk plus Hillsborough Counties in the I-4 corridor contain about as many Hispanics as would be necessary for one full 100% Hispanic district - before taking into account VAP. I have no idea whether Central Florida's Hispanics are concentrated enough to draw a district. Probably not - but it might be possible.
Title: Re: Official US 2010 Census Results
Post by: cinyc on March 17, 2011, 07:34:37 PM
Kentucky
How did we all miss the story of Louisville's phenomenal growth? The city grew by 189.2%.... by creating a metro government with Jefferson County in the past decade. Jefferson County itself grew by 6.8%, a little bit more slowly than Kentucky as a whole (+7.4%). It picked up over 47,000 new residents, more than any other county in the state.
Kentucky's real more rapid growth was largely in the outer areas of the Louisville, Lexington and Cincinnati metros. Scott County (Georgetown; 42.7%), home of Toyota's largest plant outside of Japan, grew fastest among the top 20 counties. It is immediately north of Lexington. Scott was followed by the county where people land when they fly into "Cincinnati", Boone County (+38.2%), which picked up the second-most new residents. Northeast Louisville-suburban Oldham County (+30.6%) was next, followed in the three metros by Jessamine County (+24.4%), south of Lexington, and Louisville south-suburban Bullitt County (+21.4%). In the Lexington area, both Madison County (+17.0%), southeast of Lexington and Lexington's Fayette County (+13.5%) experienced double-digit growth.
Outside of the metros, Warren County (+23.0%), home of Bowling Green, Western Kentucky University and every Corvette ever made, Hardin County (+12.1%), home of Elizabethtown and the gold that may or may not be in Fort Knox, and Southeastern Kentucky's Pulaski (Somerset; +12.2%) and Laurel counties (London; +11.6%) also experienced double-digit growth. The rest of Southeastern Kentucky wasn't so lucky. Many counties in Appalachian Kentucky lost population, for example, among the state's top 20, Pike (Pikeville; -5.4%) and Boyd (Ashland; -0.4%) both lost population. Out west, Paducah's McCracken County (+0.1%) and Owensboro's Daviess County (+5.6%) grew more slowly than the state.
On the municipal level, Louisville/Jefferson (+189.2%) consolidated its way into becoming the largest city in the state, passing Lexington-Fayette, which grew by 13.5%. Cincinnati-suburban Independence (+65.2%) grew the fastest among the others, followed by Toyota's Georgetown (+60.9%), Lexington-area Nicholasville (+42.4%), Cincinnati-suburban Florence (+27.2%), Bowling Green (+17.8%) and Lexington-area Richmond (+15.5%). Six of Kentucky's top 20 cities lost population: the state capital of Frankfort (-8.0%), Cincinnati-area Covington (-6.3%), Paducah (-4.9%), Ashland (-1.4%), Radcliff (-1.2%), adjacent to Fort Knox, and Louisville suburb Jeffersontown (-0.1%) - though I'm confused as to how it exists if Louisville and Jefferson County consolidated.
Kentucky's non-Hispanic white population increased by 3.8%. Its Hispanic population more than doubled (+121.6%), albeit to only 3.1% from a relatively small base. Kentucky's non-Hispanic Asian population grew by 64.6%. Its non-Hispanic African-American population grew by 13.4%, increasing from 7.3% to 7.7%. Over half of the state's African American population lives in two cities: Louisville/Jefferson and Lexington-Fayette.
---------
The remaining states will be released next week: Maine, Massachusetts, Michigan, New Hampshire, New York, Rhode Island, South Carolina and West Virginia. We'll also get data for D.C. and Puerto Rico. Census will beat the April 1 deadline.
Title: Re: Official US 2010 Census Results
Post by: Linus Van Pelt on March 17, 2011, 08:15:40 PM
Something quite weird happened with the city of Atlanta - the estimated growth for the decade is so wildly off it makes me wonder: was there a secession to form a new municipality in the last couple of years?
2000 census - 416,474
2001 estimate - 430,684
2002 estimate - 442,538
2003 estimate - 456,919
2004 estimate - 468,725
2005 estimate - 483,108
2006 estimate - 498,496
2007 estimate - 520,368
2008 estimate - 537,958
2010 census - 420,003
2000 census - 416,474
2001 estimate - 430,684
2002 estimate - 442,538
2003 estimate - 456,919
2004 estimate - 468,725
2005 estimate - 483,108
2006 estimate - 498,496
2007 estimate - 520,368
2008 estimate - 537,958
2010 census - 420,003
Title: Re: Official US 2010 Census Results
Post by: Nhoj on March 17, 2011, 08:25:07 PM
Something quite weird happened with the city of Atlanta - the estimated growth for the decade is so wildly off it makes me wonder: was there a secession to form a new municipality in the last couple of years?
2000 census - 416,474
2001 estimate - 430,684
2002 estimate - 442,538
2003 estimate - 456,919
2004 estimate - 468,725
2005 estimate - 483,108
2006 estimate - 498,496
2007 estimate - 520,368
2008 estimate - 537,958
2010 census - 420,003
2000 census - 416,474
2001 estimate - 430,684
2002 estimate - 442,538
2003 estimate - 456,919
2004 estimate - 468,725
2005 estimate - 483,108
2006 estimate - 498,496
2007 estimate - 520,368
2008 estimate - 537,958
2010 census - 420,003
Title: Re: Official US 2010 Census Results
Post by: cinyc on March 17, 2011, 08:32:12 PM
Something quite weird happened with the city of Atlanta - the estimated growth for the decade is so wildly off it makes me wonder: was there a secession to form a new municipality in the last couple of years?
2000 census - 416,474
2001 estimate - 430,684
2002 estimate - 442,538
2003 estimate - 456,919
2004 estimate - 468,725
2005 estimate - 483,108
2006 estimate - 498,496
2007 estimate - 520,368
2008 estimate - 537,958
2010 census - 420,003
2000 census - 416,474
2001 estimate - 430,684
2002 estimate - 442,538
2003 estimate - 456,919
2004 estimate - 468,725
2005 estimate - 483,108
2006 estimate - 498,496
2007 estimate - 520,368
2008 estimate - 537,958
2010 census - 420,003
I don't think so. Some previously unincorporated areas in North Fulton County did incorporate, but they weren't within city limits.
It sounds like the same type of problem Census had with Omaha's estimates. A lot of unincorporated Fulton and DeKalb counties has or had Atlanta zip codes. I wonder if that's screwing up the estimates.
FWIW, the 2009 ACS estimate pegged Atlanta's population 50% black, 43% white (including Hispanics). It's actually about 54% black, 38% white. They got the 5% Hispanic part right.
It's still a growth in the relative white percentage from 2000 - 33% to 38%. Given that the city was otherwise stagnant, its black population must be falling.
Title: Re: Official US 2010 Census Results
Post by: cinyc on March 17, 2011, 10:06:36 PM
One other note on the Atlanta area, from the Atlanta Journal-Constitution (http://www.ajc.com/news/blacks-hispanics-lead-metro-875918.html):
In other words, there is white flight from the closer-in suburbs to both Atlanta and the more far-flung counties of the metro.
Quote
The metro area's white population was just as fluid. Clayton, DeKalb, Cobb and Gwinnett counties all lost white residents, while Fulton, Henry, Paulding, Forsyth and Cherokee saw increases in the number of white residents.
But the losses were stark. Clayton's white population plummeted from 82,637 to 36,610, a 56 percent decline. Cobb's white population fell 7.3 percent, DeKalb's dropped 5 percent and Gwinnett's decreased by 10 percent.
But the losses were stark. Clayton's white population plummeted from 82,637 to 36,610, a 56 percent decline. Cobb's white population fell 7.3 percent, DeKalb's dropped 5 percent and Gwinnett's decreased by 10 percent.
In other words, there is white flight from the closer-in suburbs to both Atlanta and the more far-flung counties of the metro.
Title: Re: Official US 2010 Census Results
Post by: memphis on March 17, 2011, 10:33:47 PM
One other note on the Atlanta area, from the Atlanta Journal-Constitution (http://www.ajc.com/news/blacks-hispanics-lead-metro-875918.html):
In other words, there is white flight from the closer-in suburbs to both Atlanta and the more far-flung counties of the metro.
Quote
The metro area's white population was just as fluid. Clayton, DeKalb, Cobb and Gwinnett counties all lost white residents, while Fulton, Henry, Paulding, Forsyth and Cherokee saw increases in the number of white residents.
But the losses were stark. Clayton's white population plummeted from 82,637 to 36,610, a 56 percent decline. Cobb's white population fell 7.3 percent, DeKalb's dropped 5 percent and Gwinnett's decreased by 10 percent.
But the losses were stark. Clayton's white population plummeted from 82,637 to 36,610, a 56 percent decline. Cobb's white population fell 7.3 percent, DeKalb's dropped 5 percent and Gwinnett's decreased by 10 percent.
In other words, there is white flight from the closer-in suburbs to both Atlanta and the more far-flung counties of the metro.
Same thing going on here. Pretty much all the suburban areas that were white middle class neighborhoods a few decades ago are now heavily black with a small white minority that is "stuck" living there. Most whites there have moved further out. Wealthy white inner city neighborhoods are still white and wealthy with no signs that's going to change. Some have gotten even fancier with teardowns and McMansions popping up. Plus there's all the new condos downtown.
Title: Re: Official US 2010 Census Results
Post by: minionofmidas on March 17, 2011, 11:22:42 PM
Phoenix' inner white areas shrunk and were 10% below estimates. That may also be a similar phenomenon.
Title: Re: Official US 2010 Census Results
Post by: Southern Senator North Carolina Yankee on March 18, 2011, 10:47:06 PM
FL-03, Corrine Brown's gerrymandered monstrosity, is now majority-black.
So does that give it VRA protection then?
Title: Re: Official US 2010 Census Results
Post by: minionofmidas on March 19, 2011, 07:24:20 AM
FL-03, Corrine Brown's gerrymandered monstrosity, is now majority-black.
So does that give it VRA protection then?
Title: Re: Official US 2010 Census Results
Post by: jimrtex on March 19, 2011, 01:08:48 PM
FL-03, Corrine Brown's gerrymandered monstrosity, is now majority-black.
So does that give it VRA protection then?
Title: Re: Official US 2010 Census Results
Post by: jimrtex on March 19, 2011, 01:32:31 PM
Something quite weird happened with the city of Atlanta - the estimated growth for the decade is so wildly off it makes me wonder: was there a secession to form a new municipality in the last couple of years?
2000 census - 416,474
2001 estimate - 430,684
2002 estimate - 442,538
2003 estimate - 456,919
2004 estimate - 468,725
2005 estimate - 483,108
2006 estimate - 498,496
2007 estimate - 520,368
2008 estimate - 537,958
2010 census - 420,003
2000 census - 416,474
2001 estimate - 430,684
2002 estimate - 442,538
2003 estimate - 456,919
2004 estimate - 468,725
2005 estimate - 483,108
2006 estimate - 498,496
2007 estimate - 520,368
2008 estimate - 537,958
2010 census - 420,003
I don't think so. Some previously unincorporated areas in North Fulton County did incorporate, but they weren't within city limits.
It sounds like the same type of problem Census had with Omaha's estimates. A lot of unincorporated Fulton and DeKalb counties has or had Atlanta zip codes. I wonder if that's screwing up the estimates.
FWIW, the 2009 ACS estimate pegged Atlanta's population 50% black, 43% white (including Hispanics). It's actually about 54% black, 38% white. They got the 5% Hispanic part right.
It's still a growth in the relative white percentage from 2000 - 33% to 38%. Given that the city was otherwise stagnant, its black population must be falling.
All of a sudden the 2009 ACS jumped, so that the 2005-2009 ACS is higher than all but 2009. And it also produced a jump in the 3-year ACS (I assume that the Census Bureau compensated for the missing group quarters from 2005, eg so that 2005-2009 is based on 4 years of group quarters, and 5 years of households).
I tried to compare census tract from 2005-2009 ACS to the 2010 census, but it was pretty messy. I ended up using census tracts from DeKalb and Fulton counties, and consolidating on the base tract number. This produces some super core-tracts in high growth areas where the tracts have been subdivided. But if the low number tracts that haven't been divided are the same, the ACS was way higher (50% in some cases).
If you throw out the 2009 ACS, and the estimates, the census is not that much lower.
By the way, the Consolidated Statistical Area for Atlanta is now a GA-AL area.
Title: Re: Official US 2010 Census Results
Post by: Southern Senator North Carolina Yankee on March 20, 2011, 01:25:07 AM
FL-03, Corrine Brown's gerrymandered monstrosity, is now majority-black.
So does that give it VRA protection then?
Really? Do you think I am that stupid. I think its legitimate expectation for you not assume that I don't understand what the hell is supposed to be protected by the VRA. ::) The clear fact is the VRA is used constantly to indeed protect districts and even congressmen that "technically" shouldn't be. My question was meant to find out whether that will effect how her district is treated in regards to the new Florida redistricting requirements. I don't give a damn what fallacy it perpetuates, if people are stupid enough to 1) not know its intended purpose, and 2) make an assumption of its purpose based on a simple one line question, they are frankly too damn stupid to be involved in redistricting anyway. So no, I won't make questions overly complex to avoid "perpetuating a fallacy". Are the GOP Reps who owe their existance to the VRA packing of Dem voters a "fallacy"? Are congress people like Brown, a fallacy? No. I'll leave education about the VRA's purpose to PBS, it isn't my job, and certainly is on topic as far as this board is concerned. It is a mere appendage, of an extention, of a sub category of this board, and then only in relation to its effects on the extention. :P
Title: Re: Official US 2010 Census Results
Post by: minionofmidas on March 20, 2011, 02:16:49 AM
FL-03, Corrine Brown's gerrymandered monstrosity, is now majority-black.
So does that give it VRA protection then?
Really? Do you think I am that stupid.
Title: Re: Official US 2010 Census Results
Post by: Southern Senator North Carolina Yankee on March 20, 2011, 04:12:11 PM
FL-03, Corrine Brown's gerrymandered monstrosity, is now majority-black.
So does that give it VRA protection then?
Really? Do you think I am that stupid.
Somehow I doubt that is he case, but whatever.
I wanted to know whether or not FL-03 could be continued closer to "as is" as result of this revelation. I didn't expect to receive a condescending lecture on the purpose of the VRA. And such a response will not be taken lightly, especially when it is being responded to by me at such a late hour. In terms of redistricting only (god forbid if I don't include this you will claim I am not aware of other protections granted to minorities as far as the right to vote, etc), while it is suppose to protect people and groups from being unfairly targetted in redistricting, the practical application of the VRA is to protect house seats and to protect their occupants. Clearly that is what Corrine Brown thinks. Its horrible and disgusting of course, but then again so are the really aggresive gerrymanders being drawn on this board. Are they suppose to come with disclaimers about how they are wrong and violate the principle of democracy?
I shouldn't have to write this whole damn paragraph to acknowledge the obvious truth that anybody should know by default, just to not get reated like garbage by you, Lewis, for asking a simple question.
As for me, I didn't learn anything about you that I didn't know two years ago. :P
Anyway, I got what I was looking for (though not on here), and am finished. There is no sense trying to change the mind of someone that made it up a long time ago.
Title: Re: Official US 2010 Census Results
Post by: minionofmidas on March 20, 2011, 04:23:10 PM
Clearly that is what Corrine Brown thinks.
Quote
Its horrible and disgusting of course, but then again so are the really aggresive gerrymanders being drawn on this board.
Meh, I only find it horrible and disgusting when people pretend them not to be such. Or when people do it in real life, of course. Or don't use their powers as lawmakers to make it impossible for the next round of redistricting, as all of them could have.I'm a little bewildered now as to what, exactly, you actually meant by your original post that sparked this little lovefest of ours. Whether the populations to draw a seat much like her old one that would reelect her exist, without having to head to Tallahassee like some maps predicted?
Title: Re: Official US 2010 Census Results
Post by: Southern Senator North Carolina Yankee on March 20, 2011, 04:36:42 PM
Clearly that is what Corrine Brown thinks.
Quote
Its horrible and disgusting of course, but then again so are the really aggresive gerrymanders being drawn on this board.
Meh, I only find it horrible and disgusting when people pretend them not to be such. Or when people do it in real life, of course. Or don't use their powers as lawmakers to make it impossible for the next round of redistricting, as all of them could have.I'm a little bewildered now as to what, exactly, you actually meant by your original post that sparked this little lovefest of ours. Whether the populations to draw a seat much like her old one that would reelect her exist, without having to head to Tallahassee like some maps predicted?
Well if I were the Governor of Florida I would stop it, but clearly I am not Rick Scott.
Which is worse under the Florida law basically? Tallahassee or Orlando. If the VRA requires a seat in that neck of the woods to be majority African American, which is more in line with the Florida redistricting law. That is basically what I was asking but was too tired, to lazy, and too sick to write that out and I figured you people had all read the Florida board and thus would know atleast what I knew that some maps had the Tallahassee route while others were just a compact Jacksonville seat (which is definately not majority AA), and the "likely" interpretations of the VRA out of the Roberts court.
Title: Re: Official US 2010 Census Results
Post by: jimrtex on March 20, 2011, 07:12:36 PM
Clearly that is what Corrine Brown thinks.
Quote
Its horrible and disgusting of course, but then again so are the really aggresive gerrymanders being drawn on this board.
Meh, I only find it horrible and disgusting when people pretend them not to be such. Or when people do it in real life, of course. Or don't use their powers as lawmakers to make it impossible for the next round of redistricting, as all of them could have.I'm a little bewildered now as to what, exactly, you actually meant by your original post that sparked this little lovefest of ours. Whether the populations to draw a seat much like her old one that would reelect her exist, without having to head to Tallahassee like some maps predicted?
As I understand the argument of Corrine Brown's (and Diaz-Bahlart) lawsuit, it is that the power of incumbency that permits the protected minority voters to actualize their opportunity to elect their candidate of choice (eg if the representative can choose their voters, the voters can't choose the representative). Since the initiatives forbid taking into account incumbency, but only race, it may result in effective protection of the right of black people to vote.
Before the election, James Clyburn acting on behalf of the Black Democrat Caucus, wrote the national NAACP trying to get them to rein in the Florida NAACP which was supporting the initiatives.
There was a lawsuit trying to force the State of Florida to submit the initiatives to the USDOJ for pre-clearance. It had been submitted in the last days of the Crist administration, and then withdrawn under Scott. I'm not sure where that stands now.
Title: Re: Official US 2010 Census Results
Post by: minionofmidas on March 21, 2011, 12:24:14 AM
Interesting. Never looked at that closely.
I would have assumed that the bill does indeed require preclearance. I would have assumed that it had already received preclearance.
Of course, in practice a constituency at least somewhat like Brown's current one always was going to happen in practice unless literally impossible, which I never presumed to be the case...
Title: Re: Official US 2010 Census Results
Post by: jimrtex on March 21, 2011, 11:27:39 AM
Interesting. Never looked at that closely.
I would have assumed that the bill does indeed require preclearance. I would have assumed that it had already received preclearance.
Of course, in practice a constituency at least somewhat like Brown's current one always was going to happen in practice unless literally impossible, which I never presumed to be the case...
I would have assumed that the bill does indeed require preclearance. I would have assumed that it had already received preclearance.
Of course, in practice a constituency at least somewhat like Brown's current one always was going to happen in practice unless literally impossible, which I never presumed to be the case...
http://americansforredistrictingreform.org/FLTampaTribuneNomovementfromScottonanti-gerrymanderingamendments3-14-11.htm
Crist's SOS had filed for preclearance in December, then Scott's SOS withdrew it in January, and the Florida NAACP, League of Women Voters filed suit in February to force Florida to resubmit it for pre-clearance. Scott and SOS Browning got permission to have until the end of the month to file their reply (supposedly with the consent of the plaintiffs, who issued their press release on the same day).
The article is misleading about California. California had already pre-cleared their redistricting commission after it was approved in November 2008. The November 2010 measure simply extended it to congressional redistricting, plus clarified the term "community of interest". Also California's measure simply requires compliance with the VRA, which would happen even if the measure didn't say anything.
In the Corrinne Brown and Mario Diaz-Ballart suit, claiming that the Florida initiative violates the VRA because it forbids incumbent protection, the court has just granted intervenor status to several parties. The ACLU, Florida NAACP, Democracia Ahora as defendant intervenors, and the Florida House of Representatives as a plaintiff intervenor. In addition, 5 state legislators have intervened as defendant intervenors, claiming that they are potential congressional candidates, as well as legislators who will be drawing the maps.
I read the actual text of the initiatives. They forbid a plan that would favor or disfavor an incumbent. They do not forbid a plan that would favor or disfavor any other potential candidate (eg an ambitious legislator who hopes to carve out a new congressional district for themselves) So the 5 intervening legislators seem to be saying that they may be harmed by not being able to draw a plan favorable to themselves.
Title: Re: Official US 2010 Census Results
Post by: cinyc on March 21, 2011, 03:27:53 PM
Massachusetts, Michigan and New Hampshire shipped to legislators today and will be released to the public around 2PM tomorrow afternoon.
Every state plus Puerto Rico and D.C. will likely be released by 2PM Thursday, when Census is holding a press conference to announce, among other things, who will take over from Edgar Springs, Missouri as the mean population center of the United States. Edgar Springs' reign is coming to an end - or, more accurately, a spot 2.8 miles east of town's reign is. Will the next population center be in Laclede, Wright or even Webster or Texas County, Missouri or further afield? The winner gets a visit from NOAA and a commemorative survey mark (http://celebrating200years.noaa.gov/survey_marks/population/welcome.html).
Every state plus Puerto Rico and D.C. will likely be released by 2PM Thursday, when Census is holding a press conference to announce, among other things, who will take over from Edgar Springs, Missouri as the mean population center of the United States. Edgar Springs' reign is coming to an end - or, more accurately, a spot 2.8 miles east of town's reign is. Will the next population center be in Laclede, Wright or even Webster or Texas County, Missouri or further afield? The winner gets a visit from NOAA and a commemorative survey mark (http://celebrating200years.noaa.gov/survey_marks/population/welcome.html).
Title: Re: Official US 2010 Census Results
Post by: Tender Branson on March 22, 2011, 11:50:22 AM
Wow, take a look at Detroit:
Detroits population plunged 25% in the past decade to 713,777, the lowest level since 1910, four years before Henry Ford offered $5 a day to autoworkers, sparking a boom that quadrupled Detroits size in the first half of the 20th Century.
Census figures released to the Free Press -- by a government source who asked not be identified because the data has not been released publicly -- show the city lost 238,270 on average, one resident every 22 minutes between 2001 and 2010.
The data also show that Wayne Countys population fell almost 12% to 1,820,584. Oakland County grew almost 1% to 1,202,362, while Macomb grew 6.7% to 840,978 making the county more populous than Detroit for the first time.
Detroit, once Americas fourth most populous city, will fall below Midwestern neighbors like Columbus, Ohio, and Indianapolis, Ind.
Fueled by the implosion of the domestic auto industry, the Motor Citys decline helped make Michigan the only state to experience a net population loss since 2000. Overall, the states population fell by about 54,000 people, a 0.6% decline at a time when the nations population grew about 9.7%.
http://www.freep.com/article/20110322/NEWS06/110322036
Title: Re: Official US 2010 Census Results
Post by: Landslide Lyndon on March 22, 2011, 12:09:48 PM
Wow, take a look at Detroit:
Detroits population plunged 25% in the past decade to 713,777, the lowest level since 1910, four years before Henry Ford offered $5 a day to autoworkers, sparking a boom that quadrupled Detroits size in the first half of the 20th Century.
Census figures released to the Free Press -- by a government source who asked not be identified because the data has not been released publicly -- show the city lost 238,270 on average, one resident every 22 minutes between 2001 and 2010.
The data also show that Wayne Countys population fell almost 12% to 1,820,584. Oakland County grew almost 1% to 1,202,362, while Macomb grew 6.7% to 840,978 making the county more populous than Detroit for the first time.
Detroit, once Americas fourth most populous city, will fall below Midwestern neighbors like Columbus, Ohio, and Indianapolis, Ind.
Fueled by the implosion of the domestic auto industry, the Motor Citys decline helped make Michigan the only state to experience a net population loss since 2000. Overall, the states population fell by about 54,000 people, a 0.6% decline at a time when the nations population grew about 9.7%.
http://www.freep.com/article/20110322/NEWS06/110322036
Detroits population plunged 25% in the past decade to 713,777, the lowest level since 1910, four years before Henry Ford offered $5 a day to autoworkers, sparking a boom that quadrupled Detroits size in the first half of the 20th Century.
Census figures released to the Free Press -- by a government source who asked not be identified because the data has not been released publicly -- show the city lost 238,270 on average, one resident every 22 minutes between 2001 and 2010.
The data also show that Wayne Countys population fell almost 12% to 1,820,584. Oakland County grew almost 1% to 1,202,362, while Macomb grew 6.7% to 840,978 making the county more populous than Detroit for the first time.
Detroit, once Americas fourth most populous city, will fall below Midwestern neighbors like Columbus, Ohio, and Indianapolis, Ind.
Fueled by the implosion of the domestic auto industry, the Motor Citys decline helped make Michigan the only state to experience a net population loss since 2000. Overall, the states population fell by about 54,000 people, a 0.6% decline at a time when the nations population grew about 9.7%.
http://www.freep.com/article/20110322/NEWS06/110322036
How is this going to affect redistricting? I assume it will be more difficult now to sustain two VRA districts in the city and they may need to expand outwards to the suburbs.
Title: Re: Official US 2010 Census Results
Post by: Sbane on March 22, 2011, 12:33:35 PM
Wow, take a look at Detroit:
Detroit’s population plunged 25% in the past decade to 713,777, the lowest level since 1910, four years before Henry Ford offered $5 a day to autoworkers, sparking a boom that quadrupled Detroit’s size in the first half of the 20th Century.
Census figures released to the Free Press -- by a government source who asked not be identified because the data has not been released publicly -- show the city lost 238,270 — on average, one resident every 22 minutes between 2001 and 2010.
The data also show that Wayne County’s population fell almost 12% to 1,820,584. Oakland County grew almost 1% to 1,202,362, while Macomb grew 6.7% to 840,978 — making the county more populous than Detroit for the first time.
Detroit, once America’s fourth most populous city, will fall below Midwestern neighbors like Columbus, Ohio, and Indianapolis, Ind.
Fueled by the implosion of the domestic auto industry, the Motor City’s decline helped make Michigan the only state to experience a net population loss since 2000. Overall, the state’s population fell by about 54,000 people, a 0.6% decline at a time when the nation’s population grew about 9.7%.
http://www.freep.com/article/20110322/NEWS06/110322036
How is this going to affect redistricting? I assume it will be more difficult now to sustain two VRA districts in the city and they may need to expand outwards to the suburbs.
Yes, the Black parts of Oakland County will likely end up in one of the VRA districts.
Title: Re: Official US 2010 Census Results
Post by: memphis on March 22, 2011, 12:44:18 PM
Wow, take a look at Detroit:
Detroits population plunged 25% in the past decade to 713,777, the lowest level since 1910, four years before Henry Ford offered $5 a day to autoworkers, sparking a boom that quadrupled Detroits size in the first half of the 20th Century.
Census figures released to the Free Press -- by a government source who asked not be identified because the data has not been released publicly -- show the city lost 238,270 on average, one resident every 22 minutes between 2001 and 2010.
The data also show that Wayne Countys population fell almost 12% to 1,820,584. Oakland County grew almost 1% to 1,202,362, while Macomb grew 6.7% to 840,978 making the county more populous than Detroit for the first time.
Detroit, once Americas fourth most populous city, will fall below Midwestern neighbors like Columbus, Ohio, and Indianapolis, Ind.
Fueled by the implosion of the domestic auto industry, the Motor Citys decline helped make Michigan the only state to experience a net population loss since 2000. Overall, the states population fell by about 54,000 people, a 0.6% decline at a time when the nations population grew about 9.7%.
http://www.freep.com/article/20110322/NEWS06/110322036
How is this going to affect redistricting? I assume it will be more difficult now to sustain two VRA districts in the city and they may need to expand outwards to the suburbs.
Yes, the Black parts of Oakland County will likely end up in one of the VRA districts.
Title: Re: Official US 2010 Census Results
Post by: Sbane on March 22, 2011, 12:45:38 PM
Wow, take a look at Detroit:
Detroit’s population plunged 25% in the past decade to 713,777, the lowest level since 1910, four years before Henry Ford offered $5 a day to autoworkers, sparking a boom that quadrupled Detroit’s size in the first half of the 20th Century.
Census figures released to the Free Press -- by a government source who asked not be identified because the data has not been released publicly -- show the city lost 238,270 — on average, one resident every 22 minutes between 2001 and 2010.
The data also show that Wayne County’s population fell almost 12% to 1,820,584. Oakland County grew almost 1% to 1,202,362, while Macomb grew 6.7% to 840,978 — making the county more populous than Detroit for the first time.
Detroit, once America’s fourth most populous city, will fall below Midwestern neighbors like Columbus, Ohio, and Indianapolis, Ind.
Fueled by the implosion of the domestic auto industry, the Motor City’s decline helped make Michigan the only state to experience a net population loss since 2000. Overall, the state’s population fell by about 54,000 people, a 0.6% decline at a time when the nation’s population grew about 9.7%.
http://www.freep.com/article/20110322/NEWS06/110322036
How is this going to affect redistricting? I assume it will be more difficult now to sustain two VRA districts in the city and they may need to expand outwards to the suburbs.
Yes, the Black parts of Oakland County will likely end up in one of the VRA districts.
But Detroit's population is only worth about a CD now. And except for Oakland County, there are very few Blacks outside of Detroit. Maybe that changed in the last 10 years but I doubt it.
Title: Re: Official US 2010 Census Results
Post by: Brittain33 on March 22, 2011, 12:51:37 PM
My jaw dropped. WOW. 25%?!
Title: Re: Official US 2010 Census Results
Post by: memphis on March 22, 2011, 12:56:15 PM
Wow, take a look at Detroit:
Detroits population plunged 25% in the past decade to 713,777, the lowest level since 1910, four years before Henry Ford offered $5 a day to autoworkers, sparking a boom that quadrupled Detroits size in the first half of the 20th Century.
Census figures released to the Free Press -- by a government source who asked not be identified because the data has not been released publicly -- show the city lost 238,270 on average, one resident every 22 minutes between 2001 and 2010.
The data also show that Wayne Countys population fell almost 12% to 1,820,584. Oakland County grew almost 1% to 1,202,362, while Macomb grew 6.7% to 840,978 making the county more populous than Detroit for the first time.
Detroit, once Americas fourth most populous city, will fall below Midwestern neighbors like Columbus, Ohio, and Indianapolis, Ind.
Fueled by the implosion of the domestic auto industry, the Motor Citys decline helped make Michigan the only state to experience a net population loss since 2000. Overall, the states population fell by about 54,000 people, a 0.6% decline at a time when the nations population grew about 9.7%.
http://www.freep.com/article/20110322/NEWS06/110322036
How is this going to affect redistricting? I assume it will be more difficult now to sustain two VRA districts in the city and they may need to expand outwards to the suburbs.
Yes, the Black parts of Oakland County will likely end up in one of the VRA districts.
But Detroit's population is only worth about a CD now. And except for Oakland County, there are very few Blacks outside of Detroit. Maybe that changed in the last 10 years but I doubt it.
Title: Re: Official US 2010 Census Results
Post by: Landslide Lyndon on March 22, 2011, 12:58:55 PM
Wow, take a look at Detroit:
Detroits population plunged 25% in the past decade to 713,777, the lowest level since 1910, four years before Henry Ford offered $5 a day to autoworkers, sparking a boom that quadrupled Detroits size in the first half of the 20th Century.
Census figures released to the Free Press -- by a government source who asked not be identified because the data has not been released publicly -- show the city lost 238,270 on average, one resident every 22 minutes between 2001 and 2010.
The data also show that Wayne Countys population fell almost 12% to 1,820,584. Oakland County grew almost 1% to 1,202,362, while Macomb grew 6.7% to 840,978 making the county more populous than Detroit for the first time.
Detroit, once Americas fourth most populous city, will fall below Midwestern neighbors like Columbus, Ohio, and Indianapolis, Ind.
Fueled by the implosion of the domestic auto industry, the Motor Citys decline helped make Michigan the only state to experience a net population loss since 2000. Overall, the states population fell by about 54,000 people, a 0.6% decline at a time when the nations population grew about 9.7%.
http://www.freep.com/article/20110322/NEWS06/110322036
Detroits population plunged 25% in the past decade to 713,777, the lowest level since 1910, four years before Henry Ford offered $5 a day to autoworkers, sparking a boom that quadrupled Detroits size in the first half of the 20th Century.
Census figures released to the Free Press -- by a government source who asked not be identified because the data has not been released publicly -- show the city lost 238,270 on average, one resident every 22 minutes between 2001 and 2010.
The data also show that Wayne Countys population fell almost 12% to 1,820,584. Oakland County grew almost 1% to 1,202,362, while Macomb grew 6.7% to 840,978 making the county more populous than Detroit for the first time.
Detroit, once Americas fourth most populous city, will fall below Midwestern neighbors like Columbus, Ohio, and Indianapolis, Ind.
Fueled by the implosion of the domestic auto industry, the Motor Citys decline helped make Michigan the only state to experience a net population loss since 2000. Overall, the states population fell by about 54,000 people, a 0.6% decline at a time when the nations population grew about 9.7%.
http://www.freep.com/article/20110322/NEWS06/110322036
How is this going to affect redistricting? I assume it will be more difficult now to sustain two VRA districts in the city and they may need to expand outwards to the suburbs.
Yes, the Black parts of Oakland County will likely end up in one of the VRA districts.
But Detroit's population is only worth about a CD now. And except for Oakland County, there are very few Blacks outside of Detroit. Maybe that changed in the last 10 years but I doubt it.
Yeah, that's what I meant. How can you maintain two VRA districts when there is barely enough population for one?
And is there a big and homogenous enough pool of black voters somewhere nearby to make up for the losses?
Title: Re: Official US 2010 Census Results
Post by: Dave from Michigan on March 22, 2011, 01:20:30 PM
Southfield Michigan has could have close to 100,000 people, it had 80,000 in 2000. it was 55% black in 2000, but it's know for where black people move to if they leave the city so it could be a lot more. If 238,000 people left the city they had to move somewhere but of course if they are too spread out it will be harder to make 2 districts. I think they will be able to make 2 districts but they will only be 52-53% black.
Title: Re: Official US 2010 Census Results
Post by: cinyc on March 22, 2011, 01:26:45 PM
Southfield Michigan has could have close to 100,000 people, it had 80,000 in 2000. it was 55% black in 2000, but it's know for where black people move to if they leave the city so it could be a lot more. If 238,000 people left the city they had to move somewhere but of course if they are too spread out it will be harder to make 2 districts. I think they will be able to make 2 districts but they will only be 52-53% black.
The numbers have been released. I'll work on a full write-up when I have time. But like most Michigan cities, Southfield lost population in the last decade. There are just over 590,000 African-Americans in Detroit and 50,000 in Southfield. The state as a whole lost both non-Hispanic whites and non-Hispanic African Americans.
Title: Re: Official US 2010 Census Results
Post by: Bacon King on March 22, 2011, 01:41:06 PM
640,000... To keep two black majority districts, you'd need to pull in another 70k blacks from somewhere, and even then you'd need to find a way to split the black population very evenly to get two barely majority black districts. Doesn't really sound doable at all, IMO.
Title: Re: Official US 2010 Census Results
Post by: cinyc on March 22, 2011, 01:51:30 PM
640,000... To keep two black majority districts, you'd need to pull in another 70k blacks from somewhere, and even then you'd need to find a way to split the black population very evenly to get two barely majority black districts. Doesn't really sound doable at all, IMO.
There are 737,943 blacks in Wayne County and 164,078 in Oakland County (including about 31,000 in Pontiac), plus another almost 58,000 African-Americans in the city of Flint. If the legislature wants to draw a second black majority district in Southeast Michigan, it probably would be able to - though it would likely have to split Detroit and look very ugly.
The numbers might be a bit lower after taking into account Hispanic status.
Title: Re: Official US 2010 Census Results
Post by: Verily on March 22, 2011, 02:11:32 PM
On those numbers, I don't think it will be possible to draw two 50% black VAP seats. The legislature may want to try to pack Democrats in anyway, of course, but enough of those blacks are in 80-90% white areas (or, as in Pontiac and Flint, too remote from other blacks) to make two majority seats impossible.
Title: Re: Official US 2010 Census Results
Post by: Sbane on March 22, 2011, 02:15:57 PM
640,000... To keep two black majority districts, you'd need to pull in another 70k blacks from somewhere, and even then you'd need to find a way to split the black population very evenly to get two barely majority black districts. Doesn't really sound doable at all, IMO.
There are 737,943 blacks in Wayne County and 164,078 in Oakland County (including about 31,000 in Pontiac), plus another almost 58,000 African-Americans in the city of Flint. If the legislature wants to draw a second black majority district in Southeast Michigan, it probably would be able to - though it would likely have to split Detroit and look very ugly.
The numbers might be a bit lower after taking into account Hispanic status.
If they can make two AA districts within Wayne and south Oakland County, it won't look that bad. If they need to go to Flint (which if they need to do, I bet they give up on the second district), it gets ugly.
Title: Re: Official US 2010 Census Results
Post by: Verily on March 22, 2011, 02:17:29 PM
My jaw dropped. WOW. 25%?!
Nearly as much as New Orleans, without a hurricane.
Also, Wayne County in 2010 has fewer people than Detroit had in 1950.
Title: Re: Official US 2010 Census Results
Post by: cinyc on March 22, 2011, 02:37:20 PM
Massachusetts, Michigan and New Hampshire were released today:
Massachusetts
Massachusetts didn't grow much in the past decade (+3.1%), and what little growth there was was somewhat uniform. More of the rich and the famous called Martha's Vineyard their home, causing the population of Dukes County to increase by 10.3%. Growing at more than times the state average sounds impressive until you realize the Vineyard is still small and 10.3% was just over 1,500 residents. Dukes was the only county which experienced double-digit growth. It was followed by Nantucket (+6.8%), and Boston exurban/suburban/maybe not Worcester (+6.3%) and Plymouth (+4.7%) counties and Boston's Suffolk County (+4.7%). Western Massachusetts' Hampshire County (+3.8%), home to the college towns of Amherst and Northampton, and Boston-suburban Norfolk County (+3.2%) also grew slightly faster than the state. Cape Cod's Barnstable County (-2.9%) and Western Massachusetts' Berkshire (-2.8%) and Franklin (-0.2%) Counties lost population. North suburban/exurban Boston's Middlesex County (+2.6%) remains the largest in the state with a population just over 1.5 million.
On the municipal level, there wasn't much change, either. Among the top 20 cities, Plymouth (+9.2%) grew fastest, while Boston (+4.8%) picked up the most new residents, over 28,000. In the Merrimack Valley near the New Hampshire border, majority-Hispanic Lawrence (+6.0%) and Haverhill (+3.2%) grew faster than Lowell (+1.3%). Elsewhere in the Boston area, Malden (+5.5%), Quincy (+4.8%) and Harvard's Cambridge (+3.8%) grew faster than the state, while Brookline (+2.8%), Waltham (+2.4%), Framingham (+2.1%), Lynn (+1.4%), Newton (+1.6%) and Medford (+0.7%) did not. Inner Boston-area Somerville (-2.2%) and south suburban Brockton (-0.5%) lost population. Outside of the Boston area, the cities of Worcester (+4.9%), New Bedford (+1.4%) and Springfield (+0.6%) grew, while Fall River (-3.4%) lost the most population of any city in the top 20.
Massachusetts' non-Hispanic white population fell by 4.1%. Its Hispanic population increased by 46.4%. Massachusetts' non-Hispanic Asian growth was slightly higher (+46.8%) than Hispanic growth and its non-Hispanic Black population growth (+23.0%) about half that.
Michigan
To come in a separate post.
New Hampshire
Growth was a little bit faster in Central New Hampshire than counties on Massachusetts border. Central Strafford (Rochester/Dover/UNH; +9.7%), Carroll (Lake region; +9.5%), Grafton (Hanover/Lebanon/Dartmouth; +9.0%), Sullivan (Claremont; +8.1%), Merrimack (Concord; +7.5%) and Belknap (Laconia/Lake region; +6.7%) counties all grew faster than the state (+6.5%). Massachusetts-bordering Rockingham (Portsmouth/Salem; +6.4%), Hillsborough (Manchester/Nashua; +5.2%) and Cheshire (Keene; +4.5%) counties lagged statewide growth, but Hillsborough picked up more residents than any other county, almost 20,000. Coos County in the north lost 0.2% of its population - 56 people.
On the municipal level, commuter and college towns grew fastest. Windham, Rockingham County, in the I-93 commuter corridor, grew by 26.9%, fastest among the top 20. Windham was followed by Manchester-suburban Bedford (+16.0%), the University of New Hampshire's hometown of Durham (+15.6%), Nashua-area Milford (+11.7%) and Portsmouth-area Dover (+11.5%). The state capital of Concord (+4.9%) grew, its largest city, Manchester (+2.4%) lagged and Nashua (-0.1%) actually lost population. Portsmouth (-0.0%) was flat. Other population-losing top 20 municipalities included lake-region Laconia (-2.8%) and, somewhat surprisingly, Derry (-2.7%) in the I-93 commuter corridor
New Hampshire's non-Hispanic white population increased by 3.4%. It remains over 90% non-Hispanic white, despite its Hispanic population increasing by 79.1%, non-Hispanic Asian population by 78.7% and non-Hispanic African American population increasing by 63.1%. As in 2000, New Hampshire's blacks remain a very tiny minority - there are more Hispanics and non-Hispanic Asians in the state than non-Hispanic African-Americans.
Title: Re: Official US 2010 Census Results
Post by: Dave from Michigan on March 22, 2011, 03:04:59 PM
from what I'm seeing a lot of cities close to Detroit have big increases in black population
Title: Re: Official US 2010 Census Results
Post by: memphis on March 22, 2011, 03:29:26 PM
from what I'm seeing a lot of cities close to Detroit have big increases in black population
Not surprising. Blacks with the means have been fleeing urban ghettos all over the country.
Title: Re: Official US 2010 Census Results
Post by: cinyc on March 22, 2011, 03:35:04 PM
from what I'm seeing a lot of cities close to Detroit have big increases in black population
Not surprising. Blacks with the means have been fleeing urban ghettos all over the country.
The difference is that, like whites, blacks are fleeing from the entire state of Michigan, not just the urban ghettos there. The only groups whose numbers significantly increased were Hispanics, non-Hispanic Asians and those of 2 or more races. The non-Hispanic American Indian and non-Hispanic Pacific Islander populations also grew, but only very slightly.
Title: Re: Official US 2010 Census Results
Post by: bgwah on March 22, 2011, 03:39:41 PM
from what I'm seeing a lot of cities close to Detroit have big increases in black population
Not surprising. Blacks with the means have been fleeing urban ghettos all over the country.
The difference is that, like whites, blacks are fleeing from the entire state of Michigan, not just the urban ghettos there. The only groups whose numbers significantly increased were Hispanics, non-Hispanic Asians and those of 2 or more races. The non-Hispanic American Indian and non-Hispanic Pacific Islander populations also grew, but only very slightly.
Well, that may be true, but the state black population only appears to have decreased by 1%, so a lot must have simply moved elsewhere within the state, presumably to the suburbs...?
Title: Re: Official US 2010 Census Results
Post by: cinyc on March 22, 2011, 04:11:25 PM
from what I'm seeing a lot of cities close to Detroit have big increases in black population
Not surprising. Blacks with the means have been fleeing urban ghettos all over the country.
The difference is that, like whites, blacks are fleeing from the entire state of Michigan, not just the urban ghettos there. The only groups whose numbers significantly increased were Hispanics, non-Hispanic Asians and those of 2 or more races. The non-Hispanic American Indian and non-Hispanic Pacific Islander populations also grew, but only very slightly.
Well, that may be true, but the state black population only appears to have decreased by 1%, so a lot must have simply moved elsewhere within the state, presumably to the suburbs...?
By my math, Detroit lost about 185,000 blacks - almost 24% of the 2000 Detroit African-American population. Wayne County outside Detroit picked up about 55,000 African-Americans. Macomb County picked up about 51,000 blacks. Oakland County picked up about 43,000 blacks. That leaves about 36,000 Detroit blacks who didn't move to the Detroit-area's big two suburban counties or suburban Wayne. All those areas lost whites.
Outside of the big 3 counties, you might be able to find a few more Detroit blacks who moved to more far-flung Livingston or Monroe counties, but their combined African-American population is only about 4,000 to begin with.
Note that this is before taking into account Hispanic status.
Title: Re: Official US 2010 Census Results
Post by: JohnnyLongtorso on March 22, 2011, 04:19:54 PM
New Hampshire won't even need to change its lines. The districts are only 254 people from the mean:
NH-01 Guinta (R) 657,984 (254)
NH-02 Bass (R) 658,486 254
NH-01 Guinta (R) 657,984 (254)
NH-02 Bass (R) 658,486 254
Title: Re: Official US 2010 Census Results
Post by: cinyc on March 22, 2011, 04:40:07 PM
Rhode Island, South Carolina and West Virginia shipped to legislators today and are expected to be released at 2PM tomorrow. Sorry, New York and Maine - you're dead last, on equal footing with D.C. and Puerto Rico.
Title: Re: Official US 2010 Census Results
Post by: bullmoose88 on March 22, 2011, 04:50:44 PM
Could someone be so kind to put a post in here with links to the individual states (or Cincy's summaries)?
Thanks.
Thanks.
Title: Re: Official US 2010 Census Results
Post by: cinyc on March 22, 2011, 05:07:48 PM
Could someone be so kind to put a post in here with links to the individual states (or Cincy's summaries)?
Thanks.
Thanks.
http://2010.census.gov/news/press-kits/redistricting.html
That's is where I get the data. It has links to all states. Each state has a short Census writeup and a spreadsheet showing population for the top 20 counties and municipalities and racial data. You can download the full file from the FTP website. You'll probably need a database program to open up some of the larger states, though. California's full file is over 1,000,000 lines long.
I'm downloading some Michigan data now. Hopefully, I'll have time for a detailed write-up tonight.
I haven't written up every state. I started doing so about halfway through the process.
Title: Re: Official US 2010 Census Results
Post by: Kevinstat on March 22, 2011, 06:04:50 PM
Sorry, New York and Maine - you're dead last, on equal footing with D.C. and Puerto Rico.
I don't mind Maine being one of the last two states since we won't have to draw any districts until 2013 (even for municipal election districts (what most people would call "wards") in Maine's municipalities which have them redistricting isn't required until after the legislative districts are drawn), although I think Montana (which was released last week, on Tuesday I think), not New York, should have been the other state in the last two. Their Legislative redistricting won't go into effect until 2014, although I'm not sure about local elections and it's apportionment commission is already meeting (Maine's won't be named until December 2012 at the earliest).
Title: Re: Official US 2010 Census Results
Post by: Horus on March 23, 2011, 12:30:14 AM
from what I'm seeing a lot of cities close to Detroit have big increases in black population
Very true. Eastpointe Michigan went from 4.5% black to 29.5% black.
Title: Re: Official US 2010 Census Results
Post by: cinyc on March 23, 2011, 01:06:47 PM
New Hampshire won't even need to change its lines. The districts are only 254 people from the mean:
NH-01 Guinta (R) 657,984 (254)
NH-02 Bass (R) 658,486 254
NH-01 Guinta (R) 657,984 (254)
NH-02 Bass (R) 658,486 254
Quite the bizarre bit of luck. I suppose New Hampshire could try to move a town or ward or two between the districts to make the population as equal as possible, if they really felt obligated.
Title: Re: Official US 2010 Census Results
Post by: minionofmidas on March 23, 2011, 01:46:18 PM
You can download the full file from the FTP website. You'll probably need a database program to open up some of the larger states, though. California's full file is over 1,000,000 lines long.
Title: Re: Official US 2010 Census Results
Post by: cinyc on March 23, 2011, 02:13:42 PM
Michigan
Michigan is the only state that lost population over the past decade, shedding 0.6% of its population. As previously noted, a large part of that population loss was due to the decimation of Detroit (-25.0%) and its county, Wayne (-11.7%). Even Wayne County outside of Detroit lost population, albeit only 3,000 residents. And growth in Detroit's main suburban counties was mixed - Oakland County (+0.7%) barely grew. Macomb County (+6.7%) did better.
But that bleak headline doesn't tell the whole Michigan story. As the map below shows, believe it or not, there even were some counties that experienced double-digit growth:
()
The map uses the Atlas Swing colorscale. Red is positive, blue is negative, gray is about even (0.5% to -0.5%). The colors deepen in 5% increments.
Clinton County, north-suburban/exurban Lansing, lead the state with 16.4% growth. Detroit/Ann Arbor exurban Livingston County (+15.3%) was next, followed by Grand Traverse County (+12.0%) in northern Michigan, Isabella County (+11.0%) in the north-central part of the state, which is home to the Isabella Indian Reservation and the city of Mount Pleasant, and Grand Rapids-suburban Ottawa County (+10.7%).
In Southwest Michigan, Grand Rapids' Kent County (+4.9%) and Kalamazoo County (+4.9%) both grew, while Benton Harbor and St. Joseph's Berrien County (-3.5%) shrunk. In mid-Michigan, Flint's Gennesse County (-2.4%), Saginaw County (-4.7%) and Bay City's Bay County (-2.2%) all shrunk, while Midland County (+0.9%) barely grew. Many of the more rural UP counties shrunk, including Ontonagon County (-13.3%), which shrunk more than any county in Michigan, while a handful of the larger UP counties slightly grew.
But the statewide percentage change map only tells part of the story. Michigan is one of the few states that lost both non-Hispanic whites (-3.0%) and non-Hispanic blacks (-1.3%) over the past decade. As the map of percentage change in the county non-Hispanic white population below shows, non-Hispanic whites fled most counties, including the main Detroit suburban counties and Grand Rapids' Kent:
()
On the other hand, the non-Hispanic black population increased in most counties except, most notably, in Detroit's Wayne County, Flint's Genessee County, Saginaw County and three counties on the Southwest corner of the state.
()
This map uses a slightly different colorscale. The colors deepen in 10-point increments, and you can see some orange where the black population more than doubled and green where it more than tripled. As you can see, the non-Hispanic black population of Detroit-suburban Macomb County and northern Grand Traverse County, among others, exploded. Of course, explosion is relative - some counties, especially outside of Michigan's metropolitan areas, had few blacks to begin with. The next map shows the relative shift in the county's non-Hispanic black percentage from 2000 to 2010 - i.e. 2010 non-Hispanic black percentage minus 2000 non-Hispanic black percentage:
()
This uses the Atlas swing coloring. Most counties are gray for a less than 0.5% change. Detroit-suburban Macomb had the biggest increase in black percentage, almost 6%. Its black population grew from just 2.7% of the county in 2000 to 8.6% in 2010. Other counties saw smaller shifts.
Statewide, the Hispanic (+34.7) and non-Hispanic Asian (+34.9%) populations grew, but not at the impressive rate seen in elsewhere - which might explain why there aren't more counties showing relative losses.
In general, on the municipal level, 15 of the state's top 20 cities lost population over the last decade, none more than Detroit (-25.0%), Flint (-18.0%) and Pontiac (-10.3%). Only Detroit-suburban Sterling Heights (+4.2%), Rochester Hills (+3.2%), Dearborn (+0.4%) and Troy (+0.0%) and Grand Rapids-suburban Wyoming (+4.0%) gained population. Detroit-suburban Southfield (-8.4%) and St. Clair Shores (-5.4%) and Taylor (-4.2%) were big losers. In the rest of the state, Ann Arbor was relatively flat (-0.1%), while Grand Rapids (-4.9%), Lansing (-4.1%) and Kalamazoo (-3.7%) lost population.
In particular, here's a map showing population losses by municipality in Southeast Michigan:
()
Gains were generally outside of the I-275/I-696 loop. Yet even those areas lost whites:
()
While even some areas inside the loop gained black residents:
()
(Note that this uses the second colorscale. The black population in silver-shaded municipalities more than quadrupled. Gold-shaded municipalities had no black residents in 2000 - though they're mainly in other parts of the state.)
And, as a result, the black percentage increased, especially in Detroit's inner suburbs:
()
(Atlas Swing color scale; silver is near-zero change)
I can make other Michigan town maps upon request.
Title: Re: Official US 2010 Census Results
Post by: Lunar on March 23, 2011, 02:42:40 PM
Does anyone know when NY's data is to be released?
Title: Re: Official US 2010 Census Results
Post by: minionofmidas on March 23, 2011, 02:47:58 PM
Never:
Rhode Island, South Carolina and West Virginia shipped to legislators today and are expected to be released at 2PM tomorrow. Sorry, New York and Maine - you're dead last, on equal footing with D.C. and Puerto Rico.
Title: Re: Official US 2010 Census Results
Post by: True Federalist (진정한 연방 주의자) on March 23, 2011, 02:58:03 PM
Now comes the wait for the 2010 data for South Carolina to be added to Dave's Redistricting App. Let's hope that doesn't take as long as it did for the Census Bureau to release it in the first place. Indeed, I'm hoping that once the last States are released, Dave will make a special push to update the laggards and have all 50 states ready by next Monday, but I expect it'll likely be two or three weeks.
Title: Re: Official US 2010 Census Results
Post by: cinyc on March 23, 2011, 03:15:59 PM
Rhode Island, South Carolina and West Virginia have been released:
Rhode Island
The results are pretty boring. The state barely grew (+0.4%). Its counties barely grew (none grew or lost more than 5,100 residents or 3%). And its top 20 towns barely grew.
Rhode Island only has 5 counties. Providence County, in the state's northern third, remains the state's largest, growing by 0.8% and picking up the most new residents - just over 5,000. The county is home to the state capital of Providence and Pawtucket. Washington County, in the state's southern third, grew fastest at 2.8%. Mid-state Kent County (Warwick; -0.6%), ocean-faring Newport County (-3.0%) and the part of Massachusetts handed over to Rhode Island after a long dispute, Bristol County, Rhode Island (-1.5%) lost population. Bristol is one of the few counties whose top ethnicity is Portuguese.
On the municipal level, Providence remains the largest city in the state, growing by 2.5% and picking up more residents than any other town. Washington County's South Kingston (+9.7%) grew fastest - it's good to live by the shore, I guess. Cumberland (+5.2%), on the Massachusetts border, Kent County's Coventry (+4.0%) and suburban Smithfield (+4.0%) also gained more than 3%. The more urban towns of Newport (-6.8%), Woonsocket (-4.7%), Warwick (-3.7%) and East Providence (-3.4%) lost more than 3%. The city of Central Falls (+2.4%) is majority Hispanic.
Rhode Island's non-Hispanic White population dropped by 6.4%. Its Hispanic population grew by 43.9%, growing from 8.7% to 12.4% of the population. Rhode Island's non-Hispanic black population (+23.0%) and non-Hispanic Asian population (+28.1%) also grew - but non-Hispanic blacks still make up under 5% of the state's population.
South Carolina
To come in a separate post.
West Virginia
Even though West Virginia grew by 2.5%, most of its counties lost population. Among the top 20, Kanawaha, home of the state capital, Charleston, lost 3.5% of its population and the most residents. Marshall (Moundsville; -6.8%), Ohio (Wheeling; -6.3%) and Hancock (Weirton; -6.1%) in West Virginia's northern panhandle lost a greater percentage of their residents than Kanawha. Beckley's Fayette County (-3.2%) lost about as much as Kanawha, while Parkersburg's Wood County (-1.2%), Princeton's Mercer County (-1.1%) and Huntington's Cabell County (-0.5%) were slightly down.
Other counties gained population. The biggest gainers were generally in the state's eastern panhandle, which includes some counties in Washington, D.C.'s exurbs and counties including college towns. The biggest winner was Berkeley County (Martinsburg; +37.2%), which leaped up 4 spots to become the second-largest county in the state. It picked up over 28,000 new residents and now has a population over 100,000. Its eastern panhandle neighbor, Jefferson County (+26.8%) was next, followed in the top 20 counties by Morgantown's Monongalia County (+17.5%), home to the University of West Virginia, and neighboring Preston County (+14.3%). Other growing counties included Putnam County (+7.6%), along I-64 between Charleston and Huntington, Elkins' Randolph County (+4.0%), home to Davis & Elkins College, and Greenbrier County (+3.0%), a resorty area on the Virginia border in the southern part of the state.
On the municipal level, the top three cities - Charleston (-3.8%), Huntington (-4.5%) and Parkersburg (-4.9%) all lost population, as did three of the next four - Wheeling (-9.3%), Weirton (-3.3%) and Fairmont (-2.1%), in between Charleston and Morgantown. Martinsburg (+15.1%) in the state's eastern panhandle grew fastest among the top 20, followed by Bridgeport (+11.5%), near Clarksburg (-1.0%) and the college town of Morgantown (+10.6%). In the southern part of teh state, Bluefield lost 8.8% of its residents while Beckley (+2.1%) and Oak Hill (+1.9%), closer to the state's white water rafting mecca, showed slight growth. Charleston-suburban Nitro (+5.2%) showed a pulse, but didn't exactly explode.
West Virginia's non-Hispanic white population grew by 1.0%. Its Hispanic population (+81.4%) nearly doubled - but Hispanics still make up only 1.2% of the state's population. The state's non-Hispanic Asian (+31.3%) and non-Hispanic black (+9.3%) population also grew. At 3.4% of the population, non-Hispanic blacks are the state's largest minority group - but that's not saying much. West Virginia is still over 93% non-Hispanic white.
Title: Re: Official US 2010 Census Results
Post by: cinyc on March 23, 2011, 03:19:01 PM
Does anyone know when NY's data is to be released?
2PM tomorrow, with Maine, Puerto Rico and Washington D.C. They were shipped today. As such, Census has shipped out every state redistricting dataset.
There's a press conference at 2PM tomorrow to announce the new mean population center of the US, error rates and assorted other stuff.
Title: Re: Official US 2010 Census Results
Post by: JohnnyLongtorso on March 23, 2011, 04:16:26 PM
I'm a little surprised that Charleston lost population. I would think if anywhere in the state (outside of the exurbanizing eastern panhandle) would be able to avoid bleeding people, it would be the state capital.
What's up with Gilmer's growth?
What's up with Gilmer's growth?
Title: Re: Official US 2010 Census Results
Post by: cinyc on March 23, 2011, 04:25:26 PM
I'm a little surprised that Charleston lost population. I would think if anywhere in the state (outside of the exurbanizing eastern panhandle) would be able to avoid bleeding people, it would be the state capital.
What's up with Gilmer's growth?
What's up with Gilmer's growth?
As am I. But it's not the only state capital that lost population. Off the top of my head, Frankfort, Kentucky, Lansing, Michigan and Pierre, South Dakota did, too. At least their counties grew, though.
There's a state college and federal penitentiary in Gilmer County. My guess it is Gilmer's growth something to do with one or both of those institutions.
Title: Re: Official US 2010 Census Results
Post by: Brittain33 on March 23, 2011, 04:27:35 PM
There's a state college and federal penitentiary in Gilmer County. My guess it is Gilmer's growth something to do with one or both of those institutions.
The prison appears to have opened since 2000.
It's a poor, rural county--as soon as I saw JL's question I was googling "gilmer county prison".
Title: Re: Official US 2010 Census Results
Post by: cinyc on March 23, 2011, 05:23:54 PM
South Carolina
Unlike the other slow- or no-growth states released this week, South Carolina grew at a brisk 15.3% pace. Every one of the top 20 counties grew. The fastest-growing counties were largely suburban or coastal. Charleston-suburban Dorchester County (Summerville; +41.6%) lead the growth parade, followed by Charlotte, North Carolina-suburban York County (Rock Hill;+ 37.3%), Myrtle Beach's Horry County (+37.0%) and coastal Beaufort County (+34.1%), home of ritzy Hilton Head Island and Beaufort's U.S. Marine bases, including Parris Island. Horry County picked up the most new residents - over 72,000, about 1,000 more residents than the largest county in the state, Greenville (+18.9%), in upstate South Carolina. Other major counties that grew faster than the state include Charlotte-exurban Lancaster (+24.9%), Charleston-suburban Berkeley (+24.7%), Columbia-suburban Lexington (+21.5%) and Columbia's county, Richland (+19.9%). Charleston County grew by 13.0%. In upstate, Anderson County (+12.9%) and Spartanburg County (+12.0%) slightly lagged the state. Some I-95 counties containing smaller towns barely grew, among them Orangeburg County (+1.0%), Sumter County (+2.7%) and Darlington County (+1.9%), near Florence. And 12 more rural counties lost population.
On the municipal level, the state capital of Columbia (+11.2%) held off Charleston (+24.2%) to remain the state's largest city. Charleston picked up the most new residents of any city in the state, over 23,000, bringing its population above 100,000. It is now within 9,200 residents of becoming South Carolina's largest city. And Charleston's suburbs were among the state's fastest growing major municipalities, including Summerville (+56.4%), Mount Pleasant (+42.5%), Goose Creek (+23.0%) and North Charleston (+22.4%). Upstate suburbs were also well-represented, with Greer (+51.5%), near the Greenville-Spartanburg Airport, and Mauldin (+50.3%) posting impressive growth rates. Charlotte-area Rock Hill (+32.9%), the city of Florence (+22.5%), Myrtle Beach (+19.1%) and Augusta, Georgia-area Aiken (+16.5%) also grew faster than the state. Upstate Spartanburg (-6.7%) was the only population loser among South Carolina's top 20 municipalities. Its upstate neighbor, Greenville, only grew by 4.3%.
South Carolina's non-Hispanic white population grew at a respectable 11.7%, three points faster than its non-Hispanic black population (+8.6%). As a result, South Carolina's non-Hispanic African-American population decreased from 29.4% to 27.7% of the state's population. But because South Carolina's Hispanic population (+147.9%) more than doubled and non-Hispanic Asian population (+63.9%) rapidly grew, South Carolina's non-Hispanic white percentage also dropped 2 points from 66.1% to 64.1% of the population. Hispanics make up 5.1% and non-Hispanic Asians 1.3% of South Carolina's residents.
Title: Re: Official US 2010 Census Results
Post by: True Federalist (진정한 연방 주의자) on March 23, 2011, 06:36:25 PM
South Carolina
Every one of the top 20 counties grew.
Every one of the top 20 counties grew.
Make that every one of the current top 20 counties. The #17 county for 2000, Laurens County, lost population, which is precisely why it no longer is in the top 20 at all.
Title: Re: Official US 2010 Census Results
Post by: Dgov on March 23, 2011, 06:40:27 PM
I wonder if this means that a 2nd Black-majority district isn't required. It was hard enough trying to draw two beforehand.
Title: Re: Official US 2010 Census Results
Post by: cinyc on March 23, 2011, 06:46:31 PM
South Carolina
Every one of the top 20 counties grew.
Every one of the top 20 counties grew.
Make that every one of the current top 20 counties. The #17 county for 2000, Laurens County, lost population, which is precisely why it no longer is in the top 20 at all.
True. As always, I write these things based on the Census' 2010 top 20 lists unless I see something else on the maps or take the time to download additional data.
Along those lines, McDowell County West Virginia lost 19.1% of its population, the most in that state. It's the southernmost county in the state. Outside of the Greenbrier/White Sulfur Springs resorty area, southern West Virginia didn't fare so well.
I wonder if this means that a 2nd Black-majority district isn't required. It was hard enough trying to draw two beforehand.
FWIW - Non-Hispanic black VAP is even lower - 26.3%.
Title: Re: Official US 2010 Census Results
Post by: True Federalist (진정한 연방 주의자) on March 23, 2011, 06:55:30 PM
I wonder if this means that a 2nd Black-majority district isn't required. It was hard enough trying to draw two beforehand.
The expectation has been that they'll be able to get away with just one, but we'll see. It will end up being a hellacious looking gerrymander if they can, and if they can, it likely will be one that can't be drawn exactly using Dave's Apportionment Program. South Carolina has used split precincts before, and if need be it probably will again. Back in the early 90's I lived in a split precinct in Columbia that was right at the tip of the curlique in the border between the 2nd and 6th districts. Going in a straight line in any direction from where I lived then, you crossed the boundary between the 2nd and 6th districts at least three times.
Title: Re: Official US 2010 Census Results
Post by: jimrtex on March 23, 2011, 08:39:01 PM
South Carolina
Unlike the other slow- or no-growth states released this week, South Carolina grew at a brisk 15.3% pace. Every one of the top 20 counties grew. The fastest-growing counties were largely suburban or coastal. Charleston-suburban Dorchester County (Summerville; +41.6%) lead the growth parade, followed by Charlotte, North Carolina-suburban York County (Rock Hill;+ 37.3%), Myrtle Beach's Horry County (+37.0%) and coastal Beaufort County (+34.1%), home of ritzy Hilton Head Island and Beaufort's U.S. Marine bases, including Parris Island. Horry County picked up the most new residents - over 72,000, about 1,000 more residents than the largest county in the state, Greenville (+18.9%), in upstate South Carolina. Other major counties that grew faster than the state include Charlotte-exurban Lancaster (+24.9%), Charleston-suburban Berkeley (+24.7%), Columbia-suburban Lexington (+21.5%) and Columbia's county, Richland (+19.9%). Charleston County grew by 13.0%. In upstate, Anderson County (+12.9%) and Spartanburg County (+12.0%) slightly lagged the state. Some I-95 counties containing smaller towns barely grew, among them Orangeburg County (+1.0%), Sumter County (+2.7%) and Darlington County (+1.9%), near Florence. And 12 more rural counties lost population.
On the municipal level, the state capital of Columbia (+11.2%) held off Charleston (+24.2%) to remain the state's largest city. Charleston picked up the most new residents of any city in the state, over 23,000, bringing its population above 100,000. It is now within 9,200 residents of becoming South Carolina's largest city. And Charleston's suburbs were among the state's fastest growing major municipalities, including Summerville (+56.4%), Mount Pleasant (+42.5%), Goose Creek (+23.0%) and North Charleston (+22.4%). Upstate suburbs were also well-represented, with Greer (+51.5%), near the Greenville-Spartanburg Airport, and Mauldin (+50.3%) posting impressive growth rates. Charlotte-area Rock Hill (+32.9%), the city of Florence (+22.5%), Myrtle Beach (+19.1%) and Augusta, Georgia-area Aiken (+16.5%) also grew faster than the state. Upstate Spartanburg (-6.7%) was the only population loser among South Carolina's top 20 municipalities. Its upstate neighbor, Greenville, only grew by 4.3%.
South Carolina's non-Hispanic white population grew at a respectable 11.7%, three points faster than its non-Hispanic black population (+8.6%). As a result, South Carolina's non-Hispanic African-American population decreased from 29.4% to 27.7% of the state's population. But because South Carolina's Hispanic population (+147.9%) more than doubled and non-Hispanic Asian population (+63.9%) rapidly grew, South Carolina's non-Hispanic white percentage also dropped 2 points from 66.1% to 64.1% of the population. Hispanics make up 5.1% and non-Hispanic Asians 1.3% of South Carolina's residents.
Title: Re: Official US 2010 Census Results
Post by: cinyc on March 23, 2011, 08:52:13 PM
Greenville was South Carolina's 4th largest city in 2000. It was passed by Mount Pleasant and Rock Hill over the past decade, and is now 6th largest. Spartanburg fell from 7th largest to 11th.
Title: Re: Official US 2010 Census Results
Post by: True Federalist (진정한 연방 주의자) on March 23, 2011, 10:03:17 PM
I would have guessed that Greenville or Spartanburg would have made the top 5 cities. This was somewhat similar to Orlando, which is actually a pretty small city.
It can be quite difficult for a municipality in South Carolina to expand its borders on anything like a logical basis.
Title: Re: Official US 2010 Census Results
Post by: cinyc on March 24, 2011, 01:59:35 AM
The Boston Globe has some nice Massachusetts maps, for those who want to delve deeper into that state's data:
http://www.boston.com/news/local/massachusetts/graphics/03_22_11_2010_census_town_population/
http://www.boston.com/news/local/massachusetts/graphics/03_22_11_2010_census_town_population/
Title: Re: Official US 2010 Census Results
Post by: Bacon King on March 24, 2011, 04:45:18 AM
The Boston Globe has some nice Massachusetts maps, for those who want to delve deeper into that state's data:
http://www.boston.com/news/local/massachusetts/graphics/03_22_11_2010_census_town_population/
http://www.boston.com/news/local/massachusetts/graphics/03_22_11_2010_census_town_population/
LOL @ the two towns with -100% change in black population: presumably, the only black family in town moved out.
Title: Re: Official US 2010 Census Results
Post by: minionofmidas on March 24, 2011, 11:48:25 AM
Quick list of US cities over 600k
New York tbd
LA 3.793mio
Chicago 2.696mio
Houston 2.099mio
Philadelphia 1.526mio
Phoenix 1.446mio
San Antonio 1.327mio
SD 1.307mio
Dallas 1.198mio
San Jose 946k
Indy 830k
Jacksonville 822k
San Francisco 805k
Austin 790k
Columbus 787k
Fort Worth 741k
Louisville 741k
Charlotte 731k
Detroit 714k
El Paso 649k
Memphis 647k
Nashville 627k
Baltimore 621k
Boston 618k
Seattle 609k
DC 602k
Denver 600k
(we don't have DC's block data or racial breakdown yet, but we have the baseline figure)
How far Detroit has fallen... Mind you, Baltimore and Boston (and New Orleans, far from the list) peaked at even higher places than Detroit, which never made it past fourth, much longer ago though.
Title: Re: Official US 2010 Census Results
Post by: cinyc on March 24, 2011, 01:03:55 PM
NYC: 8,175,133 (+2.1%)
DC lost 11.5% of its non-Hispanic black population and is now just barely majority non-Hispanic black - 50.03%. DC's non-Hispanic white population grew by 31.6% - faster than its Hispanic population (21.8%).
DC lost 11.5% of its non-Hispanic black population and is now just barely majority non-Hispanic black - 50.03%. DC's non-Hispanic white population grew by 31.6% - faster than its Hispanic population (21.8%).
Title: Re: Official US 2010 Census Results
Post by: Linus Van Pelt on March 24, 2011, 01:18:25 PM
The upstate's holding OK, all things considered, except for Western New York. Even Monroe and Onondaga grew. As we saw with Wisconsin, the severe losses are really just in the core rust belt extending from the southern tip of Lake Michigan to the eastern tip of Lake Erie, rather than the broader industrial midwest.
(There are also major losses in agricultural areas all around, but that's a separate issue).
(There are also major losses in agricultural areas all around, but that's a separate issue).
Title: Re: Official US 2010 Census Results
Post by: cinyc on March 24, 2011, 01:22:10 PM
The mean population center of the US is in the northwest corner of Texas County, Missouri, probably somewhere near Roby, Missouri. The 2000-2010 shift was the most southerly shift ever (compass wise). It didn't move as far westward as the past few decades.
Title: Re: Official US 2010 Census Results
Post by: cinyc on March 24, 2011, 01:51:16 PM
Maine
Maine grew at a 4.2% pace. All but two of its 16 counties grew, both on Maine's eastern border with Canada. Downeast Washington County, home to the easternmost point in the United States, lost 3.2% of its population. Maine's hat, Aroostook County (Presque Isle) lost 2.8%.
Coastal Waldo County (Belfast; +6.9%) grew fastest - though it's not immediately clear why. The county is somewhat close to Bangor, but doesn't seem terribly suburban. Bangor's Penobscot County (+6.2%) was next, followed by Porland's Cumberland County (+6.0%), which picked up the most new residents and remains the largest county in the state, and south coastal York County (+5.6%). Oxford County (+5.6%) on the New Hampshire border, Hancock County (Bar Harbor/Arcadia National Park; +5.1%), Franklin County (+4.4%) in northeast Maine and the state capital of Augusta's Kennebec County (+4.3%) also grew faster than the state. Coastal Knox County (Rockport; +0.3%) and Sagadahoc County (Bath; +0.2%) barely grew.
On the municipal level, the Portland suburb of Gorham (+15.8%) grew fastest among the top 20 municipalities and picked up the most new residents, 2,240. It is near the University of Southern Maine. Gorham was followed by another Portland suburb, Windham (+14.1%), the college town of Orono (+13.7%), near Bangor, and Portland-suburban Scarborough (+11.5%). Other Portland suburbs, including Falmouth (+8.5%), Westbrook (+8.4%), South Portland (+7.2%) and Standish (+6.3%) also grew faster than the state. Portland (+3.0%) lagged state growth, but picked up about 1,950 new residents.
The picture was more mixed in coastal York County on the New Hampshire border. Saco (+9.9%) almost posted double-digit growth, while Kennebunk (+3.1%) and Saco's neighbor, Biddleford (+1.6%) lagged the state, inland Sanford was flat (-0.0%) and the town of York (-2.5%) lost population. In the rest of the state, Steven King's Bangor (+5.0%) and the state capital of Augusta (+3.1%) grew, Waterville (+0.7%) was flat and Brunswick (-4.2%) and Auburn (-0.6%) lost population.
Maine's non-Hispanic white population increased by 2.0%. Its non-Hispanic black population (+135.3%) more than doubled and its Hispanic population (+80.9%) almost doubled. Non-Hispanic Asians increased by 49.1%. Those last three figures may sound impressive, but each minority group makes up only a little over 1% of Maine's population. Maine is still 94.4% non-Hispanic white.
New York
New York State and City both grew at a 2.1% clip. Among the five boroughs of New York, Staten Island (Richmond County) grew the fastest, at a 5.6% clip, followed by the Bronx (+3.9%), which picked up the most new residents, Manhattan (New York County; +3.2%), Brooklyn (Kings County; +1.6%) and Queens (+0.1%). Outside of NYC, the fastest growing of the top 20 counties were suburban/exurban. Albany-suburban Saratoga County (+9.5%) lead the pack, followed by the usual suspects in the far NYC suburbs/exurbs: Orange County (+9.2%), Rockland County (+8.7%) and Dutchess County (+6.2%) in the northern suburbs and Suffolk County (+5.2%) on the east end of Long Island. Suffolk picked up the most new residents of the state. NYC's closer-in suburban counties, Westchester (+2.8%) and Nassau (+0.4) also grew.
Upstate, many Western New York Counties lost population, including Buffalo's Erie County (-3.3%) and Niagara Falls' Niagara County (-1.5%). Somewhat surprisingly, Rochester's Monroe County (+1.2%), Syracuse's Onaodaga County (+1.9%) and Binghamton's Broome County (+0.0%) all grew, even if their growth lagged the state's. Albany County (+3.3%) and NYC uber-exurban Ulster County (+2.7%) grew faster than the state, while Utica's Oneida County (-0.3%) showed a slight decline.
On the municipal level, Upstate Buffalo (-10.7%), Niagara Falls (-9.7%), Rochester (-4.2%), Rome (-3.5%), Syracuse (-1.5%) and Bighamton (-0.0%) lost population. Utica (+2.6%) grew faster than the state. The Albany-area cities of Schenectady (+7.0), Albany (+2.3%) and Troy (+2.0%) all grew. The New York suburban picture was mixed with the city of Poughkeepsie (+9.6) growing fastest. In north-suburban Westchester County, White Plains (+7.1%) and New Rochelle (+6.8%) grew while Mount Vernon (-1.6%) and Yonkers (-0.1%) posted slight declines. On Long Island, the village of Valley Stream (+3.1%) grew while Long Beach (-6.2%), Hempstead village (-4.7%) and Freeport village (-2.1%) lost population.
New York State lost both non-Hispanic Whites (-3.9%) and non-Hispanic blacks (-1.0%). Its Hispanic population grew by 19.2% - which might not sound high relative to other states. But because New York was home to over 2.8 million Hispanics in 2000, it translates into a gain of almost 550,000 Hispanics, putting the Hispanic population at 3.4 million, 17.6% of the state's population. New York's non-Hispanic Asian population increased by 35.7%. It is now over 1.4 million.
Title: Re: Official US 2010 Census Results
Post by: Lunar on March 24, 2011, 05:10:23 PM
interactive racial map for NYC http://www.wnyc.org/articles/wnyc-news/2011/mar/24/black-white-shift/
Title: Re: Official US 2010 Census Results
Post by: cinyc on March 24, 2011, 05:59:08 PM
interactive racial map for NYC http://www.wnyc.org/articles/wnyc-news/2011/mar/24/black-white-shift/
Interesting. Harlem is getting less and less black. Charlie Rangel will be representing a majority Hispanic district before long - if he isn't already.
The mean population center of the US is 2.7 miles northeast of Plato, Missouri, at 37.517534 N, 92.173096 W. It is 23.4 miles SSW of last decade's mean population center near Edgar Springs, Missouri.
Title: Re: Official US 2010 Census Results
Post by: Lunar on March 24, 2011, 06:28:48 PM
WNYC's interactive plurality-racial map: http://project.wnyc.org/census-maps/2010pop.html?lat=40.7785&lon=-73.9644&zoom=12&sel=6
Title: Re: Official US 2010 Census Results
Post by: Lunar on March 24, 2011, 06:35:45 PM
()
Title: Re: Official US 2010 Census Results
Post by: cinyc on March 24, 2011, 06:51:23 PM
WNYC's interactive plurality-racial map: http://project.wnyc.org/census-maps/2010pop.html?lat=40.7785&lon=-73.9644&zoom=12&sel=6
It's bizarre that their map includes Sussex County, NJ, but not Suffolk County.
Title: Re: Official US 2010 Census Results
Post by: Lunar on March 24, 2011, 07:04:58 PM
WNYC's interactive plurality-racial map: http://project.wnyc.org/census-maps/2010pop.html?lat=40.7785&lon=-73.9644&zoom=12&sel=6
It's bizarre that their map includes Sussex County, NJ, but not Suffolk County.
It's a radio program, might just be wherever they're on the air?
Title: Re: Official US 2010 Census Results
Post by: Joe Biden 2020 on March 24, 2011, 07:08:20 PM
Where do I find out the stats for Oklahoma? I can't find it on census.gov, yet.
Title: Re: Official US 2010 Census Results
Post by: cinyc on March 24, 2011, 07:12:42 PM
WNYC's interactive plurality-racial map: http://project.wnyc.org/census-maps/2010pop.html?lat=40.7785&lon=-73.9644&zoom=12&sel=6
It's bizarre that their map includes Sussex County, NJ, but not Suffolk County.
It's a radio program, might just be wherever they're on the air?
I doubt their signal makes it all the way out to High Point, NJ but not to West Babylon.
It's probably just random. One set of maps includes Orange and Putnam counties. The other doesn't. Neither include Suffolk.
Title: Re: Official US 2010 Census Results
Post by: cinyc on March 24, 2011, 07:14:32 PM
Where do I find out the stats for Oklahoma? I can't find it on census.gov, yet.
They should be in the new American Factfinder:
http://factfinder2.census.gov/faces/nav/jsf/pages/index.xhtml
The old American Factfinder was much more intuitive.
Title: Re: Official US 2010 Census Results
Post by: Joe Biden 2020 on March 24, 2011, 07:33:19 PM
Where do I find out the stats for Oklahoma? I can't find it on census.gov, yet.
They should be in the new American Factfinder:
http://factfinder2.census.gov/faces/nav/jsf/pages/index.xhtml
The old American Factfinder was much more intuitive.
I find Oklahoma City and the top 20 cities in Oklahoma, but I don't find the smaller towns. Are they not released, yet?
Title: Re: Official US 2010 Census Results
Post by: cinyc on March 24, 2011, 08:08:50 PM
Where do I find out the stats for Oklahoma? I can't find it on census.gov, yet.
They should be in the new American Factfinder:
http://factfinder2.census.gov/faces/nav/jsf/pages/index.xhtml
The old American Factfinder was much more intuitive.
I find Oklahoma City and the top 20 cities in Oklahoma, but I don't find the smaller towns. Are they not released, yet?
As of 2PM this afternoon, redistricting data for every state has been released. Oklahoma's data should have been put in the new American Factfinder within 24 hours of release a few weeks ago. If it is not, You could always download the Oklahoma file from census' redistricting FTP site (http://www2.census.gov/census_2010/01-Redistricting_File--PL_94-171/).
Title: Re: Official US 2010 Census Results
Post by: Lunar on March 24, 2011, 08:12:20 PM
Yvette Clarke has the district that is most underpopulated east of Buffalo. Wow.
Title: Re: Official US 2010 Census Results
Post by: danny on March 24, 2011, 08:12:54 PM
Interesting. Harlem is getting less and less black. Charlie Rangel will be representing a majority Hispanic district before long - if he isn't already.
Rangel's district actually became less Hispanic in the last 10 years it was 48% Hispanic in 2000 and 46% in 2010, while blacks went from 30% to 26%. It's whites that gained going from 16% to 21%.
Title: Re: Official US 2010 Census Results
Post by: cinyc on March 24, 2011, 08:27:23 PM
Interesting. Harlem is getting less and less black. Charlie Rangel will be representing a majority Hispanic district before long - if he isn't already.
Rangel's district actually became less Hispanic in the last 10 years it was 48% Hispanic in 2000 and 46% in 2010, while blacks went from 30% to 26%. It's whites that gained going from 16% to 21%.
Rangel's district will need to pick up about 77,000 new residents. Moving it into the Bronx will inevitably pick up more Hispanics than blacks. The black sections of the South Bronx are more Hispanic than black now. Getting it up to the more heavily African-American areas of the North Bronx would be a strange Gerrymander. Moving it South into the Upper West Side or east into Queens would pick up more Whites.
Jerrold Nadler's NY-08 is the closest to the ideal population, needing only about 4,000 new residents. NY-01 in Suffolk County is also pretty close, just over 12,000. Ever other district needs to find more than 17,000 residents.
Title: Re: Official US 2010 Census Results
Post by: Lunar on March 24, 2011, 08:47:24 PM
Brooklyn's Asian population grew by more than 40%, even though the population barely grew at all overall (according to Census):
()
()
Title: Re: Official US 2010 Census Results
Post by: minionofmidas on March 26, 2011, 05:34:43 AM
Interesting. Harlem is getting less and less black. Charlie Rangel will be representing a majority Hispanic district before long - if he isn't already.
Rangel's district actually became less Hispanic in the last 10 years it was 48% Hispanic in 2000 and 46% in 2010, while blacks went from 30% to 26%. It's whites that gained going from 16% to 21%.
Rangel's district will need to pick up about 77,000 new residents. Moving it into the Bronx will inevitably pick up more Hispanics than blacks. The black sections of the South Bronx are more Hispanic than black now. Getting it up to the more heavily African-American areas of the North Bronx would be a strange Gerrymander. Moving it South into the Upper West Side or east into Queens would pick up more Whites.
Also, Harlem has probably the most Hispanic Blacks in the nation (huge DomRep immigrant population.) These figures are for non-Hispanic Blacks.
Title: Re: Official US 2010 Census Results
Post by: minionofmidas on March 26, 2011, 05:46:09 AM
New York state's Hispanic Black population rose by 44%, to almost 300k. Almost a quarter of the national Hispanic Black population is in New York state.
Title: Re: Official US 2010 Census Results
Post by: Landslide Lyndon on March 26, 2011, 10:16:08 AM
New York state's Hispanic Black population rose by 44%, to almost 300k. Almost a quarter of the national Hispanic Black population is in New York state.
Are Haitians considered Hispanics?
Title: Re: Official US 2010 Census Results
Post by: Verily on March 26, 2011, 10:49:48 AM
New York state's Hispanic Black population rose by 44%, to almost 300k. Almost a quarter of the national Hispanic Black population is in New York state.
Are Haitians considered Hispanics?
No, but black Dominicans are. They're the main Hispanic black group.
Title: Re: Official US 2010 Census Results
Post by: ○∙◄☻¥tπ[╪AV┼cVê└ on March 26, 2011, 04:40:59 PM
Some very racially diverse tracts.
Oakland's 4064, near Central Reservoir.
Blacks 27%
Asians 26%
Whites 25%
Hispanics 17%
Multiracial 3%
Native American 1%
Other 1%
A tract near Suisan City, CA
Whites 31%
Asians 24%
Hispanics 20%
Blacks 18%
Multiracial 7%
Native American 1%
Other 1%
Queens 542
Blacks 27%
Asians 26%
Hispanics 22%
Multiracial 10%
Other 10%
Whites 6%
Native Americans 1%
Title: Re: Official US 2010 Census Results
Post by: cinyc on March 26, 2011, 08:27:29 PM
Rangel has no problem representing Hispanics. Or had, anyways, before his ethic troubles hit. No idea who still supported him in the 2010 primary - though his stronger challengers were Black too IIRC.
Also, Harlem has probably the most Hispanic Blacks in the nation (huge DomRep immigrant population.) These figures are for non-Hispanic Blacks.
Also, Harlem has probably the most Hispanic Blacks in the nation (huge DomRep immigrant population.) These figures are for non-Hispanic Blacks.
I never said he'd have trouble with it. I just made the observation that Harlem is becoming more white as non-Hispanic blacks leave Harlem and, in many cases, New York City. They might try to stretch Rangel's district into the North Bronx to pick up more non-Hispanic blacks. But his new district otherwise might end up being majority Hispanic instead of plurality so - unless it moves south into the Upper West Side or east into Astoria.
NYC's Dominican population in more in Washington Heights than Harlem (also in Rangel's district, IIRC).
Title: Re: Official US 2010 Census Results
Post by: ○∙◄☻¥tπ[╪AV┼cVê└ on March 26, 2011, 08:32:01 PM
OK, after looking around more, it looks like Anchorage actually has the most diverse census tract, despite every tract being plurality white. This is the least white one.
White 24%
Asian 17%
Native American 16%
Black 13%
Hispanic 12%
Other 9%
Multiracial 9%
White 24%
Asian 17%
Native American 16%
Black 13%
Hispanic 12%
Other 9%
Multiracial 9%
Title: Re: Official US 2010 Census Results
Post by: Bacon King on March 26, 2011, 08:37:00 PM
Question: what's up with South Richmond Hill, in Queens? Several tracts are around 20% multiracial and every tract in the neighborhood is at least 10% or so.
Title: Re: Official US 2010 Census Results
Post by: Bacon King on March 26, 2011, 08:40:57 PM
Here's some really diverse tracts I've found, jfern-
Tract 1, South Richmond Hill, Queens:
25% Asian
24% Hispanic
15% Black
12% multiracial
11% White
11% Other
2% Native American
tract 6729, west Houston, TX:
28% Black
25% Hispanic
25% White
20% Asian
tract 251802, Vallejo, CA:
25% Hispanic
24% White
23% Black
23% Asian
Tract 1, South Richmond Hill, Queens:
25% Asian
24% Hispanic
15% Black
12% multiracial
11% White
11% Other
2% Native American
tract 6729, west Houston, TX:
28% Black
25% Hispanic
25% White
20% Asian
tract 251802, Vallejo, CA:
25% Hispanic
24% White
23% Black
23% Asian
Title: Re: Official US 2010 Census Results
Post by: Linus Van Pelt on March 26, 2011, 08:41:51 PM
Question: what's up with South Richmond Hill, in Queens? Several tracts are around 20% multiracial and every tract in the neighborhood is at least 10% or so.
Richmond Hill has a large Indo-Caribbean community (Guyanese, Trinidadians etc.), so it's likely people with South Asian/Black ancestry.
Title: Re: Official US 2010 Census Results
Post by: minionofmidas on March 27, 2011, 04:46:10 AM
The city of Jersey City has racial stats similar to these census tracts.
Title: Re: Official US 2010 Census Results
Post by: minionofmidas on March 27, 2011, 06:57:44 AM
Anybody know why Ft Worth grew by 39% - well above the Tarrant growth rate? Incorporations, or is there something else afoot?
Title: Re: Official US 2010 Census Results
Post by: Bacon King on March 27, 2011, 07:56:17 AM
Anybody know why Ft Worth grew by 39% - well above the Tarrant growth rate? Incorporations, or is there something else afoot?
"Fort Worth's sharp population growth was tempered by the more than 30 square miles the city annexed over the last decade." (http://www.star-telegram.com/2011/03/05/2899316/parts-of-tarrant-grew-much-denser.html)
Ft. Worth's expansion in the last decade also pushed it a bit into Denton, Wise, and Parker Counties, which also contributed to the city outpacing Tarrant County.
Title: Re: Official US 2010 Census Results
Post by: Lunar on March 27, 2011, 08:07:48 AM
Question: what's up with South Richmond Hill, in Queens? Several tracts are around 20% multiracial and every tract in the neighborhood is at least 10% or so.
Richmond Hill has a large Indo-Caribbean community (Guyanese, Trinidadians etc.), so it's likely people with South Asian/Black ancestry.
interesting that the multi-racial population in these tracts is actually decreasing though
Title: Re: Official US 2010 Census Results
Post by: Lunar on March 27, 2011, 08:16:56 AM
What's the most Asian tract in the entire country? Somewhere in Queens, Hawaii, or San Francisco?
My tract is 62% fwiw
edit: Most I've found is a 90% S.F. tract
My tract is 62% fwiw
edit: Most I've found is a 90% S.F. tract
Title: Re: Official US 2010 Census Results
Post by: Verily on March 27, 2011, 08:24:58 AM
Try the San Gabriel Valley near LA, too.
Title: Re: Official US 2010 Census Results
Post by: Bacon King on March 27, 2011, 08:45:49 AM
I looked around and couldn't find anything more than the 90% SF ward. Closest was an 88% ward in Manhattan's Chinatown.
Title: Re: Official US 2010 Census Results
Post by: Landslide Lyndon on March 27, 2011, 11:46:26 AM
Arabs and Persians are counted as Asians?
Title: Re: Official US 2010 Census Results
Post by: minionofmidas on March 27, 2011, 11:48:23 AM
Arabs and Persians are counted as Asians?
Title: Re: Official US 2010 Census Results
Post by: cinyc on March 27, 2011, 01:30:24 PM
Arabs and Persians are counted as Asians?
Dearborn reported as just under 87% non-Hispanic White and just 2% Asian in the last census. The Non-Hispanic White share of population actually increased by about 2 points from 2000, most likely at the expense of multiracial or other - though I only copied NH-White/Black/American Indian/Asian/Hispanic to my worksheet and would have to go back to the original dataset to see whether Dearborn had more multi-racials or others. Per Wikipedia, it was multiracials in 2000. The percentage of Dearborn residents reporting as one of the 5 listed categories increased from about 91% to about 95% over the past decade.
Title: Re: Official US 2010 Census Results
Post by: Landslide Lyndon on March 27, 2011, 01:37:55 PM
So I guess that when we talk about Asians, we talk about people from the Far East (China, Japan, Korea, Indonesia, etc.) and from the Indian subcontinent.
Title: Re: Official US 2010 Census Results
Post by: Lunar on March 27, 2011, 01:46:34 PM
I looked around and couldn't find anything more than the 90% SF ward. Closest was an 88% ward in Manhattan's Chinatown.
There's an 89% Asian district in Chicago too
Title: Re: Official US 2010 Census Results
Post by: nclib on March 27, 2011, 01:50:01 PM
Can anyone find high (over 40%) Asian tracts outside the West Coast and the urban areas? I find one 54% outside Philly and several over 40%, up to 49%, in MontCo, MD.
Title: Re: Official US 2010 Census Results
Post by: cinyc on March 27, 2011, 01:54:03 PM
Can anyone find high (over 40%) Asian tracts outside the West Coast and the urban areas? I find one 54% outside Philly and several over 40%, up to 49%, in MontCo, MD.
I suppose that depends on how one defines "urban" and "west coast". There's a 70% Asian census tract in Edison, NJ. Central NJ has a lot of Asians.
Title: Re: Official US 2010 Census Results
Post by: Lunar on March 27, 2011, 01:56:14 PM
Can anyone find high (over 40%) Asian tracts outside the West Coast and the urban areas? I find one 54% outside Philly and several over 40%, up to 49%, in MontCo, MD.
Lowell MA has some Asian tracts too from the Cambodians hanging out there
Title: Re: Official US 2010 Census Results
Post by: Bacon King on March 27, 2011, 02:23:41 PM
Can anyone find high (over 40%) Asian tracts outside the West Coast and the urban areas? I find one 54% outside Philly and several over 40%, up to 49%, in MontCo, MD.
In Georgia, there are >40% Asian tracts in the northeast Atlanta suburbs.
In Louisiana, there are two Asian majority tracts in far eastern Orleans Parish (basically on the edge of the bayou) and Baton Rouge suburbia has a 41% Asian tract.
In Texas, Fort Bend County has plenty of Asian tracts, including one that's 67% Asian. A bunch in Houston suburbia too, up to 71% Asian. College Station has a 41% Asian tract.
NoVA has a few, too; and IIRC there's an Asian tract near Charlotte, NC. (edit: yep, at 41%. Also I see some Asian areas outside of Detroit, too)
Title: Re: Official US 2010 Census Results
Post by: cinyc on March 27, 2011, 02:48:16 PM
There's a 70% Asian tract on the campus of Purdue University in West Lafayette, Indiana. And there are 40-55% Asian tracts that include part of or are very near to the University of Wisconsin campus in Madison and the big universities in Champaign, Illinois, Ann Arbor and Lansing, Michigan.
Title: Re: Official US 2010 Census Results
Post by: Smash255 on March 27, 2011, 02:57:38 PM
Question: what's up with South Richmond Hill, in Queens? Several tracts are around 20% multiracial and every tract in the neighborhood is at least 10% or so.
Richmond Hill has a large Indo-Caribbean community (Guyanese, Trinidadians etc.), so it's likely people with South Asian/Black ancestry.
interesting that the multi-racial population in these tracts is actually decreasing though
Perhaps more people reporting as other??
I visited the area quite a bit as a kid as my grandparents lived right on Liberty Ave.
Title: Re: Official US 2010 Census Results
Post by: Smash255 on March 27, 2011, 03:18:43 PM
Can anyone find high (over 40%) Asian tracts outside the West Coast and the urban areas? I find one 54% outside Philly and several over 40%, up to 49%, in MontCo, MD.
Morrisville, NC has one tract which is 40% Asian, a few of the surrounding ones are 30%. Depending on what you mean by urban, you have a 42% in southwest Charlotte (while its in the city, the area looks suburban)
Also have a 40% tracts in western Nassau (Herricks with a few surrounding tracts at 39%, and others in the 30% + range (with some more over 40% ones over the Queens border
Title: Re: Official US 2010 Census Results
Post by: nclib on March 27, 2011, 07:54:48 PM
Can anyone find high (over 40%) Asian tracts outside the West Coast and the urban areas? I find one 54% outside Philly and several over 40%, up to 49%, in MontCo, MD.
Morrisville, NC has one tract which is 40% Asian, a few of the surrounding ones are 30%. Depending on what you mean by urban, you have a 42% in southwest Charlotte (while its in the city, the area looks suburban)
Also have a 40% tracts in western Nassau (Herricks with a few surrounding tracts at 39%, and others in the 30% + range (with some more over 40% ones over the Queens border
Morrisville is due to the proximity to Research Triangle Park. Not sure about the Charlotte one.
Quote
In Georgia, there are >40% Asian tracts in the northeast Atlanta suburbs.
That surprised me. While looking at that, I also saw one in Athens.
It appears that the only states without a black plurality tract are OR, ID, MT, WY, ND, SD, UT, NM, AK, HI, RI, VT, NH, and ME.
Title: Re: Official US 2010 Census Results
Post by: Lunar on March 27, 2011, 08:12:59 PM
What's with a 70% Asian tract in Lafayette Indiana?
Title: Re: Official US 2010 Census Results
Post by: Lunar on March 27, 2011, 08:14:05 PM
There's a 28% Asian tract in Southeast Iowa that has almost 13,000% growth over 2000
Title: Re: Official US 2010 Census Results
Post by: Linus Van Pelt on March 27, 2011, 08:29:11 PM
What's with a 70% Asian tract in Lafayette Indiana?
Purdue - Cinyc mentioned this earlier.
These single Asian census tracts on otherwise white campuses in the middle of the country are grad student housing - no midwestern state university has anything even close to an Asian-plurality undergraduate student body, but graduate housing is often very Asian since there are a lot of international students from Asia in the more technical programs who live in university housing since they don't know the local rental scene while the other grad students mostly live off-campus.
There's a 28% Asian tract in Southeast Iowa that has almost 13,000% growth over 2000
This is Maharishi Vedic City, actual name of an actual municipality that incorporated in 2001. Check it out on Wikipedia (http://en.wikipedia.org/wiki/Maharishi_Vedic_City,_Iowa) - it's super weird.
Title: Re: Official US 2010 Census Results
Post by: Bacon King on March 27, 2011, 08:41:00 PM
Quote
In Georgia, there are >40% Asian tracts in the northeast Atlanta suburbs.
That surprised me. While looking at that, I also saw one in Athens.
Gwinnett County has pretty sizable Vietnamese, Korean, and Hmong communities. The Athens tract is right by UGA so it's probably students.
Title: Re: Official US 2010 Census Results
Post by: Linus Van Pelt on March 27, 2011, 09:22:13 PM
The City of Portland no longer has any tracts that aren't white-plurality. The four adjacent Black tracts from 2000 in northeast Portland have undergone major gentrification and are now 53-27, 56-25, 52-27 and 56-26 white.
Title: Re: Official US 2010 Census Results
Post by: Verily on March 27, 2011, 10:20:40 PM
Weird that there is no black-plurality tract in Rhode Island. I see there are three in Pawtucket that come close, however.
Title: Re: Official US 2010 Census Results
Post by: Lunar on March 27, 2011, 10:42:49 PM
Check out those Hispanics in Providence and Central Falls RI though. They're going to be a very significant political force in Rhode Island soon enough
Title: Re: Official US 2010 Census Results
Post by: Smash255 on March 28, 2011, 01:20:23 AM
Can anyone find high (over 40%) Asian tracts outside the West Coast and the urban areas? I find one 54% outside Philly and several over 40%, up to 49%, in MontCo, MD.
Morrisville, NC has one tract which is 40% Asian, a few of the surrounding ones are 30%. Depending on what you mean by urban, you have a 42% in southwest Charlotte (while its in the city, the area looks suburban)
Also have a 40% tracts in western Nassau (Herricks with a few surrounding tracts at 39%, and others in the 30% + range (with some more over 40% ones over the Queens border
Morrisville is due to the proximity to Research Triangle Park. Not sure about the Charlotte one.
Figured that with Morrisville. The Charlotte one was in an area with growth of more than 170% (slightly under 700 to 1,824) with the Asian population going from approx 43 to approx 766. I have actually driven through that area (well technically a passenger) going back and forth from the Charlotte airport and my parents home (the Billy Graham Parkway is on the northern edge of the tract)
Title: Re: Official US 2010 Census Results
Post by: Torie on March 28, 2011, 01:38:29 AM
What's with a 70% Asian tract in Lafayette Indiana?
Purdue University.
Title: Re: Official US 2010 Census Results
Post by: jimrtex on March 28, 2011, 01:12:02 PM
Here's some really diverse tracts I've found, jfern-
tract 6729, west Houston, TX:
28% Black
25% Hispanic
25% White
20% Asian
tract 6729, west Houston, TX:
28% Black
25% Hispanic
25% White
20% Asian
I'd probably call it Katy, but its pretty big with 28,000 people so parts are near Sugar Land. And I think some of it is in the Lamar Consolidated ISD (Richmond-Rosenberg) and with a Richmond zip code.
So maybe just Fort Bend. It will be a little less diverse once it is divided up. On its west side is the Grand Parkway which gives access to either I-10 (Katy Freeway) or US 59 Southwest Freeway. And on the north is the Westpark Tollroad which gives access into the Galleria area and also connects with US 59 much closer to the city.
An interesting contrast is census tract 6737 just to the west with a 0% Asian population.
This is the TC Jester unit of the state prison system (which figures in the true life story on which the movie Sugarland Express (sic) is based. Many of the Texas prisons are in the Brazos bottoms, and were at one time self sufficient, growing food and cotton for prison clothing. Forced labor is now frowned upon, and a lot of the farm lands around the prisons proper, especially in the Houston area have been sold to developers, including some of the land in 6729 (though most of the development is further north along the Westpark Tollroad/Westheimer/FM-1093.
Title: Re: Official US 2010 Census Results
Post by: Linus Van Pelt on March 31, 2011, 12:41:54 PM
I guess I never knew this part of the background to this whole Lou Barletta thing, but Hazleton PA had an incredibly high influx of Hispanics over the decade, way more than the other ex-coal towns in the region - the % Hispanic for the city went from 5% in 2000 to 37% in 2010 and on the NY Times map the Hispanic increases for all the tracts within the city are 858%, 1,347%, 1,779%, 1,062%, 374%, 685%, 344% and 1043%. Does anyone know why this is?
Title: Re: Official US 2010 Census Results
Post by: Filuwaúrdjan on March 31, 2011, 12:56:51 PM
Presumably something to do with the local economy; IIRC Hazleton has a lot of the sort of low-paid manual jobs that tend to attract Hispanic immigrants (consumer manufacturing and something to do with warehousing if I remember right... and I almost certainly don't). Combine that with the state of the town, and, yeah.
Title: Re: Official US 2010 Census Results
Post by: cinyc on March 31, 2011, 01:04:32 PM
I guess I never knew this part of the background to this whole Lou Barletta thing, but Hazleton PA had an incredibly high influx of Hispanics over the decade, way more than the other ex-coal towns in the region - the % Hispanic for the city went from 5% in 2000 to 37% in 2010 and on the NY Times map the Hispanic increases for all the tracts within the city are 858%, 1,347%, 1,779%, 1,062%, 374%, 685%, 344% and 1043%. Does anyone know why this is?
Probably because that's where the low-paying jobs and cheap housing are. Hazleton is at the crossroads of I-81 and I-80. As a result, the area has a number of distribution centers and some manufacturing. The Hispanic population also increased in other Northeastern Pennsylvania cities.
Of course, Barletta wasn't acting in a vacuum when he tried to attack his city's illegal immigration problem.
Title: Re: Official US 2010 Census Results
Post by: nclib on April 02, 2011, 02:23:03 PM
These CD's have lost population:
NY 28, 27, 11, 15, 3, 6, 14
RI-1
WV-3
MI 13, 14, 5, 12, 1, 9
FL-10
KY-5
MN-4
TN-9
WI-4
OH 11, 1, 10, 17, 9, 6, 5
PA 14, 12, 2, 3
CA 31, 47, 33
NE-3
KS-1
AL-7
MO-1
TX-32
IL 1, 4, 2, 9, 17, 7, 5, 10
AR-4
IA-5
MD-7
LA 2, 3
MS-2
NJ-10
NY 28, 27, 11, 15, 3, 6, 14
RI-1
WV-3
MI 13, 14, 5, 12, 1, 9
FL-10
KY-5
MN-4
TN-9
WI-4
OH 11, 1, 10, 17, 9, 6, 5
PA 14, 12, 2, 3
CA 31, 47, 33
NE-3
KS-1
AL-7
MO-1
TX-32
IL 1, 4, 2, 9, 17, 7, 5, 10
AR-4
IA-5
MD-7
LA 2, 3
MS-2
NJ-10
Title: Re: Official US 2010 Census Results
Post by: Dgov on April 02, 2011, 05:16:52 PM
These CD's have lost population:
NY 28, 27, 11, 15, 3, 6, 14
RI-1
WV-3
MI 13, 14, 5, 12, 1, 9
FL-10
KY-5
MN-4
TN-9
WI-4
OH 11, 1, 10, 17, 9, 6, 5
PA 14, 12, 2, 3
CA 31, 47, 33
NE-3
KS-1
AL-7
MO-1
TX-32
IL 1, 4, 2, 9, 17, 7, 5, 10
AR-4
IA-5
MD-7
LA 2, 3
MS-2
NJ-10
NY 28, 27, 11, 15, 3, 6, 14
RI-1
WV-3
MI 13, 14, 5, 12, 1, 9
FL-10
KY-5
MN-4
TN-9
WI-4
OH 11, 1, 10, 17, 9, 6, 5
PA 14, 12, 2, 3
CA 31, 47, 33
NE-3
KS-1
AL-7
MO-1
TX-32
IL 1, 4, 2, 9, 17, 7, 5, 10
AR-4
IA-5
MD-7
LA 2, 3
MS-2
NJ-10
Interesting mix of rural and urban Black-majority districts. If those figures are right, the only black-majority districts that didn't lose population are NY-10, VA-3, NC-1, FL-17, FL-23, SC-6, GA-4, GA-5, and MD-4, and much of that gain is from non-black population growth.
Title: Re: Official US 2010 Census Results
Post by: Padfoot on April 02, 2011, 09:15:35 PM
These CD's have lost population:
NY 28, 27, 11, 15, 3, 6, 14
RI-1
WV-3
MI 13, 14, 5, 12, 1, 9
FL-10
KY-5
MN-4
TN-9
WI-4
OH 11, 1, 10, 17, 9, 6, 5
PA 14, 12, 2, 3
CA 31, 47, 33
NE-3
KS-1
AL-7
MO-1
TX-32
IL 1, 4, 2, 9, 17, 7, 5, 10
AR-4
IA-5
MD-7
LA 2, 3
MS-2
NJ-10
NY 28, 27, 11, 15, 3, 6, 14
RI-1
WV-3
MI 13, 14, 5, 12, 1, 9
FL-10
KY-5
MN-4
TN-9
WI-4
OH 11, 1, 10, 17, 9, 6, 5
PA 14, 12, 2, 3
CA 31, 47, 33
NE-3
KS-1
AL-7
MO-1
TX-32
IL 1, 4, 2, 9, 17, 7, 5, 10
AR-4
IA-5
MD-7
LA 2, 3
MS-2
NJ-10
Interesting mix of rural and urban Black-majority districts. If those figures are right, the only black-majority districts that didn't lose population are NY-10, VA-3, NC-1, FL-17, FL-23, SC-6, GA-4, GA-5, and MD-4, and much of that gain is from non-black population growth.
That adds more credence to the discussion of a new Great Migration in which black Americans are returning to the rising cities of the New South.
Title: Re: Official US 2010 Census Results
Post by: Dgov on April 02, 2011, 10:39:44 PM
These CD's have lost population:
NY 28, 27, 11, 15, 3, 6, 14
RI-1
WV-3
MI 13, 14, 5, 12, 1, 9
FL-10
KY-5
MN-4
TN-9
WI-4
OH 11, 1, 10, 17, 9, 6, 5
PA 14, 12, 2, 3
CA 31, 47, 33
NE-3
KS-1
AL-7
MO-1
TX-32
IL 1, 4, 2, 9, 17, 7, 5, 10
AR-4
IA-5
MD-7
LA 2, 3
MS-2
NJ-10
NY 28, 27, 11, 15, 3, 6, 14
RI-1
WV-3
MI 13, 14, 5, 12, 1, 9
FL-10
KY-5
MN-4
TN-9
WI-4
OH 11, 1, 10, 17, 9, 6, 5
PA 14, 12, 2, 3
CA 31, 47, 33
NE-3
KS-1
AL-7
MO-1
TX-32
IL 1, 4, 2, 9, 17, 7, 5, 10
AR-4
IA-5
MD-7
LA 2, 3
MS-2
NJ-10
Interesting mix of rural and urban Black-majority districts. If those figures are right, the only black-majority districts that didn't lose population are NY-10, VA-3, NC-1, FL-17, FL-23, SC-6, GA-4, GA-5, and MD-4, and much of that gain is from non-black population growth.
That adds more credence to the discussion of a new Great Migration in which black Americans are returning to the rising cities of the New South.
Or (more likely i think) that Blacks are following whites to the Suburbs. None of those districts that gained are very Urban (except NY-10 in central Brooklyn, though i don't think its pop gain was from blacks), and most like GA-4, MD-4, and FL-17 are more Suburban and Middle class than urban.
Also, this data is just for which districts LOST population, not which ones lost Blacks. I assume the Black population of the surrounding areas and districts picked up Blacks as a result as well.
Title: Re: Official US 2010 Census Results
Post by: Lunar on April 03, 2011, 01:53:13 AM
(except NY-10 in central Brooklyn, though i don't think its pop gain was from blacks),
I doubt that as well, NYC and Brooklyn had a very distinct increase in their white population overall and many key black areas showed a loss in population.
Title: Re: Official US 2010 Census Results
Post by: Bacon King on April 03, 2011, 02:03:07 AM
GA-5 is urban. But yeah, most of Atlanta's black growth has been in the suburbs.
Title: Re: Official US 2010 Census Results
Post by: nclib on April 03, 2011, 08:22:37 PM
Growth for non-Hispanic whites:
(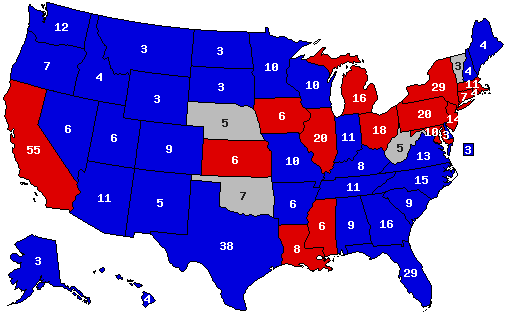 )
)
Blue = above average growth
Gray = below average growth
Red = population decline
Growth for minorities:
(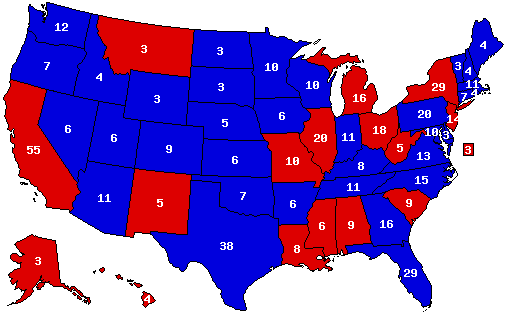 )
)
Blue = above average
Red = below average (DC was the only negative)
(
Blue = above average growth
Gray = below average growth
Red = population decline
Growth for minorities:
(
Blue = above average
Red = below average (DC was the only negative)
Title: Re: Official US 2010 Census Results
Post by: ElectionAtlas on April 22, 2011, 07:58:03 AM
Does anyone happen to know whether the Census Bureau has/will update past yearly estimates based on the new 2010 census?
Thanks,
Dave
Thanks,
Dave
Title: Re: Official US 2010 Census Results
Post by: minionofmidas on April 22, 2011, 08:34:57 AM
Does anyone happen to know whether the Census Bureau has/will update past yearly estimates based on the new 2010 census?
Thanks,
Dave
Thanks,
Dave
Title: Re: Official US 2010 Census Results
Post by: jimrtex on April 22, 2011, 06:48:07 PM
Does anyone happen to know whether the Census Bureau has/will update past yearly estimates based on the new 2010 census?
When they issue a new estimate they update previous estimates. For example, when the 2008 estimate is issued, they also include annual estimates for previous years, 2007, 2006, etc. The 2008 vintage estimate for 2007, is not necessarily the same as the 2007 vintage estimate for 2007. So there is some sort of retrospective correction. I don't know what the source of the correction is.
I don't think that they ever go backwards. While they will eventually issue a July 2010 estimate based on the 2010 census, they won't issue a 2009 estimate. They probably compare the two internally as part of an error analysis,
The estimates are based on a demographic model, including births, deaths, and migration, so they are probably accumulating error throughout the decade. But there annual changes are probably somewhat accurate in capturing changes in migration, birth and death rates. So you might be able to fit the 2010, 2009, 2008, estimate series to the 2000 and 2010 census date, and use that to produce a new estimate for an earlier year.
What are you trying to do?
Title: Re: Official US 2010 Census Results
Post by: hopper on May 09, 2012, 06:05:09 PM
These CD's have lost population:
NY 28, 27, 11, 15, 3, 6, 14
RI-1
WV-3
MI 13, 14, 5, 12, 1, 9
FL-10
KY-5
MN-4
TN-9
WI-4
OH 11, 1, 10, 17, 9, 6, 5
PA 14, 12, 2, 3
CA 31, 47, 33
NE-3
KS-1
AL-7
MO-1
TX-32
IL 1, 4, 2, 9, 17, 7, 5, 10
AR-4
IA-5
MD-7
LA 2, 3
MS-2
NJ-10
NY 28, 27, 11, 15, 3, 6, 14
RI-1
WV-3
MI 13, 14, 5, 12, 1, 9
FL-10
KY-5
MN-4
TN-9
WI-4
OH 11, 1, 10, 17, 9, 6, 5
PA 14, 12, 2, 3
CA 31, 47, 33
NE-3
KS-1
AL-7
MO-1
TX-32
IL 1, 4, 2, 9, 17, 7, 5, 10
AR-4
IA-5
MD-7
LA 2, 3
MS-2
NJ-10
Why did Ohio's Republican Congressional Districts lose so much population? Was it because of the loss of manufacturing jobs?
Title: Re: Official US 2010 Census Results
Post by: TJ in Oregon on May 09, 2012, 07:51:11 PM
Why did Ohio's Republican Congressional Districts lose so much population? Was it because of the loss of manufacturing jobs?
OH-1 is based around inner-city Cincinnati and most of the loss was people moving further and further out into the suburbs. This is an ancestral Republican seat that has become more Democratic due to the Republicans fleeing the city and was swingy by the end of the decade.
OH-6 is a formerly coal mining area along the Ohio River with a few rust belt towns that continue to bleed jobs. This is an ancestrally Democratic seat, originally drawn as a Democratic pack in 2002, that the Republicans just took over after the 2010 wave.
OH-5 is the scenario you're talking about more than anything else. It consists of a mix between farmland and heavily industrial towns across Northwest Ohio, neither of which are growing.
Title: Re: Official US 2010 Census Results
Post by: jimrtex on May 10, 2012, 10:12:08 AM
These CD's have lost population:
CA 31, 47, 33
CA 31, 47, 33
Title: Re: Official US 2010 Census Results
Post by: jimrtex on October 10, 2012, 07:56:30 PM
Does anyone happen to know whether the Census Bureau has/will update past yearly estimates based on the new 2010 census?
Thanks,
Dave
Thanks,
Dave
2000-2010 Intercensal Population and Housing Unit Estimates (http://www.census.gov/newsroom/releases/archives/population/cb12-tps70.html)
Title: Re: Official US 2010 Census Results
Post by: nclib on January 26, 2013, 12:54:16 PM
113th CD demographics have been released, though doesn't appear to list VAP or white non-hispanics.
http://www.census.gov/newsroom/releases/archives/american_community_survey_acs/cb13-tps07.html
http://www.census.gov/newsroom/releases/archives/american_community_survey_acs/cb13-tps07.html
Title: Re: Official US 2010 Census Results
Post by: muon2 on February 03, 2013, 08:28:35 AM
113th CD demographics have been released, though doesn't appear to list VAP or white non-hispanics.
http://www.census.gov/newsroom/releases/archives/american_community_survey_acs/cb13-tps07.html
http://www.census.gov/newsroom/releases/archives/american_community_survey_acs/cb13-tps07.html
Those are both cross tabs from race, hispanic and age. The easy stats don't list them, just the main categories. This is also only from the 1-year sample so the statistics get weaker as one tries to cross tabulate different questions.
Title: Re: Official US 2010 Census Results
Post by: jimrtex on February 04, 2013, 12:55:58 AM
113th CD demographics have been released, though doesn't appear to list VAP or white non-hispanics.
http://www.census.gov/newsroom/releases/archives/american_community_survey_acs/cb13-tps07.html
http://www.census.gov/newsroom/releases/archives/american_community_survey_acs/cb13-tps07.html
Those are both cross tabs from race, hispanic and age. The easy stats don't list them, just the main categories. This is also only from the 1-year sample so the statistics get weaker as one tries to cross tabulate different questions.
Presumably the 2012 release will have data for the congressional districts for the 113rd Congress. The raw ACS data has street addresses and block numbers, so tabulation should be
"trivial". The minimum sampling rate (one year) is 1.5%, so the estimates for CD-sized objects entities should be pretty good.
Title: Re: Official US 2010 Census Results
Post by: krazen1211 on February 04, 2013, 02:48:23 PM
http://online.wsj.com/article/SB10001424127887323375204578270053387770718.html
The fertility rate is the number of children an average woman bears over the course of her life. The replacement rate is 2.1. If the average woman has more children than that, population grows. Fewer, and it contracts. Today, America's total fertility rate is 1.93, according to the latest figures from the Centers for Disease Control and Prevention; it hasn't been above the replacement rate in a sustained way since the early 1970s.
The 2020 census might show an even smaller growth figure than the historically low 2010 census.
Title: Re: Official US 2010 Census Results
Post by: memphis on February 04, 2013, 02:59:34 PM
http://online.wsj.com/article/SB10001424127887323375204578270053387770718.html
The fertility rate is the number of children an average woman bears over the course of her life. The replacement rate is 2.1. If the average woman has more children than that, population grows. Fewer, and it contracts. Today, America's total fertility rate is 1.93, according to the latest figures from the Centers for Disease Control and Prevention; it hasn't been above the replacement rate in a sustained way since the early 1970s.
The 2020 census might show an even smaller growth figure than the historically low 2010 census.
The fertility rate is the number of children an average woman bears over the course of her life. The replacement rate is 2.1. If the average woman has more children than that, population grows. Fewer, and it contracts. Today, America's total fertility rate is 1.93, according to the latest figures from the Centers for Disease Control and Prevention; it hasn't been above the replacement rate in a sustained way since the early 1970s.
The 2020 census might show an even smaller growth figure than the historically low 2010 census.
Title: Re: Official US 2010 Census Results
Post by: nclib on February 04, 2013, 07:21:06 PM
113th CD demographics have been released, though doesn't appear to list VAP or white non-hispanics.
http://www.census.gov/newsroom/releases/archives/american_community_survey_acs/cb13-tps07.html
http://www.census.gov/newsroom/releases/archives/american_community_survey_acs/cb13-tps07.html
Those are both cross tabs from race, hispanic and age. The easy stats don't list them, just the main categories. This is also only from the 1-year sample so the statistics get weaker as one tries to cross tabulate different questions.
Presumably the 2012 release will have data for the congressional districts for the 113rd Congress. The raw ACS data has street addresses and block numbers, so tabulation should be
"trivial". The minimum sampling rate (one year) is 1.5%, so the estimates for CD-sized objects entities should be pretty good.
I.E., that data isn't available yet? When is it expected to come? Interesting since some states had NHW and VAP data available before the districts took effect.
Title: Re: Official US 2010 Census Results
Post by: Brittain33 on February 05, 2013, 12:46:50 PM
http://online.wsj.com/article/SB10001424127887323375204578270053387770718.html
The fertility rate is the number of children an average woman bears over the course of her life. The replacement rate is 2.1. If the average woman has more children than that, population grows. Fewer, and it contracts. Today, America's total fertility rate is 1.93, according to the latest figures from the Centers for Disease Control and Prevention; it hasn't been above the replacement rate in a sustained way since the early 1970s.
The 2020 census might show an even smaller growth figure than the historically low 2010 census.
The fertility rate is the number of children an average woman bears over the course of her life. The replacement rate is 2.1. If the average woman has more children than that, population grows. Fewer, and it contracts. Today, America's total fertility rate is 1.93, according to the latest figures from the Centers for Disease Control and Prevention; it hasn't been above the replacement rate in a sustained way since the early 1970s.
The 2020 census might show an even smaller growth figure than the historically low 2010 census.
True... but we do also know that immigration was high in the first two-thirds of the last decade, and has been much slower since about 2008, with no sign of it increasing. That would reinforce the declining birth rate trend.
Title: Re: Official US 2010 Census Results
Post by: jimrtex on February 05, 2013, 08:29:03 PM
113th CD demographics have been released, though doesn't appear to list VAP or white non-hispanics.
http://www.census.gov/newsroom/releases/archives/american_community_survey_acs/cb13-tps07.html
http://www.census.gov/newsroom/releases/archives/american_community_survey_acs/cb13-tps07.html
Those are both cross tabs from race, hispanic and age. The easy stats don't list them, just the main categories. This is also only from the 1-year sample so the statistics get weaker as one tries to cross tabulate different questions.
Presumably the 2012 release will have data for the congressional districts for the 113rd Congress. The raw ACS data has street addresses and block numbers, so tabulation should be
"trivial". The minimum sampling rate (one year) is 1.5%, so the estimates for CD-sized objects entities should be pretty good.
I.E., that data isn't available yet? When is it expected to come? Interesting since some states had NHW and VAP data available before the districts took effect.
The redistricting data released in Spring of 2011 included population counts by race, hispanicity, and for over 18 to the census block level. Since any software would be working at the block level, it would be easy to tabulate.
The Census Bureau has released the 113rd Congress to block number equivalency files, so you could calculate VAP by race and hispanicity.
The 2010 Census did not ask a citizenship question, but the Texas Legislative Council was able to generate CVAP from the ACS data, and they also produce election results by proposed district (they have to allocate precinct election results as necessary to do so).
The Census Bureau will also do a custom tabulation for a fee (minimum price $3000). The Census Bureau has to switch the ACS over from the 2000 Census Geography to the 2010 Census Geography (block definitions and numbers are not identical). To conduct the 2010 Census they must have had to conform their master list of addresses to the 2010 census geography, and must have an ongoing program to make corrections.
Title: Re: Official US 2010 Census Results
Post by: nclib on February 17, 2013, 10:06:20 PM
https://docs.google.com/file/d/0Bz_uFI8VY7xLQWlodGI1T1FiSUk/edit?pli=1
appears to include NHW VAP, but doesn't match up with DailyKos's numbers.
appears to include NHW VAP, but doesn't match up with DailyKos's numbers.
Title: Re: Official US 2010 Census Results
Post by: muon2 on May 23, 2013, 09:30:03 AM
City and town estimates (http://www.census.gov/popest/data/cities/totals/2012/index.html) for July 1, 2012 were just released by the Census. The press release (http://www.census.gov/newsroom/releases/archives/population/cb13-94.html) highlights the growth in TX.
Title: Re: Official US 2010 Census Results
Post by: danny on May 23, 2013, 11:22:40 AM
City and town estimates (http://www.census.gov/popest/data/cities/totals/2012/index.html) for July 1, 2012 were just released by the Census. The press release (http://www.census.gov/newsroom/releases/archives/population/cb13-94.html) highlights the growth in TX.
I don't think of San Marcos as a large city.
Title: Re: Official US 2010 Census Results
Post by: Benj on May 23, 2013, 11:40:24 AM
Some interesting figures in there.
NJ's Gold Coast is booming. Hoboken, Jersey City and West New York all grew well above the national growth rate and made it onto the >2.5% growth rate list (4.1% in Hoboken, 3.5% in WNY and 2.8% in JC, to 1.7% nationally--though that's actually a considerable slowdown in Hoboken compared to 2000-2010, but JC has already added more people than it did 2000-2010). Presumably Weehawken would also be on there if it had more than 50,000 people.
Some of the very-fast-percent-growers are interesting, too. Irvine, California is near the top despite being pretty heavily built up already. Rapid growth in the city proper of Denver is a bit surprising, too. And San Francisco made it onto the percentage growth list.
Nearly every large city is growing somewhat, even "sick man" cities like Philadelphia, Chicago, Baltimore and Newark that have seen declines within the past few decades. There are only six declining cities with a population >200,000 that I see (Detroit, Cleveland, Buffalo, Cincinnati, Toledo and Rochester).
Title: Re: Official US 2010 Census Results
Post by: Miles on May 23, 2013, 03:36:50 PM
City and town estimates (http://www.census.gov/popest/data/cities/totals/2012/index.html) for July 1, 2012 were just released by the Census. The press release (http://www.census.gov/newsroom/releases/archives/population/cb13-94.html) highlights the growth in TX.
Charlotte is #8 :D
Title: Re: Official US 2010 Census Results
Post by: cinyc on May 23, 2013, 10:34:33 PM
The North Dakota oil boom town of Williston was the fastest-growing city of 10,000 or more in the past year, followed by Saratoga Springs, UT (west of Provo) and Prosper, TX (north of Dallas).
Title: Re: Official US 2010 Census Results
Post by: Linus Van Pelt on May 27, 2013, 06:47:51 PM
A note of caution about these: the Census Bureau doesn't actually calculate births, deaths and migration for municipalities as it does for counties and states. Rather, the subcounty estimates are developed by distributing the county growth based on the number of housing units in each jurisdiction. For this reason they can run into trouble in areas where population change doesn't involve construction or demolition of housing. In particular in 2010 the local estimates appeared to underestimate population decline in some poor inner-city areas where vacancy rates increased significantly.
Title: Re: Official US 2010 Census Results
Post by: hopper on July 12, 2013, 05:21:23 PM
Some interesting figures in there.
NJ's Gold Coast is booming. Hoboken, Jersey City and West New York all grew well above the national growth rate and made it onto the >2.5% growth rate list (4.1% in Hoboken, 3.5% in WNY and 2.8% in JC, to 1.7% nationally--though that's actually a considerable slowdown in Hoboken compared to 2000-2010, but JC has already added more people than it did 2000-2010). Presumably Weehawken would also be on there if it had more than 50,000 people.
Some of the very-fast-percent-growers are interesting, too. Irvine, California is near the top despite being pretty heavily built up already. Rapid growth in the city proper of Denver is a bit surprising, too. And San Francisco made it onto the percentage growth list.
Nearly every large city is growing somewhat, even "sick man" cities like Philadelphia, Chicago, Baltimore and Newark that have seen declines within the past few decades. There are only six declining cities with a population >200,000 that I see (Detroit, Cleveland, Buffalo, Cincinnati, Toledo and Rochester).
NJ's Gold Coast is booming. Hoboken, Jersey City and West New York all grew well above the national growth rate and made it onto the >2.5% growth rate list (4.1% in Hoboken, 3.5% in WNY and 2.8% in JC, to 1.7% nationally--though that's actually a considerable slowdown in Hoboken compared to 2000-2010, but JC has already added more people than it did 2000-2010). Presumably Weehawken would also be on there if it had more than 50,000 people.
Some of the very-fast-percent-growers are interesting, too. Irvine, California is near the top despite being pretty heavily built up already. Rapid growth in the city proper of Denver is a bit surprising, too. And San Francisco made it onto the percentage growth list.
Nearly every large city is growing somewhat, even "sick man" cities like Philadelphia, Chicago, Baltimore and Newark that have seen declines within the past few decades. There are only six declining cities with a population >200,000 that I see (Detroit, Cleveland, Buffalo, Cincinnati, Toledo and Rochester).
Title: Re: Official US 2010 Census Results
Post by: Sbane on September 21, 2013, 10:40:31 AM
Some interesting figures in there.
NJ's Gold Coast is booming. Hoboken, Jersey City and West New York all grew well above the national growth rate and made it onto the >2.5% growth rate list (4.1% in Hoboken, 3.5% in WNY and 2.8% in JC, to 1.7% nationally--though that's actually a considerable slowdown in Hoboken compared to 2000-2010, but JC has already added more people than it did 2000-2010). Presumably Weehawken would also be on there if it had more than 50,000 people.
Some of the very-fast-percent-growers are interesting, too. Irvine, California is near the top despite being pretty heavily built up already. Rapid growth in the city proper of Denver is a bit surprising, too. And San Francisco made it onto the percentage growth list.
Nearly every large city is growing somewhat, even "sick man" cities like Philadelphia, Chicago, Baltimore and Newark that have seen declines within the past few decades. There are only six declining cities with a population >200,000 that I see (Detroit, Cleveland, Buffalo, Cincinnati, Toledo and Rochester).
NJ's Gold Coast is booming. Hoboken, Jersey City and West New York all grew well above the national growth rate and made it onto the >2.5% growth rate list (4.1% in Hoboken, 3.5% in WNY and 2.8% in JC, to 1.7% nationally--though that's actually a considerable slowdown in Hoboken compared to 2000-2010, but JC has already added more people than it did 2000-2010). Presumably Weehawken would also be on there if it had more than 50,000 people.
Some of the very-fast-percent-growers are interesting, too. Irvine, California is near the top despite being pretty heavily built up already. Rapid growth in the city proper of Denver is a bit surprising, too. And San Francisco made it onto the percentage growth list.
Nearly every large city is growing somewhat, even "sick man" cities like Philadelphia, Chicago, Baltimore and Newark that have seen declines within the past few decades. There are only six declining cities with a population >200,000 that I see (Detroit, Cleveland, Buffalo, Cincinnati, Toledo and Rochester).
Ok, I know this post is from many months ago....but in any case..Irvine actually has a good chunk of land to grow on. There are a lot of strawberry fields on the east side of town and the north edge of town next to the mountains has some space as well. I would not be surprised if Irvine kept growing for another decade or more. Also, townhomes and courtyard style homes are becoming more popular, as the city is very expensive to live in due to excellent schools. This will cause an increase in population density.
Title: Re: Official US 2010 Census Results
Post by: hopper on October 12, 2013, 05:49:58 PM
New Jersey Northeast Counties are growing:
Hudson County grew by 25,300 people in the decade ending 2010 Census but has grown by a whopping 18,000 people in the 2012 Census Estimate.
Bergen County grew by 21,000 people in the decade ending 2010 Census but has grown by 13,700 people in the 2012 Census Estimate .
Union County grew by 14,000 people in the decade ending 2010 Census but has grown by 7,500 people in the 2012 Census Estimate.
Morris County grew by 22,000 people in the decade ending 2010 Census and continues to grow by 5,700 people in the 2012 Census.
Essex County actually declined by 10,300 people in the decade ending 2010 Census but has came back up by 3,800 people in the 2012 Census. The county has experienced a population decline in each census except for 2000 since the 1970 Census when the county had 932.5K people. The county now has 787.7K people to give you an idea of the counties population drop. In the 2000 Census the population went up from 778.2K(1990 Census Figures) to 793.6K people in the county.
Middlesex County(a Central Eastern County of NJ) grew by 39,700 people in the decade ending 2010 Census and continues to grow by 13,300 people in the 2012 Census so it population growth is up there with Bergen County.
Conclusion: I guess people like their train ride to NYC or being close to NYC!
Title: Re: Official US 2010 Census Results
Post by: hopper on October 31, 2013, 12:49:17 PM
Morris County will pass Camden County as the 9th largest populated New Jersey County by the end of this decade.
Title: Re: Official US 2010 Census Results
Post by: hopper on November 01, 2013, 01:13:53 PM
I have done the math too Jersey City will just miss passing Newark as NJ's largest city population wise by decades end if both cities continue to grow the way they are the rest of this decade.
2020 Census:
Newark 279K
Jersey City 278K
2020 Census:
Newark 279K
Jersey City 278K
Title: Re: Official US 2010 Census Results
Post by: hopper on November 15, 2013, 11:07:06 PM
I am doing average race/ethnicity by Census US average and the average state where that ethnic group lives. For example the average US white population is 72.4% and the average white person lives in Oklahoma since Oklahoma is 72.2% white. I will do the same for other ethnicities.
US Hispanic Average Population: 16.3%, Illinois: 15.8%.
US Black Population Average: 12.6%, Ohio: 12.2%.
US Asian Population Average: 4.8%, Illinois: 4.8%.
Now I will do the same for population growth in the 2010 Census by race ethnicity. The average US Growth of the White Population was 5.7% and the average growth state wise of the white population was in Delaware where the white population grew by 5.8%. I will do the same for other race/ethnicity US growth average vs state average.
Black Population Growth US Average: 12.3%, Pennsylvania: 12.5%
Asian Population Growth US Average: 43.3%, Kansas: 44.8%
Hispanic Population US Average: 43.0%, Texas 41.8%
Title: Re: Official US 2010 Census Results
Post by: Nhoj on December 21, 2013, 11:21:10 PM
They just came out with a new explorer tool.
http://www.census.gov/censusexplorer/censusexplorer.html
http://www.census.gov/censusexplorer/censusexplorer.html
Title: Re: Official US 2010 Census Results
Post by: Nhoj on March 26, 2014, 05:14:14 PM
County and metro estimates are out tomorrow.
Title: Re: Official US 2010 Census Results
Post by: Gass3268 on March 26, 2014, 08:20:44 PM
County and metro estimates are out tomorrow.
Eeeek ;D
Title: Re: Official US 2010 Census Results
Post by: KingSweden on March 26, 2014, 08:47:28 PM
County and metro estimates are out tomorrow.
Eeeek ;D
I have been checking this forum for this every day for at least two weeks. Yay!