Title: State electricity profiles
Post by: greenforest32 on April 06, 2012, 11:52:53 PM
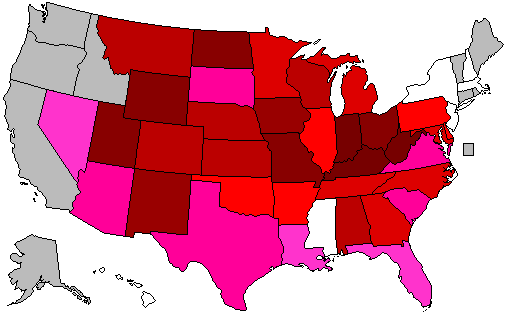
I thought it would be interesting to see what the makeup of each state's electricity profile would be. The most current figures I could find were for 2010 and I decided to just look at the predominant sources (coal, natural gas, nuclear, all renewables). No surprises really except for Hawaii and D.C. mainly using petroleum for electricity. Thought they'd be gassing it up. Anyway, the figures!
2010 Coal generation % list (http://www.eia.gov/electricity/state/unitedstates/index.cfm):
West Virginia - 96.7%
Kentucky - 92.7%
Indiana - 89.7%
Wyoming - 89.3%
Ohio - 82.1%
North Dakota - 81.9%
Missouri - 81.3%
Utah - 80.6%
Iowa - 71.8%
New Mexico - 70.7%
Colorado - 68.1%
Kansas - 67.8%
Nebraska - 63.8%
Wisconsin - 62.5%
Montana - 62.4%
Alabama - 62.3%
Michigan - 58.8%
North Carolina - 55.9%
Maryland - 54.3%
Georgia - 53.3%
Tennessee - 53.0%
Minnesota - 52.3%
Pennsylvania - 48.0%
Illinois - 46.5%
Arkansas - 46.2%
Delaware - 45.6%
Oklahoma - 43.6%
Arizona - 39.1%
Texas - 36.5%
South Carolina - 36.2%
Virginia - 34.9%
South Dakota - 32.8%
Florida - 26.1%
Lousiana - 23.3%
Nevada - 19.9%
Massachusetts - 19.4%
Mississippi - 16.1%
Hawaii - 14.3%
New Hampshire - 13.9%
New York - 9.9%
New Jersey - 9.8%
Alaska - 9.2%
Washington - 8.2%
Connecticut - 7.8%
Oregon - 7.5%
California - 1.1%
Idaho - 0.7%
Maine - 0.5%
Rhode Island - 0.0%
Vermont - 0.0%
D.C. - 0.0%
United States - 44.8%
2010 Coal generation % map:
( )
)
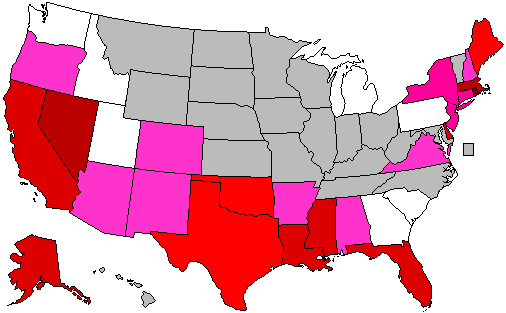
2010 Natural gas generation % list (http://www.eia.gov/electricity/state/unitedstates/index.cfm):
Rhode Island - 98.0%
Nevada - 67.4%
Massachusetts - 59.8%
Florida - 56.1%
Alaska - 55.5%
Mississippi - 54.4%
California - 52.7%
Delaware - 50.9%
Lousiana - 49.9%
Maine - 49.2%
Oklahoma - 47.0%
Texas - 45.4%
New Jersey - 37.9%
New York - 35.7%
Connecticut - 35.1%
Oregon - 28.4%
Arizona - 26.6%
Alabama - 25.8%
New Hampshire - 24.2%
New Mexico - 23.5%
Virginia - 23.3%
Colorado - 21.8%
Arkansas - 20.4%
Georgia - 17.4%
Utah - 15.3%
Pennsylvania - 14.7%
Idaho - 14.0%
Michigan - 11.0%
South Carolina - 10.5%
Washington - 10.0%
Wisconsin - 8.5%
Minnesota - 8.1%
Maryland - 6.6%
North Carolina - 6.6%
Indiana - 5.2%
Missouri - 5.1%
Ohio - 5.0%
Kansas - 4.8%
Illinois - 2.8%
Tennessee - 2.8%
Iowa - 2.3%
Kentucky - 1.9%
South Dakota - 1.3%
Nebraska - 1.0%
Wyoming - 1.0%
Montana - 0.2%
West Virginia - 0.2%
North Dakota - 0.1%
Vermont - 0.1%
Hawaii - 0.0%
D.C. - 0.0%
United States - 23.9%
2010 Natural gas generation % map:
( )
)
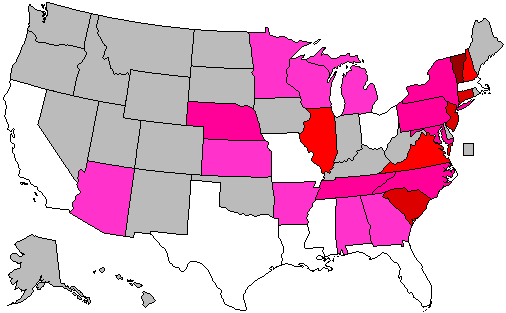
2010 Nuclear generation % list (http://www.eia.gov/electricity/state/unitedstates/index.cfm):
Vermont - 72.2%
Connecticut - 50.2%
New Jersey - 49.9%
South Carolina - 49.9%
New Hampshire - 49.2%
Illinois - 47.8%
Virginia - 36.4%
Pennsylvania - 33.9%
Tennessee - 33.7%
Maryland - 32.1%
North Carolina - 31.7%
New York - 30.6%
Nebraska - 30.2%
Arizona - 27.9%
Michigan - 26.6%
Minnesota - 25.1%
Alabama - 24.9%
Arkansas - 24.6%
Georgia - 24.4%
Wisconsin - 20.7%
Kansas - 19.9%
Louisiana - 18.1%
Mississippi - 17.7%
California - 15.8%
Massachusetts - 13.8%
Ohio - 11.0%
Florida - 10.4%
Texas - 10.0%
Missouri - 9.7%
Washington - 8.9%
Iowa - 7.7%
Alaska - 0.0%
Colorado - 0.0%
Delaware - 0.0%
Hawaii - 0.0%
Idaho - 0.0%
Indiana - 0.0%
Kentucky - 0.0%
Maine - 0.0%
Montana - 0.0%
Nevada - 0.0%
New Mexico - 0.0%
North Dakota - 0.0%
Oklahoma - 0.0%
Oregon - 0.0%
Rhode Island - 0.0%
South Dakota - 0.0%
Utah - 0.0%
West Virginia - 0.0%
Wyoming - 0.0%
D.C. - 0.0%
United States - 19.6%
2010 Nuclear generation % map:
( )
)
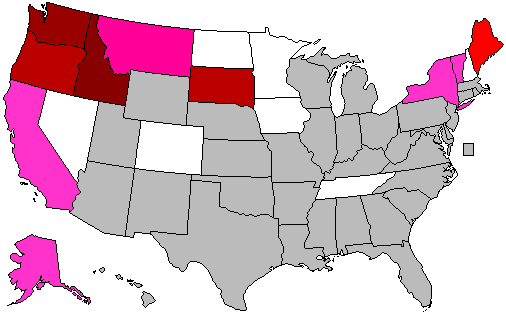
2010 Renewable generation % list (http://www.eia.gov/renewable/state/):
Idaho - 84.6%
Washington - 72.4%
South Dakota - 65.8%
Oregon - 64.0%
Maine - 46.8%
Montana - 35.1%
California - 28.0%
Vermont - 27.6%
New York - 22.1%
Alaska - 21.5%
Iowa - 17.9%
North Dakota - 17.7%
Minnesota - 13.9%
Nevada - 12.6%
New Hampshire - 12.2%
Tennessee - 11.1%
Colorado - 10.1%
Oklahoma - 9.6%
Wyoming - 8.9%
Arkansas - 8.7%
Hawaii - 7.5%
Alabama - 7.3%
Arizona - 7.3%
Kansas - 7.1%
Wisconsin - 7.1%
Texas - 7.0%
New Mexico - 5.7%
Massachusetts - 5.3%
North Carolina - 5.3%
Maryland - 5.1%
Virginia - 5.1%
Nebraska - 4.9%
Georgia - 4.7%
South Carolina - 4.1%
Michigan - 3.7%
Louisiana - 3.5%
Utah - 3.5%
Connecticut - 3.4%
Kentucky - 3.1%
Indiana - 3.0%
Pennsylvania - 2.9%
West Virginia - 2.9%
Mississippi - 2.8%
Missouri - 2.7%
Delaware - 2.5%
Illinois - 2.6%
Florida - 2.0%
Rhode Island - 1.9%
New Jersey - 1.3%
Ohio - 0.8%
D.C. - 0.0%
United States - 10.4%
2010 Renewable generation % map:
( )
)
2010 Coal generation % list (http://www.eia.gov/electricity/state/unitedstates/index.cfm):
West Virginia - 96.7%
Kentucky - 92.7%
Indiana - 89.7%
Wyoming - 89.3%
Ohio - 82.1%
North Dakota - 81.9%
Missouri - 81.3%
Utah - 80.6%
Iowa - 71.8%
New Mexico - 70.7%
Colorado - 68.1%
Kansas - 67.8%
Nebraska - 63.8%
Wisconsin - 62.5%
Montana - 62.4%
Alabama - 62.3%
Michigan - 58.8%
North Carolina - 55.9%
Maryland - 54.3%
Georgia - 53.3%
Tennessee - 53.0%
Minnesota - 52.3%
Pennsylvania - 48.0%
Illinois - 46.5%
Arkansas - 46.2%
Delaware - 45.6%
Oklahoma - 43.6%
Arizona - 39.1%
Texas - 36.5%
South Carolina - 36.2%
Virginia - 34.9%
South Dakota - 32.8%
Florida - 26.1%
Lousiana - 23.3%
Nevada - 19.9%
Massachusetts - 19.4%
Mississippi - 16.1%
Hawaii - 14.3%
New Hampshire - 13.9%
New York - 9.9%
New Jersey - 9.8%
Alaska - 9.2%
Washington - 8.2%
Connecticut - 7.8%
Oregon - 7.5%
California - 1.1%
Idaho - 0.7%
Maine - 0.5%
Rhode Island - 0.0%
Vermont - 0.0%
D.C. - 0.0%
United States - 44.8%
2010 Coal generation % map:
(
2010 Natural gas generation % list (http://www.eia.gov/electricity/state/unitedstates/index.cfm):
Rhode Island - 98.0%
Nevada - 67.4%
Massachusetts - 59.8%
Florida - 56.1%
Alaska - 55.5%
Mississippi - 54.4%
California - 52.7%
Delaware - 50.9%
Lousiana - 49.9%
Maine - 49.2%
Oklahoma - 47.0%
Texas - 45.4%
New Jersey - 37.9%
New York - 35.7%
Connecticut - 35.1%
Oregon - 28.4%
Arizona - 26.6%
Alabama - 25.8%
New Hampshire - 24.2%
New Mexico - 23.5%
Virginia - 23.3%
Colorado - 21.8%
Arkansas - 20.4%
Georgia - 17.4%
Utah - 15.3%
Pennsylvania - 14.7%
Idaho - 14.0%
Michigan - 11.0%
South Carolina - 10.5%
Washington - 10.0%
Wisconsin - 8.5%
Minnesota - 8.1%
Maryland - 6.6%
North Carolina - 6.6%
Indiana - 5.2%
Missouri - 5.1%
Ohio - 5.0%
Kansas - 4.8%
Illinois - 2.8%
Tennessee - 2.8%
Iowa - 2.3%
Kentucky - 1.9%
South Dakota - 1.3%
Nebraska - 1.0%
Wyoming - 1.0%
Montana - 0.2%
West Virginia - 0.2%
North Dakota - 0.1%
Vermont - 0.1%
Hawaii - 0.0%
D.C. - 0.0%
United States - 23.9%
2010 Natural gas generation % map:
(
2010 Nuclear generation % list (http://www.eia.gov/electricity/state/unitedstates/index.cfm):
Vermont - 72.2%
Connecticut - 50.2%
New Jersey - 49.9%
South Carolina - 49.9%
New Hampshire - 49.2%
Illinois - 47.8%
Virginia - 36.4%
Pennsylvania - 33.9%
Tennessee - 33.7%
Maryland - 32.1%
North Carolina - 31.7%
New York - 30.6%
Nebraska - 30.2%
Arizona - 27.9%
Michigan - 26.6%
Minnesota - 25.1%
Alabama - 24.9%
Arkansas - 24.6%
Georgia - 24.4%
Wisconsin - 20.7%
Kansas - 19.9%
Louisiana - 18.1%
Mississippi - 17.7%
California - 15.8%
Massachusetts - 13.8%
Ohio - 11.0%
Florida - 10.4%
Texas - 10.0%
Missouri - 9.7%
Washington - 8.9%
Iowa - 7.7%
Alaska - 0.0%
Colorado - 0.0%
Delaware - 0.0%
Hawaii - 0.0%
Idaho - 0.0%
Indiana - 0.0%
Kentucky - 0.0%
Maine - 0.0%
Montana - 0.0%
Nevada - 0.0%
New Mexico - 0.0%
North Dakota - 0.0%
Oklahoma - 0.0%
Oregon - 0.0%
Rhode Island - 0.0%
South Dakota - 0.0%
Utah - 0.0%
West Virginia - 0.0%
Wyoming - 0.0%
D.C. - 0.0%
United States - 19.6%
2010 Nuclear generation % map:
(
2010 Renewable generation % list (http://www.eia.gov/renewable/state/):
Idaho - 84.6%
Washington - 72.4%
South Dakota - 65.8%
Oregon - 64.0%
Maine - 46.8%
Montana - 35.1%
California - 28.0%
Vermont - 27.6%
New York - 22.1%
Alaska - 21.5%
Iowa - 17.9%
North Dakota - 17.7%
Minnesota - 13.9%
Nevada - 12.6%
New Hampshire - 12.2%
Tennessee - 11.1%
Colorado - 10.1%
Oklahoma - 9.6%
Wyoming - 8.9%
Arkansas - 8.7%
Hawaii - 7.5%
Alabama - 7.3%
Arizona - 7.3%
Kansas - 7.1%
Wisconsin - 7.1%
Texas - 7.0%
New Mexico - 5.7%
Massachusetts - 5.3%
North Carolina - 5.3%
Maryland - 5.1%
Virginia - 5.1%
Nebraska - 4.9%
Georgia - 4.7%
South Carolina - 4.1%
Michigan - 3.7%
Louisiana - 3.5%
Utah - 3.5%
Connecticut - 3.4%
Kentucky - 3.1%
Indiana - 3.0%
Pennsylvania - 2.9%
West Virginia - 2.9%
Mississippi - 2.8%
Missouri - 2.7%
Delaware - 2.5%
Illinois - 2.6%
Florida - 2.0%
Rhode Island - 1.9%
New Jersey - 1.3%
Ohio - 0.8%
D.C. - 0.0%
United States - 10.4%
2010 Renewable generation % map:
(
Title: Re: State electricity profiles
Post by: muon2 on April 07, 2012, 07:37:20 AM
Nice maps. One has to be a bit careful interpreting the numbers. For instance, IL shows up on the nuclear list in 6th place at 47.8%. However, IL is a large state with a lot of generating capacity, and leads the nation with about 12% of total US production. Also IL is divided between regions of the grid, and electricity in the north doesn't rely on production in the south. Electricity in Chicagoland is about 70% nuclear, comparable to VT.
Title: Re: State electricity profiles
Post by: greenforest32 on August 16, 2012, 10:18:03 PM
I don't think 2011 numbers are out yet but I was reading about wind power to get some background on the expiring PTC and how that matters in the Presidential campaign in specific states (Iowa, Colorado, etc) and I figured the wind power capacity/usage data and maps would fit in this thread.
()
()
()
http://www.windpoweringamerica.gov/pdfs/2011_annual_wind_market_report.pdf
()
2012 is going to be an active year too with about 8-12 GW of new wind power installed. Kansas alone is projected to double its capacity this year and near Iowa levels of usage in 2013.
()
()
()
http://www.windpoweringamerica.gov/pdfs/2011_annual_wind_market_report.pdf
()
2012 is going to be an active year too with about 8-12 GW of new wind power installed. Kansas alone is projected to double its capacity this year and near Iowa levels of usage in 2013.
Title: Re: State electricity profiles
Post by: muon2 on August 17, 2012, 11:43:11 PM
CA is an interesting item there. They were so far ahead in 1999, yet have merely doubled since then, while most states grew by far larger margins.
Title: Re: State electricity profiles
Post by: True Federalist (진정한 연방 주의자) on August 18, 2012, 12:04:16 AM
CA is an interesting item there. They were so far ahead in 1999, yet have merely doubled since then, while most states grew by far larger margins.
California has NIMBYism keeping it from building the transmission lines need to take more advantage of wind power.
Title: Re: State electricity profiles
Post by: greenforest32 on August 18, 2012, 07:08:39 PM
CA is an interesting item there. They were so far ahead in 1999, yet have merely doubled since then, while most states grew by far larger margins.
California has NIMBYism keeping it from building the transmission lines need to take more advantage of wind power.
Another thing is that a lot of the wind power development in the Pacific Northwest has been in contract with California utilities. For example: http://en.wikipedia.org/wiki/Shepherds_Flat_Wind_Farm
Quote
The Shepherds Flat Wind Farm is an 845 megawatt (MW) wind farm under construction in Oregon, United States. The project is located in Eastern Oregon in both Morrow and Gilliam counties, near Arlington. Approved in 2008 by state regulators, groundbreaking came in 2009. The wind farm is being built by Caithness Energy using General Electric (GE) 2.5 MW wind turbines, and it will supply electricity to Southern California Edison.
I think there's even a 2-3 GW wind project in Wyoming where the developer is hoping to export to California: http://www.powercompanyofwyoming.com/
A lot of these projects could go under in the future as the California Governor is trying to build more transmission lines for in-state wind and solar projects. I couldn't find maps like the ones above for solar, but just looking at the stats you can see that California is going to get a lot of solar in the next 10 years: http://www.seia.org/research-resources/major-solar-projects-list
Title: Re: State electricity profiles
Post by: Spamage on August 18, 2012, 09:55:03 PM
Cool maps. How would I be able to find information on Hydroelectric power generation nationwide without the other sources of renewable energy.
Title: Re: State electricity profiles
Post by: greenforest32 on August 18, 2012, 10:13:18 PM
Cool maps. How would I be able to find information on Hydroelectric power generation nationwide without the other sources of renewable energy.
The link above (http://www.eia.gov/renewable/state/) breaks down the renewables by type with total capacity/generation numbers and percentages for each state and for the national total:
* http://www.eia.gov/renewable/state/unitedstates/index.cfm
* http://www.eia.gov/renewable/state/oregon/index.cfm
Title: Re: State electricity profiles
Post by: Spamage on August 18, 2012, 10:16:04 PM
Cool maps. How would I be able to find information on Hydroelectric power generation nationwide without the other sources of renewable energy.
The link above (http://www.eia.gov/renewable/state/) breaks down the renewables by type with total capacity/generation numbers and percentages for each state and for the national total:
* http://www.eia.gov/renewable/state/unitedstates/index.cfm
* http://www.eia.gov/renewable/state/oregon/index.cfm
Thanks!
Title: Re: State electricity profiles
Post by: greenforest32 on August 25, 2012, 10:03:42 AM
The current trend among states is a reduction in coal and an increase in natural gas + renewables. I'm surprised how fast coal is declining though.
http://www.eia.gov/todayinenergy/detail.cfm?id=7290
()
http://www.eia.gov/todayinenergy/detail.cfm?id=6550
()
http://www.eia.gov/todayinenergy/detail.cfm?id=5750
()
Arizona definitely stands out with such low non-hydro renewable in 2011. Probably because it's a major nuclear user compared to the rest of the Southwest but I expect it will go up. They've got plenty of solar potential :P
http://www.eia.gov/todayinenergy/detail.cfm?id=7290
Quote
July 27, 2012
Plant owners and operators report to EIA that they expect to retire almost 27 gigawatts (GW) of capacity from 175 coal-fired generators between 2012 and 2016. In 2011, there were 1,387 coal-fired generators in the United States, totaling almost 318 GW. The 27 GW of retiring capacity amounts to 8.5% of total 2011 coal-fired capacity.
The coal-fired capacity expected to be retired over the next five years is more than four times greater than retirements performed during the preceding five-year period (6.5 GW). Moreover, based on EIA data, the approximate 9 GW of coal-fired capacity retirements expected to occur in 2012 will likely be the largest one-year amount in the nation's history. The record is, however, expected to be short-lived as almost 10 GW of coal-fired capacity are expected to retire in 2015.
()
http://www.eia.gov/todayinenergy/detail.cfm?id=6550
Quote
June 5, 2012
Amid historically low natural gas prices and the warmest March ever recorded in much of the United States, coal's share of total net generation dropped to 34%the lowest level since at least January 1973 (the earliest date for which EIA has monthly statistics). Despite seasonally low loads, natural gas-fired generation grew markedly and accounted for 30% of overall net generation by March 2012 (see chart above). Total electricity demand fell this winter as warmer weather reduced home heating requirements.
Coal generation decreased 29 billion kilowatthours from March 2011 to March 2012, while natural gas generation increased 27 billion kilowatthours during the same time period. In March 2012, coal's share of total generation was 34% compared to natural gas at 30%.
()
http://www.eia.gov/todayinenergy/detail.cfm?id=5750
Quote
April 9, 2012
Non-hydroelectric renewable generation has increased in many states over the past decade. In 2011, Maine had the highest percentage of non-hydroelectric renewable generation, at 27% of total in-state generation, up from 20% in 2001 (see maps). South Dakota and Iowa followed, with 21% and 17%, respectively, in 2011, up from 1% and less than one percent in 2001. Wind is the largest driver of this increase across all states.
Non-hydroelectric renewable generation has increased in many states over the past decade. In 2011, Maine had the highest percentage of non-hydroelectric renewable generation, at 27% of total in-state generation, up from 20% in 2001 (see maps). South Dakota and Iowa followed, with 21% and 17%, respectively, in 2011, up from 1% and less than one percent in 2001. Wind is the largest driver of this increase across all states.
()
Arizona definitely stands out with such low non-hydro renewable in 2011. Probably because it's a major nuclear user compared to the rest of the Southwest but I expect it will go up. They've got plenty of solar potential :P
Title: Re: State electricity profiles
Post by: Padfoot on August 25, 2012, 11:47:40 AM
The current trend among states is a reduction in coal and an increase in natural gas + renewables. I'm surprised how fast coal is declining though.
Much of the decline in coal can also be attributed to new EPA rules on emissions. It's been written up quite a bit in the local news hear in Ohio. That's no surprise though given the concentration of both coal plants and coal mining in our state.
Title: Re: State electricity profiles
Post by: greenforest32 on September 01, 2012, 12:47:50 PM
Another thing that is driving renewable energy development in states besides the cost reductions and technical potential is renewable portfolio standards (RPS). They're basically state mandates that utilities purchase a certain percentage of their electricity from renewables by a certain date. There was a proposed federal RPS but that died in the Cap & Trade bill and then there was talk of a Clean Energy Standard (basically an RPS that included nuclear, natural gas and 'clean coal') but even that seems dead now.
Most of these mandates don't count large scale hydro as renewable because of environmental impacts and because most of them are already built. Republicans here were arguing that Oregon's hydropower should count towards the goal with Democrats saying the RPS should encourage new projects and that if the (new) 25% by 2025 mandate was implemented, the state would get over 3/4 of its power from renewables by that time.
http://www.dsireusa.org/documents/summarymaps/RPS_map.pdf
()
California, Colorado, and Hawaii have some of the largest mandates. I think Hawaii's will be the most successful considering most renewable projects there can be well below grid parity due to the state's high electricity prices: http://www.eia.gov/state/state-energy-rankings.cfm?keyid=18&orderid=1
()
Connecticut stood out to me as well. They have a relatively aggressive RPS but from the stats above, you can see the state has no wind power installed and a small amount of solar. Sure enough, there was an article confirming the issue: http://www.ctpost.com/local/article/State-lags-in-renewable-energy-goals-3450364.php
Delaware and Rhode Island seem to be in a similar situation but maybe they can resort to offshore wind?
Most of these mandates don't count large scale hydro as renewable because of environmental impacts and because most of them are already built. Republicans here were arguing that Oregon's hydropower should count towards the goal with Democrats saying the RPS should encourage new projects and that if the (new) 25% by 2025 mandate was implemented, the state would get over 3/4 of its power from renewables by that time.
http://www.dsireusa.org/documents/summarymaps/RPS_map.pdf
()
California, Colorado, and Hawaii have some of the largest mandates. I think Hawaii's will be the most successful considering most renewable projects there can be well below grid parity due to the state's high electricity prices: http://www.eia.gov/state/state-energy-rankings.cfm?keyid=18&orderid=1
()
Connecticut stood out to me as well. They have a relatively aggressive RPS but from the stats above, you can see the state has no wind power installed and a small amount of solar. Sure enough, there was an article confirming the issue: http://www.ctpost.com/local/article/State-lags-in-renewable-energy-goals-3450364.php
Quote
March 31, 2012
If Connecticut does not develop more renewable resources, ratepayers could be passed on noncompliance fees of more than $250 million annually by 2022, according to a draft version of the state's future energy plan.
Of all the New England states, Connecticut has the highest target for renewable generation: 20 percent by 2020, but it has few in-state resources to get that power, save for some projects that depend on state-sponsored contracts.
Quote
The report, released by the Department of Energy and Environmental Protection (DEEP), recommends expanding what counts as renewable energy, specifically new energy efficiency initiatives. It also recommends allowing resources such as large hydropower dams in Canada to qualify as clean energy.
A lot of energy could come from wind farms in Maine, especially from wind power in northern New England, the plan said, but how to transmit that wind power remains uncertain. Also, renewable energy projects have had difficulty securing funding over the last three years, and federal tax credits set to expire in 2012 may not be renewed.
A lot of energy could come from wind farms in Maine, especially from wind power in northern New England, the plan said, but how to transmit that wind power remains uncertain. Also, renewable energy projects have had difficulty securing funding over the last three years, and federal tax credits set to expire in 2012 may not be renewed.
Delaware and Rhode Island seem to be in a similar situation but maybe they can resort to offshore wind?
Title: Re: State electricity profiles
Post by: True Federalist (진정한 연방 주의자) on September 01, 2012, 07:51:03 PM
No surprises really except for Hawaii and D.C. mainly using petroleum for electricity. Thought they'd be gassing it up.
LNG carriers are a relatively recent phenomenon. with the first small carrier setting sale only in 1959. Hawaii never built the infrastructure for the domestic use of natural gas and thus never needed to build what would be needed to import gas for electricity generation. Thus Hawaii has a chicken and egg problem when it comes to natural gas. HEI (the primary electric utility) would need to not only build new generating plants, but also an LNG terminal. Indeed, three LNG terminals if they were to build gas generators on Hawai'i and Maui as well as Oahu. (Kaui'i is served by a co-op.)
Title: Re: State electricity profiles
Post by: greenforest32 on September 01, 2012, 08:28:16 PM
You'd think the existing high prices would be incentive enough to move to cheaper technologies but maybe the transportation costs of importing the fuel is really that expensive? Sometimes I forget how far away Hawaii actually is (2,500+ miles from the West Coast). I wonder if switching to natural gas would be cheaper considering that.
Imagine Hawaii's Senators petitioning for a highway to connect them to the continental US. That would be the supreme transportation earmark.
Imagine Hawaii's Senators petitioning for a highway to connect them to the continental US. That would be the supreme transportation earmark.
Title: Re: State electricity profiles
Post by: True Federalist (진정한 연방 주의자) on September 04, 2012, 01:23:26 PM
Keep in mind that Hawaii has not one but four separate electricity grids: Oahu, Hawai'i, Maui, and Kaui'i. A typically sized gas generator plant (~100MW) would be overkill for any of them except Oahu. The nearest LNG source is Alaska, not the West Coast. (Alaska's LNG heads mainly to Japan.) The West Coast has no facilities to export or import LNG, tho there are some proposals for terminals to be built in Oregon. (Originally import terminals, but with the success of shale gas, they've been reworked as export terminals, but so far they haven't been approved.)
Title: Re: State electricity profiles
Post by: greenforest32 on September 04, 2012, 02:05:59 PM
Yeah most of the import terminal deals here fell through and now there are both natural gas and coal export terminals in the works. There hasn't been as much opposition to those compared to the coal ones so I expect they're more likely to be approved.
Even the coal ones, I think one or two might get built and the controversy is that the last coal power plant in the state is being shut down in 2020 and utilities here are barred from entering into new contracts purchasing power with a specific amount of emissions per MWh of electricity generated due to the emission performance standard (http://www.epa.gov/chp/state-policy/obr_factsheet.html) adopted (it effectively banned new coal purchases though the existing contracts were grandfathered in I think) so the state would theoretically be coal-free only to start exporting the stuff.
The coal industry has been saying it should be treated as a market commodity and be allowed through and I don't see how the terminals are going to be stopped as at least with the natural gas exports, you could point to rising domestic prices as a reason to block them.
Somewhat relevant/interesting fact: with Bingaman's (D-NM) retirement, Wyden (D-OR) is in line to be the new Chairman of the Senate Energy and Natural Resources Committee if Democrats hold the Senate and Murkowski (R-AK) if Republicans win it. They've been doing energy tours in each other's states: http://www.alaskajournal.com/Alaska-Journal-of-Commerce/September-Issue-2-2012/Sens-Murkowski-Wyden-tout-bipartisanship-on-energy/
Title: Re: State electricity profiles
Post by: greenforest32 on October 09, 2012, 01:17:32 AM
The current trend among states is a reduction in coal and an increase in natural gas + renewables. I'm surprised how fast coal is declining though.
http://grist.org/climate-energy/yes-coal-is-dying-but-no-epa-is-not-the-main-culprit/
Quote
8 Oct 2012
...
The report is an update of its brief from late 2010 on potential coal-plant retirements. The headline news: Brattle is substantially upping its projection of how many coal plants will retire, by about 25 GW. Thats huge.
...
The report is an update of its brief from late 2010 on potential coal-plant retirements. The headline news: Brattle is substantially upping its projection of how many coal plants will retire, by about 25 GW. Thats huge.
Quote
...
according to Brattle: As of July 2012, approximately 30 GW of coal plant capacity (roughly 10% of total coal capacity) had announced plans to retire by 2016. Thats already a lot. To determine how much more is in the offing, Brattle had to estimate two crucial variables: first, what natural gas prices will do, and second, how strict EPA regulations will end up being. So they ran scenarios for both high and low gas prices, and for both strict and lenient regulatory environments.
The result: We find that 59 GW to 77 GW of coal plant capacity are likely to retire instead of retrofit with environmental equipment (my emphasis). Thats 20 to 25 percent of U.S. coal generation capacity, in a matter of less than a decade.
Somehow I see this turning into bad news for West Virginia Democrats because of the state's coal production: http://www.eia.gov/state/state-energy-rankings.cfm?keyid=30&orderid=1
Title: Re: State electricity profiles
Post by: greenforest32 on October 12, 2012, 08:19:39 PM
Looking back, I probably should have added this largest single source for electricity in 2010 state map to those above:
(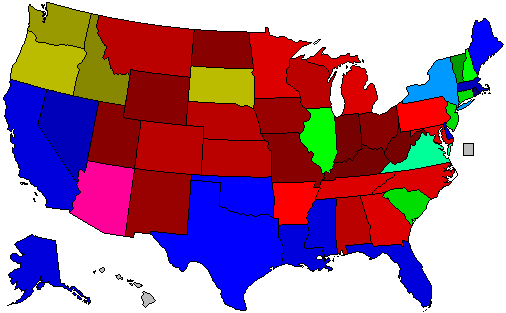 )
)
Color 1 (Red) = Coal
Color 2 (Blue) = Natural gas
Color 3 (Green) = Nuclear
Color 4 (Yellow) = Renewables
Hawaii and DC left blank for petroleum
-----
Also relevant to the coal element of this thread I think: http://www.washingtonpost.com/politics/obamas-energy-policy-forces-coal-state-democrats-to-embrace-divergent-election-year-strategy/2012/10/12/3afd82f8-148b-11e2-9a39-1f5a7f6fe945_story.html
(
Color 1 (Red) = Coal
Color 2 (Blue) = Natural gas
Color 3 (Green) = Nuclear
Color 4 (Yellow) = Renewables
Hawaii and DC left blank for petroleum
-----
Also relevant to the coal element of this thread I think: http://www.washingtonpost.com/politics/obamas-energy-policy-forces-coal-state-democrats-to-embrace-divergent-election-year-strategy/2012/10/12/3afd82f8-148b-11e2-9a39-1f5a7f6fe945_story.html
Quote
In West Virginia, where the president is wildly unpopular, Sen. Joe Manchin boasts about his unyielding opposition to the EPA and his confrontations with the administration. In his latest campaign ad, Manchin rifle in hand alludes to a previous commercial in which he shoots Obamas bill to cap greenhouse gases from coal-burning power plants. The senator says the state has enough coal and natural gas to provide energy and jobs for decades, and Ill take on anyone who tries to stop us.
Title: Re: State electricity profiles
Post by: minionofmidas on October 13, 2012, 10:22:13 AM
What's with Dixie - is that just political or is it related to hurricanes?
And what the hell is wrong with Nevada? There'd be so much room there.
And what the hell is wrong with Nevada? There'd be so much room there.
Title: Re: State electricity profiles
Post by: Linus Van Pelt on October 13, 2012, 10:49:15 AM
What's with Dixie - is that just political or is it related to hurricanes?
It's more the rest of the year that's the problem - the south just isn't that windy.
()
Title: Re: State electricity profiles
Post by: greenforest32 on October 13, 2012, 04:11:23 PM
Yeah solar and geothermal has been a bigger deal in Nevada so far though the state did get its first wind farm this year.
http://www.windpowermonthly.com/news/1144736/Pattern-completes-Nevadas-first-wind-project/
http://www.windpowermonthly.com/news/1144736/Pattern-completes-Nevadas-first-wind-project/
Quote
08 August 2012
UNITED STATES: Pattern Energy has completed Nevada's first project, the 151MW Spring Valley wind farm.
UNITED STATES: Pattern Energy has completed Nevada's first project, the 151MW Spring Valley wind farm.