Title: Somewhat Odd Map
Post by: Mehmentum on November 22, 2012, 03:37:48 PM
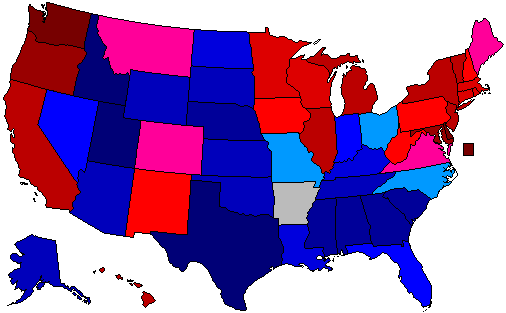
Using the results of the last 4 presidential elections, last 4 Senatorial elections, and last 4 Gubernatorial elections in each state. Color shading is based off of % of elections won.
( )
)
Democrats won every statewide elections in Washington, Delaware, and (of course) D.C. Republicans did this in Utah, Idaho, and Texas.
Funny how we Democrats talk a lot about Texas, but have had literally zero sucess there in the past decade. Its also interesting to see a lot of states we think of as solidly blue/red, not being that way if we include Senate and Governor elections.
(
Democrats won every statewide elections in Washington, Delaware, and (of course) D.C. Republicans did this in Utah, Idaho, and Texas.
Funny how we Democrats talk a lot about Texas, but have had literally zero sucess there in the past decade. Its also interesting to see a lot of states we think of as solidly blue/red, not being that way if we include Senate and Governor elections.
Title: Re: Somewhat Odd Map
Post by: politicus on November 22, 2012, 05:02:20 PM
The pattern is actually a lot more neat, than I would have imagined.
WV and Montana being the chief exceptions.
WV and Montana being the chief exceptions.
Title: Re: Somewhat Odd Map
Post by: Oldiesfreak1854 on November 22, 2012, 06:54:46 PM
Using the results of the last 4 presidential elections, last 4 Senatorial elections, and last 4 Gubernatorial elections in each state. Color shading is based off of % of elections won.
()
Democrats won every statewide elections in Washington, Delaware, and (of course) D.C. Republicans did this in Utah, Idaho, and Texas.
Funny how we Democrats talk a lot about Texas, but have had literally zero sucess there in the past decade. Its also interesting to see a lot of states we think of as solidly blue/red, not being that way if we include Senate and Governor elections.
(
Democrats won every statewide elections in Washington, Delaware, and (of course) D.C. Republicans did this in Utah, Idaho, and Texas.
Funny how we Democrats talk a lot about Texas, but have had literally zero sucess there in the past decade. Its also interesting to see a lot of states we think of as solidly blue/red, not being that way if we include Senate and Governor elections.
Title: Re: Somewhat Odd Map
Post by: Badger on November 24, 2012, 02:06:14 PM
Using the results of the last 4 presidential elections, last 4 Senatorial elections, and last 4 Gubernatorial elections in each state. Color shading is based off of % of elections won.
()
Democrats won every statewide elections in Washington, Delaware, and (of course) D.C. Republicans did this in Utah, Idaho, and Texas.
Funny how we Democrats talk a lot about Texas, but have had literally zero sucess there in the past decade. Its also interesting to see a lot of states we think of as solidly blue/red, not being that way if we include Senate and Governor elections.
(
Democrats won every statewide elections in Washington, Delaware, and (of course) D.C. Republicans did this in Utah, Idaho, and Texas.
Funny how we Democrats talk a lot about Texas, but have had literally zero sucess there in the past decade. Its also interesting to see a lot of states we think of as solidly blue/red, not being that way if we include Senate and Governor elections.
When it comes to grubantorial races, absolutely. That's why I wouldn't advise including just races to measure a state's partisanship, fwiw.
Title: Re: Somewhat Odd Map
Post by: hopper on November 27, 2012, 05:38:20 PM
I like Arkansas in the white color. Its totally in the political center! That may change a little over the next 4 years though!
Title: Re: Somewhat Odd Map
Post by: Oldiesfreak1854 on November 27, 2012, 07:21:45 PM
Using the results of the last 4 presidential elections, last 4 Senatorial elections, and last 4 Gubernatorial elections in each state. Color shading is based off of % of elections won.
()
Democrats won every statewide elections in Washington, Delaware, and (of course) D.C. Republicans did this in Utah, Idaho, and Texas.
Funny how we Democrats talk a lot about Texas, but have had literally zero sucess there in the past decade. Its also interesting to see a lot of states we think of as solidly blue/red, not being that way if we include Senate and Governor elections.
(
Democrats won every statewide elections in Washington, Delaware, and (of course) D.C. Republicans did this in Utah, Idaho, and Texas.
Funny how we Democrats talk a lot about Texas, but have had literally zero sucess there in the past decade. Its also interesting to see a lot of states we think of as solidly blue/red, not being that way if we include Senate and Governor elections.
When it comes to grubantorial races, absolutely. That's why I wouldn't advise including just races to measure a state's partisanship, fwiw.
Title: Re: Somewhat Odd Map
Post by: 🐒Gods of Prosperity🔱🐲💸 on December 01, 2012, 01:46:48 PM
what do the 30% shades represent?
Title: Re: Somewhat Odd Map
Post by: Mehmentum on December 01, 2012, 11:39:33 PM
what do the 30% shades represent?