Title: Tipping-Point States: 1856-2012
Post by: JRP1994 on July 13, 2013, 06:00:03 PM
This took me 5 hours to complete, but here it is - data for every election in which the Republican Party and Democratic Party has competed.
Year Tipping Point State Electoral Votes State Margin National Margin
2012 Colorado 9 D+5.37% D+3.76%
2008 Colorado 9 D+8.95% D+7.27%
2004 Ohio 18 R+2.11% R+2.46%
2000 Florida 25 R+0.01% D+0.52%
1996 Pennsylvania 23 D+9.20% D+8.52%
1992 Tennessee 11 D+4.65% D+5.56%
1988: Michigan 20 R+7.90% R+7.73%
1984: Michigan 20 R+18.99% R+18.22%
1980: Illinois 26 R+7.93% R+9.74%
1976: Wisconsin 11 D+1.68% D+2.06%
1972: Maine 4 R+22.98% R+23.15%
1968: Ohio 26 R+2.28% R+0.70%
1964: Washington 9 D+24.59% D+22.58%
1960: Missouri 13 D+0.52% D+0.16%
1956: Florida 10 R+14.54% R+15.40%
1952: Michigan 20 R+11.47% R+10.85%
1948: California 25 D+0.44% D+4.48%
1944: New York 47 D+5.01% D+7.49%
1940: Pennsylvania 36 D+6.89% D+9.95%
1936: Ohio 26 D+20.56% D+24.25%
1932: Iowa 11 D+17.71% D+17.76%
1928: Illinois 29 R+14.65% R+17.42%
1924: Rhode Island 5 R+23.17% R+25.22%
1920: Rhode Island 5 R+31.19% R+26.17%
1916: California 13 D+0.38% D+3.12%
1912: New York 45 D+12.60% D+14.44%
1908: West Virginia 7 R+10.25% R+8.53%
1904: New Jersey 12 R+18.63% R+18.83%
1900: Illinois 24 R+8.39% R+6.13%
1896: Ohio 23 R+4.78% R+4.31%
1892: Wisconsin 13 D+1.68% D+3.01%
1888: New York 36 R+1.09% D+0.83%
1884: New York 36 D+0.10% D+0.57%
1880: New York 35 R+1.91% R+0.10%
1876: South Carolina 7 R+0.49% D+3.00%
1872: New Hampshire 5 R+8.33% R+11.80%
1868: Arkansas 5 R+7.37% R+5.33%
1864: Illinois 16 R+8.84% R+10.08%
1860: New York 35 R+7.43% R+10.13%
1856: Kentucky 12 D+5.09% D+12.20%
Title: Re: Tipping-Point States: 1856-2012
Post by: eric82oslo on July 13, 2013, 07:37:05 PM
Wonderful list, fantastic work! :)
Based on this we can calculate how many times each state has been the tipping point state going all the way back to 1856.
And here's that list:
New York - 6 times (most recently in 1944)
Ohio - 4
Illinois - 4
Michigan - 3
Colorado - 2
Florida - 2
Pennsylvania - 2
Rhode Island - 2
California - 2
Wisconsin - 2
Tennessee - 1
Maine - 1
Washington - 1
Missouri - 1
Iowa - 1
West Virginia - 1
New Jersey - 1
South Carolina - 1
New Hampshire - 1
Arkansas - 1
Kentucky - 1
So a total of 21 states have been the tipping point state at least once since 1856. That is 42% of the states, not bad. And 10 of the states have reached tipping point more than once.
And the winner is...New York, by far. Having been the electoral decider no less than 6 times, including in all three elections during the 1880s, causing a Republican president to be elected twice despite the popular vote wanting the Democratic candidate for the office. Also worth mentioning are the states of Ohio, Illinois and Michigan. What they all have in common is the size of their populations.
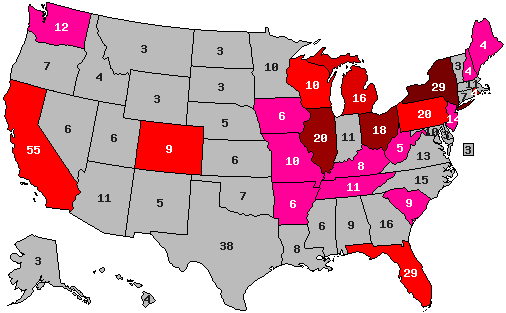
In the top 10 list we find plenty of states which are still considered swing and battleground states: Ohio, Michigan, Colorado, Florida, Pennsylvania, Wisconsin, Iowa and New Hampshire. Even South Carolina could possibly become a battleground state in 10-15 more years. It's interesting to see all of the Appalachian states having been the tipping point at least once. Nowadays they're as far from the political center as you could get, more or less.
That gives us this tipping point map:
( )
)
Of the truely big states, Texas, Georgia, North Carolina, Virginia, Arizona, Massachusetts, Indiana, Minnesota and Maryland have all yet to becoming a tipping point state. Maybe in 2016? Both Virginia and Minnesota sure look ripe for t.p. status soon. :P North Carolina, Arizona and Georgia being good candidates for 2020. And Texas could perhaps tip the election in 2024 or 2028? By then, Texas' electoral weight will have increased even further, letting the redistricting from the 2020 census work its magic on the map.
Based on this we can calculate how many times each state has been the tipping point state going all the way back to 1856.
And here's that list:
New York - 6 times (most recently in 1944)
Ohio - 4
Illinois - 4
Michigan - 3
Colorado - 2
Florida - 2
Pennsylvania - 2
Rhode Island - 2
California - 2
Wisconsin - 2
Tennessee - 1
Maine - 1
Washington - 1
Missouri - 1
Iowa - 1
West Virginia - 1
New Jersey - 1
South Carolina - 1
New Hampshire - 1
Arkansas - 1
Kentucky - 1
So a total of 21 states have been the tipping point state at least once since 1856. That is 42% of the states, not bad. And 10 of the states have reached tipping point more than once.
And the winner is...New York, by far. Having been the electoral decider no less than 6 times, including in all three elections during the 1880s, causing a Republican president to be elected twice despite the popular vote wanting the Democratic candidate for the office. Also worth mentioning are the states of Ohio, Illinois and Michigan. What they all have in common is the size of their populations.
In the top 10 list we find plenty of states which are still considered swing and battleground states: Ohio, Michigan, Colorado, Florida, Pennsylvania, Wisconsin, Iowa and New Hampshire. Even South Carolina could possibly become a battleground state in 10-15 more years. It's interesting to see all of the Appalachian states having been the tipping point at least once. Nowadays they're as far from the political center as you could get, more or less.
That gives us this tipping point map:
(
Of the truely big states, Texas, Georgia, North Carolina, Virginia, Arizona, Massachusetts, Indiana, Minnesota and Maryland have all yet to becoming a tipping point state. Maybe in 2016? Both Virginia and Minnesota sure look ripe for t.p. status soon. :P North Carolina, Arizona and Georgia being good candidates for 2020. And Texas could perhaps tip the election in 2024 or 2028? By then, Texas' electoral weight will have increased even further, letting the redistricting from the 2020 census work its magic on the map.
Title: Re: Tipping-Point States: 1856-2012
Post by: stevekamp on July 19, 2013, 01:58:07 AM
Great job -- thanks.
In 1896, Ohio was McKinley's home state.
In 1884, 1888, 1892, New York had the biggest EC vote, and was Grover Cleveland's home state, but Grover never got a majority -- heavy R upstate vote cancelling NYC
In 1896, Ohio was McKinley's home state.
In 1884, 1888, 1892, New York had the biggest EC vote, and was Grover Cleveland's home state, but Grover never got a majority -- heavy R upstate vote cancelling NYC
Title: Re: Tipping-Point States: 1856-2012
Post by: barfbag on July 19, 2013, 02:03:13 AM
Are we jumping too early when it comes to trends and future maps?
Title: Re: Tipping-Point States: 1856-2012
Post by: DS0816 on July 20, 2013, 09:10:37 AM
If this forum allowed for us to "LIKE" a posting, I would give one to the OP, JRP1994.
Thank you!
Thank you!