Title: How Liberal/Conservative Was Your State?
Post by: Sorenroy on March 21, 2016, 09:56:36 AM
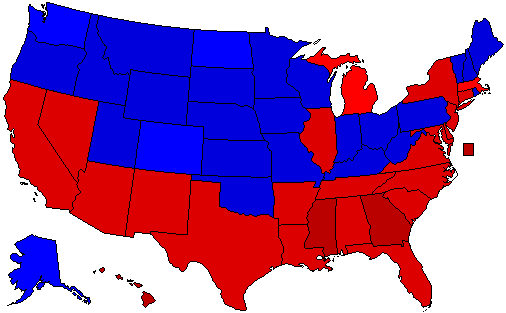
According to the NYT 2012 exit polls, Democrats won African-Americans 93-6, Hispanic-Americans 71-27, and Asian-Americans 73-26. These large leads are what allowed the Democrats to hold the white-house, as Obama lost White-Americans by a 20 point margin (59-39). Based on these statistics, the final map from the 2012 election should have looked like this:
( )
)
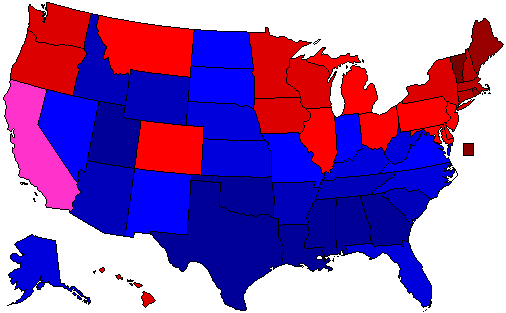
So why doesn't it? The answer has multiple parts, one being turnout among different groups (with those percentages, Obama should have won by a margin 6.2 points higher then it was, at 53.6-44.6), another being that any poll you do will have a margin of error associated with, and another being that the votes were not uniform across the country. For example: in some areas whites voted left of their average, in some areas right. With these averages, we can look at how liberal or conservative each state was in 2012.
( )
)
Key is this:
20% = -5-0%
40% = 0-5%
50% = 5-10%
60% = 10-15%
70% = 15-20%
80% = 20-25%
90% = 25-30%
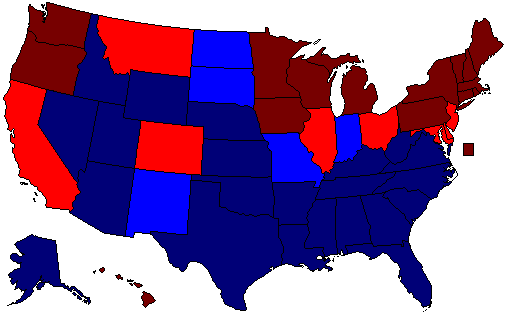
So here you go. This last map is easier to look at, with the 90% states being places where the liberal/conservative number was above the 4% MOE, and the 40% states being places where the liberal/conservative number was below 4%, or within the MOE.
( )
)
As such we can see that all things being equal, big states like California and Illinois really are not that liberal, but rather that their votes reflect the makeup of their electorate, and Florida and its fellow tossup states are only made tossup because their beliefs (or other reasons not looked at in these maps), and without that lean would fall safely into their opposite camp.
Note: this is part of a far bigger project that focuses on projecting how states will vote in the future, but I found these numbers interesting enough to post on their own.
(
So why doesn't it? The answer has multiple parts, one being turnout among different groups (with those percentages, Obama should have won by a margin 6.2 points higher then it was, at 53.6-44.6), another being that any poll you do will have a margin of error associated with, and another being that the votes were not uniform across the country. For example: in some areas whites voted left of their average, in some areas right. With these averages, we can look at how liberal or conservative each state was in 2012.
(
Key is this:
20% = -5-0%
40% = 0-5%
50% = 5-10%
60% = 10-15%
70% = 15-20%
80% = 20-25%
90% = 25-30%
So here you go. This last map is easier to look at, with the 90% states being places where the liberal/conservative number was above the 4% MOE, and the 40% states being places where the liberal/conservative number was below 4%, or within the MOE.
(
As such we can see that all things being equal, big states like California and Illinois really are not that liberal, but rather that their votes reflect the makeup of their electorate, and Florida and its fellow tossup states are only made tossup because their beliefs (or other reasons not looked at in these maps), and without that lean would fall safely into their opposite camp.
Note: this is part of a far bigger project that focuses on projecting how states will vote in the future, but I found these numbers interesting enough to post on their own.
Title: Re: How Liberal/Conservative Was Your State?
Post by: Goldwater on March 21, 2016, 12:33:35 PM
Interesting. It didn't occur to me that Montana voted to the left of it's demographics.
Title: Re: How Liberal/Conservative Was Your State?
Post by: RINO Tom on July 10, 2016, 09:17:31 PM
Yeah, this kind of plays into how most of the White kids I met from the state of IL while I was at the University of Iowa were much more conservative than Whites from the state of IA.
Title: Re: How Liberal/Conservative Was Your State?
Post by: ‼realJohnEwards‼ on September 05, 2016, 09:59:21 PM
So California is now a Moderate Hero?
Whee.
Whee.
Title: Re: How Liberal/Conservative Was Your State?
Post by: catographer on May 07, 2017, 07:31:27 PM
Isn't this just a "how liberal/conservative were the white people in your state"?
Title: Re: How Liberal/Conservative Was Your State?
Post by: JA on May 07, 2017, 08:10:48 PM
Isn't this just a "how liberal/conservative were the white people in your state"?
Pretty much
Title: Re: How Liberal/Conservative Was Your State?
Post by: Calthrina950 on August 22, 2020, 12:34:23 PM
I'm bumping this up, but this is a very interesting set of maps. It's not surprising to me at all that the Deep Southern States (and most of the Southern States in general) would be voting Democratic if whites voted like they do in the Northeast or Midwest. And that Vermont, Maine, and New Hampshire, which like the heavily Republican states of Idaho, Wyoming, and West Virginia, are very white, would be reliably Republican in such a scenario. It goes to show you the impact which economic and cultural factors can have on voting habits-Vermont is one of the most progressive states in the country, and that differentiates it from deeply conservative Wyoming or West Virginia.