Title: NOVA GREEN's Election Analysis Thread
Post by: NOVA Green on April 01, 2018, 06:22:07 PM
This thread is devoted to NOVA Green's detailed election analysis posts.
Will be re-posting content shortly, but this is a placeholder for the directory of posted content.
1.) Alabama- Precinct/Municipal Data
A.) 2017 US SEN- Jefferson County
B.) 2017 US SEN- Baldwin County
C.) 2017 US SEN- Calhoun County
D.) 2017 US SEN- Mobile County
E.) 2017 US SEN- Lee County
F.) 2017 US SEN- Morgan County
2.) Arizona CD-08
A.) How will it Play in Peoria?
B.) CD-08 Vote by Place
C.) CD-08 Vote Share /EV/ Votes by State District
D.) AZ CD-08 LD 1 & 14
E.) AZ CD- 08 LD 13
F.) AZ CD-08 EV Precincts High Low 04_05_18 Data
G.) AZ CD-08 LD 15
H.) AZ CD-08 Turnout Review Post Election
I.) AZ CD-08 Senior Vote Review
J.) AZ CD-08 Non-Senior Vote Review
K.) AZ CD-08 DEM Swing Precinct Review
L.) AZ CD-08 REP Swing Precinct Review
3. Oregon Megathread--- Detailed precinct and County level data for Oregon.... Link to my original thread. There is a directory on the first post of the thread, that should be able to link to some of my various County level posts, and throwing it into the mix until I get a chance to figure out how to cross-link data better into this thread.
A.) OR- 2018 Primary
https://uselectionatlas.org/FORUM/index.php?topic=252085.msg5386692#msg5386692
4.) Pennsylvania- CD-18 Precinct/Municipal Election Data
A.) Pre Special Election South Allegheny
B.) Post- Election South Allegheny Vote by Place
C.) Post Election South Allegheny Vote by Place and Demographics
D.) Post Election South Allegheny Trump > Lamb Voters
5.) College Football Communities Voting
A.) Flagship University Towns/ Cities # 1
B.) Flagship University Towns/ Cities # 2
C.) PAC 12 North /South, Big 12, Big 10 East West Campus/Off-Campus
6.) Culturally Liberal vs Socially Liberal--- Oregon Ballot Measures as Examples by County
7.) Arizona--- Maricopa County
A.) Votes by Place in recent Electoral History
8.) OH-CD 12
A.) Votes by County
B.) Franklin County- Votes by Place
C.) Franklin County- Early Voting
D.) Franklin County- Voting and Demographics by Place
E.) Delaware County- Overview by Place
F.) Delaware City
G.) Powell City (Delaware County)
H.) Orange and Genoa Townships (Delaware County)
I.) Liberty and Concord Townships (Delaware County)
J.) Delaware County Overview- "Urban", "Suburban", "Exurban" and "Rural"
K.) Licking County Overview plus Newark City (Licking County)
L.) Licking County Vote Share by Place
M.) Reynoldsburg & Granville Village (Licking County)
N.) Granville Township, Heath, Pataskala, Etna Township, Harrison Township, (Licking County)
O.) Rural Parts of Licking County
P.) Early Votes Worthington, Westerville, Dublin (Franklin County)
Q.) Early Votes Gahanna and New Albany (Franklin County)
R.) Early Votes Newark (Licking County)
S.) Provisional Vote Share by Place 2016 > 2018
T.) EV numbers & Detailed Demographics: Westerville (Franklin County)
U.) EV Numbers & Detailed Demographics: Worthington (Franklin County)
8.) Coos County, New Hampshire
A.) Socio-Demographic Profile
B.) Why did Coos County Swing hard Trump?
9.) TX- CD 23
A.) Overview
B.) Bexar County CD-23 Overview
C.) Bexar County- Midterm Elections vs Pres Election Years--- CD-23 '14 as Baseline
Title: Re: NOVA GREEN's Election Analysis Thread
Post by: NOVA Green on April 01, 2018, 06:22:28 PM
Oregon Megathread....
Anyone curious about Oregon Politics and want to look at relatively detailed precinct/ municipal level data for various elections in the State?
This is the place for that, even though I am sitting on a wealth of precinct level data for Oregon Presidential Elections from '88 > '16, with the exception of '96, and some various counties in '04, I haven't yet gone back and updated the numbers to include some of my recent archival findings from my personal library.
For now, this is a good place to start since I think almost all of the Counties in Oregon have been covered, even in my initial first go around, that help provide a deeper political, historical, and demographic context to my Native State.
https://uselectionatlas.org/FORUM/index.php?topic=252085.msg5386692#msg5386692
Title: Re: NOVA GREEN's Election Analysis Thread
Post by: NOVA Green on April 01, 2018, 06:22:49 PM
Placeholder # 2
Title: Re: NOVA GREEN's Election Analysis Thread
Post by: NOVA Green on April 01, 2018, 06:23:48 PM
Placeholder # 3
Title: Re: NOVA GREEN's Election Analysis Thread
Post by: NOVA Green on April 01, 2018, 06:27:31 PM
Placeholder #4
Title: Re: NOVA GREEN's Election Analysis Thread
Post by: NOVA Green on April 01, 2018, 07:12:44 PM
Now that we are finally starting to get initial precinct level results from some of the Counties in Alabama, it's time to take a look at some of the Counties that have posted Provisional election results by precinct, recognizing that there might be some changes once Provisional Ballots, Overseas Voters, and Military Voters are counted....
Jefferson County accounted for only 16% of the votes in the '17 US-SEN election, but was obviously a County that Jones needed to win by huge margins to make the race a toss-up election, which he did.
It's also a City/Metro area in the Deep South that can legitimately claim to be the first "Steel City" in the United States (Although folks from the Pittsburgh area and Steeler fans might disagree).
A region where the combination of Coal Mines, Railroads, and Steel Mills created an Industrial Worker movement, where Poor White and Blacks alike from throughout the State and region migrated to during the Great Depression and the expansion of the Factories in the region to push out the raw materials needed to win the War against Nazism and Fascism in both Europe and Asia.
Interestingly enough, Unions didn't discriminate against African-Americans in the Mines and Factories of Birmingham, compared to the practices of the Labor Movement in places like the Industrial Midwest and California during that era.
I digress, so let's take a look at Jefferson County and the vote share by municipality in the '16 GE and '17 Special election...
()
()
So what we see here is that Birmingham expanded their overall vote share by 1.5-2.0% of the total County Vote. We also see that rural parts of Jefferson County saw their vote share decrease by similar numbers.
Now, time to look at the 2016 Pres GE percentages and margins by City within Jefferson County.
()
Here are the 2017 US SEN percentages and margins by City within Jefferson County...
()
Now, lets look at the % swings in Jefferson County by City:
()
So, at this point most of us following the election not living a world of delusion nor denial, essentially illustrates a dramatic swing towards Jones in Middle-Class and Upper-Income White suburbs of Birmingham, compared to HRC's performance in 2016.
Now, let's look at the Voter turnout in the '17 US-SEN election by place:
()
So what's interesting here is not just that voter turnout was high in overwhelmingly White and Upper-Income regions of Jefferson County, but also that 49% of voters in Birmingham turnout out to vote, when the SoS of 'Bama was estimating 25-27% turnout for the Special Election, and I thought I heard that overall Voter turnout in 'Bama was somewhere close to 40% for this election...
Other than Mountain Brook (56-37 Jones) and Vestavia Hills (51-45 Jones), Birmingham had the 3rd highest voter turnout rate within Jefferson County,
Now, what is fascinating here is the dramatic drop in support for Moore in rural parts of Jefferson County compared to Donald Trump...
The lowest level of turnout in Jefferson County where Trump achieved net +20k raw vote margins in '16, translates to less than a +9k Moore raw Vote margin in '17....
One last note, this is what the chart looks like when one examines the raw vote margin by City in Jefferson County between '16 and '17 that presents more a visual on how these various dynamics suddenly made Jefferson County a 70% Democratic bastion in '17, after only giving HRC 52% of the vote in '16....
()
Food for thought, and still shifting through the precinct level data from Alabama....
Title: Re: NOVA GREEN's Election Analysis Thread
Post by: Canis on April 01, 2018, 07:18:09 PM
This is great does anyone have a shift map of the alabama senate race? or have a link to it on atlas I can't find it I know someone added it
Title: Re: NOVA GREEN's Election Analysis Thread
Post by: NOVA Green on April 01, 2018, 07:21:11 PM
One thing I've been wondering since Election Night, is what exactly happened in Baldwin County...
You saw almost a 50% collapse of the Republican Vote share compared to Trump's performance in 2016.
Trump received 34.4k more votes than Roy Moore, and although Doug Jones gained 3.7k more votes than HRC for a net 20% increase of the Democratic Vote between '16 and '17, and 1.7k voters wrote-In someone else (Presumably mainly disgruntled Republicans), it appears that many 'Pub voters simply decided to stay home on Election Day.
The collapse in the 'Pub vote was visible in every precinct in the County, although to a much lesser extent in a heavily African-American Precinct in Bay Minette.
Overall the margins in the County swung 31% Democratic between '16 and '17, although this phenomenon was much more visible in a relatively small number of large precincts, which I'll get to shortly.
Unfortunately Baldwin County is a bit trickier than some to work with, as the precinct lines to not cleanly overlay with Municipal Boundaries, but still it gives us a starting point when it comes to overlapping election data with Census data.
()
Here's a link to the Baldwin County election office, which makes it easier to look at than the small picture posted above.
http://baldwincountyal.gov/docs/default-source/voting-precinct-changes/2016-precinct-map.pdf?sfvrsn=2
Baldwin County is overwhelmingly White (83%) and only 10% African-American, with the White share the population rising to 90% for the critical 55+ demographic. It is a bit older than the State at larger with 32% of the population 55+ Yrs.
It also tends to be a bit wealthier than most Counties in Alabama, with an MHI of $50.2k/Yr, which is perhaps even more remarkable considering the relatively size of the retiree population.
It appears to also have a lower proportion of Evangelical Christians than many other places in Alabama, including Southern Baptists, although honestly the data on this might be a bit sketchy.
Ok now, take a look at those precincts where there were the largest swings towards Jones, compared to the '16 US Pres election.
()
So what do these precincts share in common?
They are some of the wealthiest and most educated precincts within Baldwin County, with Precinct #7 overlapping pretty closely with a Census tract where the MHI is $82.8k/Yr, the Daphne precincts overlying closely with Census tracts where the MHI is $70-71k/ Yr, and Fairhope at about $58k/yr.
If you look at Educational attainment by Tract, you see roughly 55% of the population over 25 years have a Post-Secondary degree.
If we look at the total vote for these four precincts alone, they represented 24.2% of the County Vote in 2016, and jumped to 26.0% in 2017.
The 2016 US PRES numbers were 23,026 Total Votes---- (26.4% Dem), (68.0% Rep)
The 2017 US SEN numbers were 16,216 Total Votes--- (47.0% Dem), (50.0% Rep).
So here is a visual representation of the net vote change between '16 and '17 for these precincts:
()
So basically about 20% of drop-off in the Republican vote here were crossover Trump > Jones voters, combined with roughly 7% who wrote-in an alternative candidate (Assuming the WIs were 'Pub voters).
So basically those places that swung hardest Dem between '16 > '17 in Baldwin County did it both as a result of a significant chunk of cross-over voters, AND significant decrease in Republican enthusiasm in the wealthiest parts of the County.
There are similar patterns, but to less visible extent in White Middle and Upper-Middle Class precincts, a short commuting distance over the Bay to Mobile.
So how did Gulf Coast Retirees vote in 2016 and 2017?
So basically I'm limiting this to the three precincts along the Gulf Coast that are overwhelmingly 55+ and older, all of which actually have a pretty decent income for retirees, some $50-70k / YR MHI.
()
So interestingly enough here we observe a 33% Swing towards Doug Jones compared to HRC's performance in these older White retiree precincts, which is not something that I was particularly expecting...
A lot of this might explain the Moore/Bannon/Trump triangulation on Baldwin County in the closing days of the campaign.
So if we look at the overall vote share for Gulf Coast Retirees in these precincts, they were 11.0% of the total County Vote in '16, and 11.4% in '17.
The interesting thing here is that you had one of the largest % increase in the Democratic total vote between '16 > '17....
About 18% of the drop in 'Pub support (3880 total votes between '16 and '17) can be explained by Trump > Jones crossover voters, and about 5% from presumably 'Pub voters who wrote in another Candidate in '17.
()
So basically we have 37% of the '17 County Voting Population accounted for in just these seven precincts, where both cross-over voters, and decline in 'Pub Participation played a major role.
Title: Re: NOVA GREEN's Election Analysis Thread
Post by: NOVA Green on April 01, 2018, 07:24:39 PM
Calhoun County, Alabama:
()
Located in the Northeastern part of Alabama, in theory this should have been total Roy Moore Country, as one of the most Republican Counties of Northern/Northeastern 'Bama for quite a few decades...
Democrats have not won the County since '76, and although Carter only narrowly lost it in '80 against Reagan, Doug Jones performed better than any Democratic President in the County, even Bill Clinton '96, who only captured 43% of the Vote vs Dole's 49%.
Even Al Gore only won 41% of the Vote here in '00.
Dems have been stuck in the 33% range from '04-'12, dropping to their lowest vote share ever since '72.
Compare Calhoun County (74-21 White/African-American) vs neighboring Etowah County (Gadsden) which is (79-15 White/African-American), and Etowah County not only voted overwhelmingly for Carter in both '76/'80, but barely voted for Ronald Reagan in '84 by ~ 150 votes, and same with Bush Sr in '88.
Bill Clinton won Etowah County under Bill Clinton with about 48% of the vote, and Gore bagged 44%, and the results slip down to 24% by '16.
So... Roy Moore wins Etowah (59-39) and Calhoun only (55-44).
What gives with the tale of two Counties? Was originally trying to pull the precinct numbers from Etowah, but unfortunately these are not yet available and stumbled in Calhoun instead.
Ok--- how to break down the precinct numbers for Calhoun County?
Fortunately, the County makes it a bit easier than some to break down the results by municipality than some, although honestly their precinct maps are crap, so trying to separate City precincts from Uninc, etc gets a little bit sketch, but makes it easier to work with:
So here is the Vote Share by Place results in the 2016 GE and the 2017 US-SEN election...
()
()
Ok--- numbers get tricky because we don't really have a good precinct map for the County, so some of these precincts overlap with Oxford and Uninc areas, and quite frankly don't believe that Anniston which consists of only 25% of the County population represented 24% of the County Vote in '16, but still helps explain the Story...
So, what are the voting percentages by Place in Calhoun County?
2016:
()
2017:
()
Now the story of Calhoun County is an overall decline of support for both candidates, compared to the 2016 Presidential Election....
Jones received 12% less of the vote than HRC in '16, and Moore received a whopping 56% less of the Republican Vote than Trump in '16.
Interestingly enough, Jones biggest drop of support compared to HRC's numbers were in heavily Democratic African-American precincts in Anniston....
()
Now obviously the key thing here is that Anniston not only consists of 20% of the County vote, but is only a narrowly African-American City (52-44) ... which is still a driver of the local economy with the largest employers in the area being the Anniston Army Depot (4.3k employees), the Honda Plant outside of Oxford Alabama right South of Anniston, and overall the Anniston Metro precincts swung some 30% HRC>Jones (Despite the issues with cleanly separating municipal precinct lines)
Oxford has an MHI of $ 49.7k/Yr and is 78% White vs 12% African-American.
()
Here we see a 26% swing between HRC and Jones (Likely larger with cleaner precinct coding).
We could look at the 3rd largest City Jacksonville (68-26 White/Black) that went from (35-58) Trump to (54-44 Jones)...
Law Enforcement is the largest relative occupation (3.0%), followed by Food Service (10.2%), and Education (11.4%).
So, working Class Exurb North of Anniston that swung hard Dem.
Obviously we would be remiss not to mention the collapse of rural support in the '17 US-SEN election...
In Calhoun County, these places are overwhelmingly Old and White, but still represent roughly 34-35% of the County Vote.
()
So here we see both the biggest decline for Republicans compared to '16 Trump numbers ( -7.7k Votes) and the only precincts where Jones gained net voted +139....
Old 'Dawgs comin' home???
()
Located in the Northeastern part of Alabama, in theory this should have been total Roy Moore Country, as one of the most Republican Counties of Northern/Northeastern 'Bama for quite a few decades...
Democrats have not won the County since '76, and although Carter only narrowly lost it in '80 against Reagan, Doug Jones performed better than any Democratic President in the County, even Bill Clinton '96, who only captured 43% of the Vote vs Dole's 49%.
Even Al Gore only won 41% of the Vote here in '00.
Dems have been stuck in the 33% range from '04-'12, dropping to their lowest vote share ever since '72.
Compare Calhoun County (74-21 White/African-American) vs neighboring Etowah County (Gadsden) which is (79-15 White/African-American), and Etowah County not only voted overwhelmingly for Carter in both '76/'80, but barely voted for Ronald Reagan in '84 by ~ 150 votes, and same with Bush Sr in '88.
Bill Clinton won Etowah County under Bill Clinton with about 48% of the vote, and Gore bagged 44%, and the results slip down to 24% by '16.
So... Roy Moore wins Etowah (59-39) and Calhoun only (55-44).
What gives with the tale of two Counties? Was originally trying to pull the precinct numbers from Etowah, but unfortunately these are not yet available and stumbled in Calhoun instead.
Ok--- how to break down the precinct numbers for Calhoun County?
Fortunately, the County makes it a bit easier than some to break down the results by municipality than some, although honestly their precinct maps are crap, so trying to separate City precincts from Uninc, etc gets a little bit sketch, but makes it easier to work with:
So here is the Vote Share by Place results in the 2016 GE and the 2017 US-SEN election...
()
()
Ok--- numbers get tricky because we don't really have a good precinct map for the County, so some of these precincts overlap with Oxford and Uninc areas, and quite frankly don't believe that Anniston which consists of only 25% of the County population represented 24% of the County Vote in '16, but still helps explain the Story...
So, what are the voting percentages by Place in Calhoun County?
2016:
()
2017:
()
Now the story of Calhoun County is an overall decline of support for both candidates, compared to the 2016 Presidential Election....
Jones received 12% less of the vote than HRC in '16, and Moore received a whopping 56% less of the Republican Vote than Trump in '16.
Interestingly enough, Jones biggest drop of support compared to HRC's numbers were in heavily Democratic African-American precincts in Anniston....
()
Now obviously the key thing here is that Anniston not only consists of 20% of the County vote, but is only a narrowly African-American City (52-44) ... which is still a driver of the local economy with the largest employers in the area being the Anniston Army Depot (4.3k employees), the Honda Plant outside of Oxford Alabama right South of Anniston, and overall the Anniston Metro precincts swung some 30% HRC>Jones (Despite the issues with cleanly separating municipal precinct lines)
Oxford has an MHI of $ 49.7k/Yr and is 78% White vs 12% African-American.
()
Here we see a 26% swing between HRC and Jones (Likely larger with cleaner precinct coding).
We could look at the 3rd largest City Jacksonville (68-26 White/Black) that went from (35-58) Trump to (54-44 Jones)...
Law Enforcement is the largest relative occupation (3.0%), followed by Food Service (10.2%), and Education (11.4%).
So, working Class Exurb North of Anniston that swung hard Dem.
Obviously we would be remiss not to mention the collapse of rural support in the '17 US-SEN election...
In Calhoun County, these places are overwhelmingly Old and White, but still represent roughly 34-35% of the County Vote.
()
So here we see both the biggest decline for Republicans compared to '16 Trump numbers ( -7.7k Votes) and the only precincts where Jones gained net voted +139....
Old 'Dawgs comin' home???
Title: Re: NOVA GREEN's Election Analysis Thread
Post by: NOVA Green on April 01, 2018, 07:28:09 PM
Ok--- this might be the last of these for awhile, unless there is interest out there, since I have several projects that I have put on hold working on Alabama, and also we don't have precinct level results available for many parts of the State yet for the '17 US-SEN Election.
Mobile, County:
()
A significant Jones win in Mobile County was a necessary, but not sufficient component for any potential statewide win, since as the second largest County by population in the State (413k) it was virtually unfathomable to envision a Jones victory without significant wins both here and in Madison County, combined with expected lopsided margins in Jefferson and Montgomery Counties, to offset heavily Republican votes in smaller Counties and rural areas elsewhere in the State.
Still, Jones overall vote margins and percentages by which he won Mobile County were likely a bit higher than one might have imagined, considering the population is 59-35 White-Black, and the County as a whole went 42-56 Trump in 2016.
()
So, before I start getting into items such as vote margin changes by place, turnout changes, vote-cross-over etc, let's start by looking at what the vote by place looked like in the 2016 GE vs the 2017 SEN Election.
2016:
()
2017:
2017:
()
So, interestingly enough you see Mobile's vote share go up from 46 > 52% of the County total, with the only other place with an increase being Prichard (A heavily Democratic City North of Mobile), and the biggest decrease happening in Rural areas, with most other places in the County losing vote share as well....
Now if we look at how the places in Mobile County voted in '16 and '17, and what the swings were we see the following:
()
So----
1.) The margin swings between '16 and '17 were actually relatively close in almost all places in Mobile County, with the exception of overwhelmingly African-American City of Prichard, slightly lower swings in Citronelle, in the far North of the County.
2.) Significantly the swings in Mobile were at 25%, which considering it's disproportionate share of the County Vote, as well as being a 44-51 African-American City, obviously played a major role in Doug Jones overall margins within Mobile County.
UNINC areas and Semmes stand out because of their population of Middle and Upper-Middle Class White voters, as does Tillmans Corner, because of its large concentration of White Working Class Voters....
So now the next item is to look at where voter support/turnout dropped for the respective two major party candidates between '16 and '17, and then take a look at cross-over voters after.
City of Mobile:
1.) Precincts HRC won by > 80% in the 2016 GE:
So, these are generally heavily African-American precincts, and here we see Jones losing a Net +3.0k votes compared to HRC in '16 for a 20% drop in numbers, although granted Moore's support collapsed 45%, it's not really seeming the Jones got the same type of vote turnout and mobilization in the African-American community that he did in Birmingham.
Now it is also interesting that this data set also includes two precincts with a high proportion of College Students ( # 27 Bishop State Community College and # 37 directly West of the University of South Alabama)...
()
2.) Precincts won by HRC with 65-80% Dem Vote:
These are precincts that generally are majority African-American, but with a significant White vote as well. Here we see Dem turnout collapsing 16% and 'Pub turnout collapsing 49%, and 'Pubs actually lose a net 200 Votes here on the voter turnout / cross-over voter War.
()
3.) HRC 50-65% Precincts
Now we are starting to get into precincts that are majority White, in some cases significantly so, but still with a large African-American Population...
()
So, here we see the Democratic turnout gap advancing significantly, while the decline in the 'Pub vote share remains pretty high....
Likely some of this is a result of 'Pub cross-over votes, but we don't have a mechanism to directly prove that.
4.) "Trump Precincts"---- This basically lumps all precincts here HRC captured <50% of the Vote in '16, although one of these she narrowly won with a plurality.
These are for the most part overwhelmingly White Precincts....
()
So here we see 1,500 Democratic Votes for Doug Jones over the 2016 HRC numbers...
These are definitely 100% crossover vote numbers, which is certainly significant.
5.) Although obviously a deeper dive of Mobile Precinct results are warranted, as I posited several weeks before the AL-US-SEN election, that Roy Moore would likely fare poorly in Mobile and in the "Cajun Country" part of Alabama, because of his history as a religious bigot.
I also referenced the role and connections of Interfaith Religious Networks, including Jews, Catholics, Mainline Protestants, Traditional Black Christian Churches, and various Evangelical networks...
http://www.encyclopediaofalabama.org/article/h-1878
https://en.wikipedia.org/wiki/Congregation_Sha%27arai_Shomayim_(Mobile,_Alabama)
So here are the precinct results from one of the most Republican Precincts in Mobile, located overwhelmingly on the Campus of Spring Hill College (Private Jesuit Catholic School)...
https://en.wikipedia.org/wiki/Spring_Hill_College
()
So, collapse of Roy Moore certainly seems to have hit hard in any overwhelmingly Catholic Precinct, and one of the most Republican precincts in the City, in an extremely diverse community going back centuries when it comes from everything involving ancestry/country of origin---Race/Ethnicity--- Religious Diversity--- Social Class/Income.
I could run through some of numbers from other places, but I think the UNINC and Rural numbers speak for themselves....
My main question is less at this point will these voters back Doug Jones in 2020, than to what extent of the radioactive nature of the Trump brand, causing normal moderate Alabama 'Pubs from places like the Cities of Mobile, Daphne, Vestavia Hills, and Mountain Brook, to abandon flirting with the Republican Party altogether, and accept their identity as Democrats.
Title: Re: NOVA GREEN's Election Analysis Thread
Post by: NOVA Green on April 01, 2018, 07:30:09 PM
Lee County Alabama:
()
So, as there has been so much talk about Lee County Alabama (Auburn) and the dramatic shifts in voting and all of that, I decided to pull up the '16 and '17 numbers to see if they shed any light on the subject.
Lee County doesn't have a ton of voting precincts, since like many other places in the Country, they have "broadbanded" and consolidated voting locations over the years, which is either a positive or negative development depending upon one's Point of View (POV). Personally, I prefer greater detail to a lesser amount of detail when it comes to precincts, since it makes it easier to do a deeper dive into voting habits by demographics, but hey at least it looks like overall they've avoided all of the messiness that comes with split precinct BS, which is part of reason Madison County isn't at the top of my list for a compare/contrast exercise between the '16 GE and '17 AL-SEN elections.
So, the media narrative was that Doug Jones was swept to victory as a result of a massive surge in Democratic turnout among young voters, African-Americans, White Democrats, combined with swings among College Educated Middle Class Voters in the Metro Areas, extremely depressed evangelical White turnout, the more one looks at the data, the more simplistic that narrative becomes (Although there are still significant core elements of truth there).
1.) So far looking at the precinct level results, it appears that in African-American precincts in Birmingham there was a massive turnout surge, albeit with some significant declines in some heavily working-class and poorer precincts of the City. In Mobile, turnout was down significantly in heavily African-American precincts, but much less so than in heavily White working-class precincts. In Blue collar manufacturing cities in Alabama, we saw a significant dip in African-American turnout in places like Bessemer, Bay Minette, Prichard, and Anniston.
2.) The drop in 'Pub turnout in White working-class precincts of these cities was significantly larger than the drop in AA turnout in the equivalent of the "neighborhood across the railroad tracks" in all four of these Blue Collar towns. The drop in 'Pub turnout in rural areas overall based on the precincts we have covered thus far in Jefferson, Baldwin, Calhoun, and Mobile Counties was even much higher, which is especially significant because of how Republican these rural precincts are and typically quite a bit older and Whiter, and presumably more frequent in terms of rates of Church attendance.
3.) Precinct level data has shown a significant Republican cross-over vote in places like Mountain Brook, Vestavia Hills, Hoover, Uninc Jefferson Co (Jefferson Co), Daphne & Spanish Fort (Baldwin Co), Older Middle Class retirement communities on the Gulf Coast (Baldwin Co) Middle and Upper Middle Class 'Pub precincts in Mobile, and likely to some extent in the heavily White Auto Factory town of Oxford (Calhoun County).
4.) What about the Millennial Vote and Student Vote?
Well, if you're looking for it in Lee County (Auburn) you are not going to see it.
()
The collapse of votes for both major party candidates here was astronomical, not to say that there weren't crossover voters, etc,
Does this mean that Auburn Undergrad students who are actually from Alabama didn't vote in the 2017 AL-SEN election? Absolutely, many of them likely did via an absentee ballot sent to their parent's addresses in the heavily White Upper-Middle-Class communities from when they predominate. 12/11-12/15 was Finals week in Auburn, and although Doug Jones appearance at the Iron Bowl might have helped him within the County overall, one must wonder to what extent it was targeted not specifically at the University Vote, but rather to demonstrate that he's a regular 'Baman like anyone else, and not some Liberal stereotype who doesn't like Football "because kids might get hurt playin' ball".
Still, we can't quantify that vote in the same way we can for other demographics, so let's take a look at who actually voted in Lee County in the '17 US Senate Race.
Lee County AL: Vote Share by Place 2016 and 2017:
2016:
()
2017:
()
Ok--- We see Auburn lose about 1% of the County Vote Share, Opelika pick up 4% of the County Vote Share, Smith Station stay constant, rural areas added 1% to their vote share (!!!), and absentee and provisional ballots lose 4% of their vote share (!!!!)
So how did the various communities in Lee County Vote in '16 and '17?
()
This is pretty interesting right here....
Despite what appears to be a relatively lacking College Student vote in Auburn, Jones actually won every place in the County, with the exception of rural areas, where he came within a few points of Roy Moore.
So it appears that the "townie" vote within the County (Including places other than Auburn) swung hard for Jones, regardless of the lack of an apparent Undergrad College Vote in 2017....
Let's look at the Vote margins and swings by place in Lee County 2016 > 2017:
()
So overall Democratic vote margin swings were around 36-37% in most of the County.
The exception was Smiths Station, where there was a 44% vote margin swing!!!!
Total Vote Margin Change 2016 > 2017 by Precinct:
()
Ok---- Wow, just Wow!!!
Dems lost > 50% of their '16 vote in every precinct in the County (Excepting a small rural precinct "Uptown Marvyn", and Moore lost > 80% of the '16 'Pub vote in every precinct in the County, excepting a couple in Opelika and one in rural Beulah, where he only lost 77-79% of Trump's '16 vote in the County.
So, in Lee County, it was definitely a turnout war to see which campaign could do a better job of pulling out what voters were actually around and interested in going to the polls.
So, one last note....
1.) Auburn (17-72 Black/White).... This statistic is likely distorted because the student population is much "Whiter" than the Townie population, but still of the five precincts within the City of Auburn, we have one that is in a Census tract with the highest % of African-Americans within the City of Auburn.
Precinct # 10: Boykin Community Center:
Here is what you see when the College kids go home.... Sure there was a drop in overall total raw vote margins, but look at the margin % ???
()
Precinct # 14: Clarion Inn South College:
This includes the dorms of Auburn, as well as a significant chunk of off-campus student housing...
()
So, these numbers appear pretty obvious.... Auburn University Undergrads are much more Republican than the City at large, and once they left, the University town started to vote a bit differently.
2.) Numbers from Opelika are also a bit interesting, considering that although it is close enough to Auburn to have *some* Undergrad College kids residing within the City limits, is actually more of a working and lower-middle-class community, that is the seat of County government, and also a bedroom community for many locals who can't afford to live in an expensive college town like Auburn, plus some Grad students living in the Modern Day "Sweatshops of Academia", where they get paid crap wages to teach the works of the professors, in exchange for indentured servitude
(42-49 African-American/White), MHI $ 40.1k
3.) Smith Station--- This one totally caught me off-guard.
It's basically a suburban/ Exurban community part of the Metro Columbus- GA / Phenix City AL MSA, and has very little to do with the College areas around Auburn and Opelika.
(15-79 African-American/White), MHI $ 44.3k/Yr
It has the 11th largest High School in Alabama, which means that Friday Night High School ballgames are huge here...
https://kickerfm.iheart.com/featured/east-alabama-hs-football/content/2017-07-27-smiths-station-panthers-2017-football-schedule/
https://en.wikipedia.org/wiki/Smiths_Station,_Alabama
This place swung 44% towards Doug Jones (51- 49 D) vs (27-69 Trump).
So right next to Phenix City, the fictional backdrop of one of the best NativeSouthern Detective writers Ace Atkins setting in "Wicked City", on the edge of a rapidly growing Metro expansion of Columbus, Georgia across into Alabama, not to mention Fort Benning Georgia....
Although, I haven't yet delved into Russell County, we are starting to see a trend where even in relatively small counties in Alabama, if there are major connections with industrial employers (Auto) or private sector employers (Military) we're not really seeing the love for Roy Moore for some bizarre reason.
()
4.) Rural Areas---- My thought on rural areas in Lee County, is that as the smallest County in Alabama in terms of land area, it doesn't consist as heavily as the same types of rural voters that we have seen in Jefferson, Baldwin, Calhoun, and Mobile Counties.... Meaning that many of these "rural precincts" have a significant component of individuals that have the money and means to live on some acres outside of the cities in the various townships, and still commute to work in places like Auburn, Opelika, Smith Station, Phenix City, and in some cases even Columbus Georgia....
Otherwise not sure how to explain the dramatic swing in rural areas, regardless of the dramatic drop in overall voter turnout within the County.
Edit: Was just thinking of this classic song from one of the Old Blues artists from Alabama...:
Lead Belly: Alabama Bound
https://www.youtube.com/watch?v=vfBbLuGmWhc
()
So, as there has been so much talk about Lee County Alabama (Auburn) and the dramatic shifts in voting and all of that, I decided to pull up the '16 and '17 numbers to see if they shed any light on the subject.
Lee County doesn't have a ton of voting precincts, since like many other places in the Country, they have "broadbanded" and consolidated voting locations over the years, which is either a positive or negative development depending upon one's Point of View (POV). Personally, I prefer greater detail to a lesser amount of detail when it comes to precincts, since it makes it easier to do a deeper dive into voting habits by demographics, but hey at least it looks like overall they've avoided all of the messiness that comes with split precinct BS, which is part of reason Madison County isn't at the top of my list for a compare/contrast exercise between the '16 GE and '17 AL-SEN elections.
So, the media narrative was that Doug Jones was swept to victory as a result of a massive surge in Democratic turnout among young voters, African-Americans, White Democrats, combined with swings among College Educated Middle Class Voters in the Metro Areas, extremely depressed evangelical White turnout, the more one looks at the data, the more simplistic that narrative becomes (Although there are still significant core elements of truth there).
1.) So far looking at the precinct level results, it appears that in African-American precincts in Birmingham there was a massive turnout surge, albeit with some significant declines in some heavily working-class and poorer precincts of the City. In Mobile, turnout was down significantly in heavily African-American precincts, but much less so than in heavily White working-class precincts. In Blue collar manufacturing cities in Alabama, we saw a significant dip in African-American turnout in places like Bessemer, Bay Minette, Prichard, and Anniston.
2.) The drop in 'Pub turnout in White working-class precincts of these cities was significantly larger than the drop in AA turnout in the equivalent of the "neighborhood across the railroad tracks" in all four of these Blue Collar towns. The drop in 'Pub turnout in rural areas overall based on the precincts we have covered thus far in Jefferson, Baldwin, Calhoun, and Mobile Counties was even much higher, which is especially significant because of how Republican these rural precincts are and typically quite a bit older and Whiter, and presumably more frequent in terms of rates of Church attendance.
3.) Precinct level data has shown a significant Republican cross-over vote in places like Mountain Brook, Vestavia Hills, Hoover, Uninc Jefferson Co (Jefferson Co), Daphne & Spanish Fort (Baldwin Co), Older Middle Class retirement communities on the Gulf Coast (Baldwin Co) Middle and Upper Middle Class 'Pub precincts in Mobile, and likely to some extent in the heavily White Auto Factory town of Oxford (Calhoun County).
4.) What about the Millennial Vote and Student Vote?
Well, if you're looking for it in Lee County (Auburn) you are not going to see it.
()
The collapse of votes for both major party candidates here was astronomical, not to say that there weren't crossover voters, etc,
Does this mean that Auburn Undergrad students who are actually from Alabama didn't vote in the 2017 AL-SEN election? Absolutely, many of them likely did via an absentee ballot sent to their parent's addresses in the heavily White Upper-Middle-Class communities from when they predominate. 12/11-12/15 was Finals week in Auburn, and although Doug Jones appearance at the Iron Bowl might have helped him within the County overall, one must wonder to what extent it was targeted not specifically at the University Vote, but rather to demonstrate that he's a regular 'Baman like anyone else, and not some Liberal stereotype who doesn't like Football "because kids might get hurt playin' ball".
Still, we can't quantify that vote in the same way we can for other demographics, so let's take a look at who actually voted in Lee County in the '17 US Senate Race.
Lee County AL: Vote Share by Place 2016 and 2017:
2016:
()
2017:
()
Ok--- We see Auburn lose about 1% of the County Vote Share, Opelika pick up 4% of the County Vote Share, Smith Station stay constant, rural areas added 1% to their vote share (!!!), and absentee and provisional ballots lose 4% of their vote share (!!!!)
So how did the various communities in Lee County Vote in '16 and '17?
()
This is pretty interesting right here....
Despite what appears to be a relatively lacking College Student vote in Auburn, Jones actually won every place in the County, with the exception of rural areas, where he came within a few points of Roy Moore.
So it appears that the "townie" vote within the County (Including places other than Auburn) swung hard for Jones, regardless of the lack of an apparent Undergrad College Vote in 2017....
Let's look at the Vote margins and swings by place in Lee County 2016 > 2017:
()
So overall Democratic vote margin swings were around 36-37% in most of the County.
The exception was Smiths Station, where there was a 44% vote margin swing!!!!
Total Vote Margin Change 2016 > 2017 by Precinct:
()
Ok---- Wow, just Wow!!!
Dems lost > 50% of their '16 vote in every precinct in the County (Excepting a small rural precinct "Uptown Marvyn", and Moore lost > 80% of the '16 'Pub vote in every precinct in the County, excepting a couple in Opelika and one in rural Beulah, where he only lost 77-79% of Trump's '16 vote in the County.
So, in Lee County, it was definitely a turnout war to see which campaign could do a better job of pulling out what voters were actually around and interested in going to the polls.
So, one last note....
1.) Auburn (17-72 Black/White).... This statistic is likely distorted because the student population is much "Whiter" than the Townie population, but still of the five precincts within the City of Auburn, we have one that is in a Census tract with the highest % of African-Americans within the City of Auburn.
Precinct # 10: Boykin Community Center:
Here is what you see when the College kids go home.... Sure there was a drop in overall total raw vote margins, but look at the margin % ???
()
Precinct # 14: Clarion Inn South College:
This includes the dorms of Auburn, as well as a significant chunk of off-campus student housing...
()
So, these numbers appear pretty obvious.... Auburn University Undergrads are much more Republican than the City at large, and once they left, the University town started to vote a bit differently.
2.) Numbers from Opelika are also a bit interesting, considering that although it is close enough to Auburn to have *some* Undergrad College kids residing within the City limits, is actually more of a working and lower-middle-class community, that is the seat of County government, and also a bedroom community for many locals who can't afford to live in an expensive college town like Auburn, plus some Grad students living in the Modern Day "Sweatshops of Academia", where they get paid crap wages to teach the works of the professors, in exchange for indentured servitude
(42-49 African-American/White), MHI $ 40.1k
3.) Smith Station--- This one totally caught me off-guard.
It's basically a suburban/ Exurban community part of the Metro Columbus- GA / Phenix City AL MSA, and has very little to do with the College areas around Auburn and Opelika.
(15-79 African-American/White), MHI $ 44.3k/Yr
It has the 11th largest High School in Alabama, which means that Friday Night High School ballgames are huge here...
https://kickerfm.iheart.com/featured/east-alabama-hs-football/content/2017-07-27-smiths-station-panthers-2017-football-schedule/
https://en.wikipedia.org/wiki/Smiths_Station,_Alabama
This place swung 44% towards Doug Jones (51- 49 D) vs (27-69 Trump).
So right next to Phenix City, the fictional backdrop of one of the best NativeSouthern Detective writers Ace Atkins setting in "Wicked City", on the edge of a rapidly growing Metro expansion of Columbus, Georgia across into Alabama, not to mention Fort Benning Georgia....
Although, I haven't yet delved into Russell County, we are starting to see a trend where even in relatively small counties in Alabama, if there are major connections with industrial employers (Auto) or private sector employers (Military) we're not really seeing the love for Roy Moore for some bizarre reason.
()
4.) Rural Areas---- My thought on rural areas in Lee County, is that as the smallest County in Alabama in terms of land area, it doesn't consist as heavily as the same types of rural voters that we have seen in Jefferson, Baldwin, Calhoun, and Mobile Counties.... Meaning that many of these "rural precincts" have a significant component of individuals that have the money and means to live on some acres outside of the cities in the various townships, and still commute to work in places like Auburn, Opelika, Smith Station, Phenix City, and in some cases even Columbus Georgia....
Otherwise not sure how to explain the dramatic swing in rural areas, regardless of the dramatic drop in overall voter turnout within the County.
Edit: Was just thinking of this classic song from one of the Old Blues artists from Alabama...:
Lead Belly: Alabama Bound
https://www.youtube.com/watch?v=vfBbLuGmWhc
Title: Re: NOVA GREEN's Election Analysis Thread
Post by: NOVA Green on April 01, 2018, 07:33:47 PM
Great work NOVA Green! Do you yourself have an overall conclusion from all this analysis as to what was the main driver of Jones' win?
Thanks Gustaf!
At this point I have only covered precinct level results from Alabama consisting of 34% of the 2017 US-Senate vote, from five counties in the State, so there is still a bit of work to do on this project, so I certainly don't want to suggest this is anywhere close to a definitive study of these election results.
()
Still, as I posted earlier:
1.) African-American turnout within the City of Birmingham was key to creating the insane margins that we saw in Jefferson County Alabama (Much larger than I was expecting).
2.) Huge net swings of Trump '16 > Jones '17 voters in wealthier White precincts in the larger Metro areas, including the cities of Mobile, Daphne, Spanish Fort, Mountain Brook, Vestavia Hills, Hoover, and Oxford.
3.) In Working-Class factory towns of Alabama, such as Bessemer, Bay Minette, Prichard, and Anniston, we saw a significant decrease in AA turnout compared to Middle-Class AA precincts in Birmingham and Mobile, but an even larger collapse in WWC turnout in the "separate but equal" communities just across the railroad tracks.
4.) The largest collapse in Republican support happened in older, overwhelmingly White, and rural precincts, and apparently despite Trump's alleged popularity among this community, it didn't matter a hill of beans when it came to his last ditch effort to drag Roy Moore over the finish line.
5.) Trump's popularity is fading fast in Alabama, just like many other parts of the country. In fact some recent polls have shown his biggest collapse over the past three months occurring among White Evangelical voters.
There are quite a few reasons why Trump chose to do his finale support for Moore from Pensacola, Florida, instead of doing a Stadium style rally in Alabama.
There is a reason that Steve Bannon showed up at a last minute joint campaign event with Roy Moore in South Alabama, but the numbers from Baldwin County, and the traditionally Republican heartlands of SE 'Bama clearly indicate that that "dirty dawg don't hunt no more"....
Just fine withholding my support and let the Yellow Dawg win, rather than vote for the Republican that stole $ 1 Million out of a Christian charity to line his own pockets with.
Anyways, hoping to pull some more precinct level numbers together soon, especially once we get the Statewide precinct numbers certified, but fwiw these are some of my initial humble thoughts on the subject.
Title: Re: NOVA GREEN's Election Analysis Thread
Post by: NOVA Green on April 01, 2018, 07:37:34 PM
Roy Moore was an extremely unpopular officer during 'Nam, to the point where he would have to barricade his tent with sandbags, just so a live grenade wouldn't pop up in his tent while he was sleeping.
...wow.
Sure, it is not surprising that he was type of officer that was extremely unpopular during 'Nam, considering all we have learned since regarding his moral character and personality.
What is extremely surprising is that in a part of the Country where Bill Clinton was extremely unpopular because "he was busy smoking weed overseas in the UK in order to dodge the draft", Al Gore gets hit hard for similar reasons involving the politics of the 1960s, George W. Bush is busy dodging the draft, getting high on weed and cocaine stationed at some Air National Guard Base, where he barely showed up for work (Got a pass on that), John Kerry get's "swiftboated" in '04, even though he was the type of officer that took lead along with the enlisted Men under his command in 'Nam, McCain did quite well in Alabama and many other parts of the region among the 'Vets from that War.
Obama was actually the first US Presidential nominee since before '92 where you didn't have a Democrat running for office with the ghosts of Vietnam hanging over the Party candidate...
Bush Sr in '92 was obviously way too old to have served in 'Nam, but as part of the Greatest Generation he served with honor and distinction in WW II.
Bob Dole in '96 was also a WW II war hero....
George W. Bush.... we've already talked about his history....
McCain.... Vietnam war hero.
Mitt Romney did not serve in Vietnam, something that Steve Bannon just recently attacked him on...
http://www.washingtonexaminer.com/steve-bannon-knocks-mitt-romney-for-lack-of-military-service-while-defending-roy-moore/article/2642676
So, Roy Moore did serve in Vietnam, and he was known for writing Article 15s, apparently visited some brothels during his Tour of Duty, although according to one former buddy didn't sleep with the underage prostitutes guarded by South Vietnamese Army troops as a private business gig to line the pockets of the corrupt military officers of South Vietnam towards the end of the War.
https://www.huffingtonpost.com/entry/the-forgotten-history-of-fragging-in-vietnam_us_5a1b77b6e4b0cee6c050939d
http://www.nj.com/opinion/index.ssf/2017/11/a_jersey_lawyer_stands_up_for_his_vienam_war_buddy.html
http://taskandpurpose.com/army-buddy-roy-moore-went-vietnamese-child-brothel-no-big-deal/
http://www.businessinsider.com/roy-moore-transgender-military-lgbtq-vietnam-2017-12
https://www.theatlantic.com/magazine/archive/2005/10/roy-and-his-rock/304264/
Meanwhile, you got this dude Doug Jones that was too young to have been of draft age during the War, graduates from U of A in '76, gets his law Degree from an Evangelical Christian University in Alabama in '79, who came from humble Working Class roots (Daddy worked for the Union represented US Steel Mill just outside of Birmingham that had both a large proportion of working-class African-American and "White-American" workers alike).
I am still surprised the Moore wasn't able to double-down on his military experience (Steve Bannon obviously tried to bring this up vicariously when it came to Mitt Romney), to do a compare/contrast when it comes to Military experience and the US-Senate race.
Doug Jones biography was obviously pretty strong and credible when it came to White working-class Alabama roots, but he obviously lacked military experience on his resume.
I do wonder to what extent war wariness has reduced the impact of a Military background, even in places like Alabama, especially when you have a Republican President who essentially ran against his Republican opponents during the primaries touting his "Opposition to the War in Iraq", which was brutally effective against Jeb Bush (And others) and even was used against HRC during the GE....
Ok--- done with talking... here are a links to a few songs and artists whose works I have purchased over the years, and I would strongly suggest if you like the songs spending $ 1 to support the estates of these musical artists by purchasing the song on your Smartphone or Mobile device, that brought us these musical works. If you really like the artist, do what I have done over the decades and buy the whole damn album...
1.) Pete Seegar- "Big Muddy"
Although this song was set during WW II in training camps, it was a metaphor about the War in Vietnam written in '67 when the s**t was getting hot during LBJ's escalation of the War.
Picture Captain Roy Moore as the Captain fictionally portrayed in this song...
https://www.youtube.com/watch?v=2fUF6RctQvg
*** Warning Vietnam War visuals might be disturbing for 'Vets that have served in war zones ***
2.) Loretta Lynn--- "Dear Uncle Sam"
Although this is one song that typically doesn't float to the top of the list when it comes to Vietnam era songs, the powerful Female vocals from an Appalachian Country Music legend, tells a powerful story about the how the War in 'Nam was hitting home even in extremely patriotic parts of the nation that got hit hardest by the Draft...
https://www.youtube.com/watch?v=ZwOhZufXYso
3.) John Prine--- "Sam Stone"
One of the best American songs when it came to the impact of Drug Addiction, for those that got addicted to Heroin while in the service of their Country in 'Nam.
This original song was so powerful that even legendary Johnny Cash did a cover of this song....
https://www.youtube.com/watch?v=OLVWEYUqGew
4.) Tom Paxton--- "Talking Vietnam"
Ok--- this is a bit more light hearted but definitely a counter-cultural perspective from many of the Vets serving over there....
"The Captain, this blond fellow from Yale, said what's the matter with you baby"
https://www.youtube.com/watch?v=kxSR4ZaDpBg
5.) Billy Joel--- "Goodnight Saigon"
So Roy Moore was a Marine in Vietnam, but apparently didn't believe in the values of the Corps, unlike just about every other USMC member I have ever met, including my Father-in-Law, Son-in-Law, friends that served in Vietnam as US Marine Corp members, my friend Miranda's boyfriend who did three tours in Iraq 2.0 from the initial invasion, to the battle of Falluja...
"We all go down together"
https://www.youtube.com/watch?v=YJlZeTSaT98
So where I'm going with all of this, is the extremely powerful cultural impact of the Vietnam War among older voters in Alabama.
They didn't turn out to support Roy Moore to showcase his service and sacrifice during the War in Vietnam, other than one random lawyer from New Jersey.
USMC blood is thick, it got us onto an airplane flight when all the gates were closed down in San Diego, when my wife was wearing a USMC hoodie after we flew down to visit our son-in-law that was in a coma after having an allergic reaction to all the vaccines they jacked him up with two weeks before he was scheduled to deploy to Afghanistan.
It's pretty telling that Roy Moore's "Vietnam Story" was pretty bunk to start with and Steve Bannon railing against Mitt Romney for not serving during 'Nam (WTF ????).
Roy Moore lost a good chunk of the Military Vet vote in Alabama, likely because his military "history" during the war was already out there an exposed as another puke crap Captain from some University who doesn't understand s**t about the War, but still wants to send us all out to die on Patrols, and running Article 15s like a total a**hole.
Title: Re: NOVA GREEN's Election Analysis Thread
Post by: NOVA Green on April 01, 2018, 07:39:25 PM
Alabama 2017 US-SEN Precinct Review # 6: Morgan County:
()
As I posted elsewhere prior to the election, Doug Jones uphill road to victory would be likely reliant not just on heavy African-American turnout, depressed turnout among White Evangelicals in rural areas, flipping White Middle-Class voters in the larger Cities and Suburbs of the State, but also performing well in Northern Alabama (Not just Huntsville) and regaining a good chunk of the Al Gore 2000 vote from Ancestral Democrats in the old TVA "New Deal" part of Alabama.
If we look at the US Presidential election results for Morgan County from 2000 to 2016, as well as the 2012 Supreme Court Race, we see that Doug Jones actually hit the numbers he needed within the County.
()
Although the larger Metro Areas and College Communities got a disproportionate amount of attention from the Media and Pundits alike, when you look at places like Morgan County (Pop 120k), or Calhoun County (Pop 120k) which I covered earlier, these votes all add up and it is all fine and dandy to run up the numbers in places like Metro Birmingham, Mobile, Huntsville, the Black Belt, but you'll run out of steam if you get killed by insane margins in places like this.
Before we start going into the precinct results in greater detail, let's review the demographic profile of the County:
Race/Ethnicity:
()
These numbers get even starker once you break them down by Age:
()
Median Household Income Relative to Alabama:
()
So doing really well compared to most parts of the State in terms of household Income....
()
Heavily dependent on Manufacturing....
()
and lower rate of educational attainment than Alabama as a whole....
So, what does the precinct level data show from Morgan County???
Let's start with the % of votes by Place within the County in 2016 and 2017:
()
()
So we see the largest City of Decatur going from a 30-32% vote share between '16 and '17, rural areas holding steady at 42% of the County Vote Share, minor changes in Hartselle and Priceville, and the provisional and absentee vote going down dramatically (Likely predominately voters in Decatur).
Now, here are the total vote numbers by place in '16/'17:
()
()
Here is a graphical format that shows the swings and percentages among communities in the County:
()
So the obvious thing that jumps out here:
1.) Decatur the largest single community within the County swung hard Democrat between 2016 and 2017 going from (39-57 Trump) to (56-43 Jones) for a 32% vote swing....
2.) The total Democratic vote numbers increased in all communities within the County (Other than Decatur, which we will get back to shortly), even in rural areas, meaning that you had a not insignificant number of Trump > Jones voters.
3.) The Republican Vote completely collapsed between '16 and '17, regardless of the impact of Trump > Jones voters (We'll come back to that one as well).
Now let's take a look at demographic data briefly from the largest City in the County before breaking down the precinct results from the City:
Decatur, Alabama:
Pop 56k....
Pop by Race/Ethnicity:
()
Household Income by place Decatur and Morgan County:
()
Not nearly as well off as most other parts of the County...
Workforce by Industry:
()
Slightly lower rate of manufacturing than the County as a whole, slightly higher rates of construction, as well as retail and service sector jobs....
Educational Attainment:
()
Higher than the County average and basically mirrors numbers from Alabama at large....
Decatur Alabama Precinct Results:
So how did the heavily African-American precincts of Decatur vote in 2016 and 2017?
US Census Tracts:
()
Precinct Results:
()
So, we see roughly a 20% decrease in the Democratic vote in the heaviest African-American precincts of Decatur, which equate to virtually the entire drop in the total Democratic numbers within the City of Decatur....
How did heavily White wealthier precincts within Decatur vote in 2016 and 2017?
Median Household Income by Census Tracts:
()
Here are precinct numbers for Decatur Alabama....
()
So there are four precincts highlighted in Blue, where Doug Jones added votes compared to HRC's '16 numbers....
Several precincts stand out.... Precinct #17 (TC Almon Rec Center) is an overwhelmingly White precinct, with an MHI of almost $73k/yr where Dems expanded their total vote numbers 44% between '16 and '17 (20% HRC- 75% DJT) to (38% Jones- 59% Moore).
It's still the most Republican precinct in the City, but damn those margin swings make the +20% HRC margin swings in places like the Upper-Income White 'Burbs of Chattanooga, Knoxville, and various places in Texas, look like child's play.
Float down to precinct # 10 (Decatur Baptist Church), overwhelmingly White with an MHI of some $ 70k /Yr (25-71% Trump), (44-54% Moore)....
Now lest anyone thinking I'm obsessed with how Upper-Middle Class White 'Bamans voted in 2017, head on over to Precinct # 16 (Oak Park Baptist Church)....
The MHI here is only about $ 40k/ Yr (23-72% Trump) suddenly goes (44-52% Moore)....
So what does this all mean? In Northern Alabama, at least in the largest City in Morgan County, we saw a Universal swing among White voters towards Doug Jones, regardless of social and economic class, with major gains in raw votes among Upper-Income and Working-Class White precincts alike....
This is certainly not insignificant, as I stated earlier, it would be virtually impossible for Doug Jones to win, without bringing these voters back home, especially in an Ancestral Democratic part of Alabama.
Ok... enough talk about Decatur, what the hell happened in the rest of the County?
Let's look at the 2nd largest City in the County, Hartselle (Pop 14.4k)
Overwhelmingly White (93% vs 4% African-American), fairly wealthy part of the County (MHI $ 51.4k/Yr), 33% have a College Degree, 24% of the population works in manufacturing, higher than normal population of occupations in items such as Engineering...
So the problem here is that the two precincts also include a bunch of surrounding rural areas, so it doesn't give us a complete picture compared to US Census Data...
()
Now let's take a look at the wealthiest City within Morgan County....
Priceville---- MHI $ 79.2k/Yr, 93% White, 42% with a College or two year degree, occupations and industries have strong correlations with professional occupations and manufacturing industries....
()
We have similar issues as with Hartselle in that you have these surrounding rural areas that are included within municipal election precinct boundaries, so swings within the City itself are likely much larger than suggested by the Precinct results.
Last stop... Rural areas (42% of the County Vote)....
So the term rural gets a bit tricky, since after staring at precinct maps and Census tract data for a few hours, I can tell you there is at least one precinct and probably a second that technically are more likely "Exurban in Nature" where Doug Jones gained a decent chunk of Trump voters, but hell trying to segregate these wasn't the main focus of the project.
Important take-aways from Rural precincts.... Roy Moore saw roughly a 45% decrease in total Republican Vote compared to the 2016 General Election, within the most overwhelmingly Republican Part of the County (42% of total County Vote), meanwhile it looks like the Jones campaign was able to get just about every last Democrat out to vote in just about all of these rural precincts (!!!), which is an impressive organizing endeavor in and of itself.
The Jones campaign was running like this was General Election turnout campaign in Alabama, and the Moore campaign was sitting there with their thumbs up their derrieres thinking name recognition and Special Election turnout levels would be enough to get the job done (This was even before the sexual assault allegations hit).
Now there is one rural precinct that was eliminated (Ebenezzer Volunteer Fire Department) and consolidated with the Morgan County election precinct (So ignore the data for those two---- I'm already aware of that and it doesn't change much other than just the total vote, margins, and % numbers for those two precincts between '16 and '17).
()
Anyways, hope all of y'alls appreciate the work I did on this, took me a couple hours to pull this all together, and now that the election has been certified, I would much rather spend my time dissecting the results of the US-Senate election in Alabama than all this other wrangling that has been dominating this thread for well over a month now.
()
As I posted elsewhere prior to the election, Doug Jones uphill road to victory would be likely reliant not just on heavy African-American turnout, depressed turnout among White Evangelicals in rural areas, flipping White Middle-Class voters in the larger Cities and Suburbs of the State, but also performing well in Northern Alabama (Not just Huntsville) and regaining a good chunk of the Al Gore 2000 vote from Ancestral Democrats in the old TVA "New Deal" part of Alabama.
If we look at the US Presidential election results for Morgan County from 2000 to 2016, as well as the 2012 Supreme Court Race, we see that Doug Jones actually hit the numbers he needed within the County.
()
Although the larger Metro Areas and College Communities got a disproportionate amount of attention from the Media and Pundits alike, when you look at places like Morgan County (Pop 120k), or Calhoun County (Pop 120k) which I covered earlier, these votes all add up and it is all fine and dandy to run up the numbers in places like Metro Birmingham, Mobile, Huntsville, the Black Belt, but you'll run out of steam if you get killed by insane margins in places like this.
Before we start going into the precinct results in greater detail, let's review the demographic profile of the County:
Race/Ethnicity:
()
These numbers get even starker once you break them down by Age:
()
Median Household Income Relative to Alabama:
()
So doing really well compared to most parts of the State in terms of household Income....
()
Heavily dependent on Manufacturing....
()
and lower rate of educational attainment than Alabama as a whole....
So, what does the precinct level data show from Morgan County???
Let's start with the % of votes by Place within the County in 2016 and 2017:
()
()
So we see the largest City of Decatur going from a 30-32% vote share between '16 and '17, rural areas holding steady at 42% of the County Vote Share, minor changes in Hartselle and Priceville, and the provisional and absentee vote going down dramatically (Likely predominately voters in Decatur).
Now, here are the total vote numbers by place in '16/'17:
()
()
Here is a graphical format that shows the swings and percentages among communities in the County:
()
So the obvious thing that jumps out here:
1.) Decatur the largest single community within the County swung hard Democrat between 2016 and 2017 going from (39-57 Trump) to (56-43 Jones) for a 32% vote swing....
2.) The total Democratic vote numbers increased in all communities within the County (Other than Decatur, which we will get back to shortly), even in rural areas, meaning that you had a not insignificant number of Trump > Jones voters.
3.) The Republican Vote completely collapsed between '16 and '17, regardless of the impact of Trump > Jones voters (We'll come back to that one as well).
Now let's take a look at demographic data briefly from the largest City in the County before breaking down the precinct results from the City:
Decatur, Alabama:
Pop 56k....
Pop by Race/Ethnicity:
()
Household Income by place Decatur and Morgan County:
()
Not nearly as well off as most other parts of the County...
Workforce by Industry:
()
Slightly lower rate of manufacturing than the County as a whole, slightly higher rates of construction, as well as retail and service sector jobs....
Educational Attainment:
()
Higher than the County average and basically mirrors numbers from Alabama at large....
Decatur Alabama Precinct Results:
So how did the heavily African-American precincts of Decatur vote in 2016 and 2017?
US Census Tracts:
()
Precinct Results:
()
So, we see roughly a 20% decrease in the Democratic vote in the heaviest African-American precincts of Decatur, which equate to virtually the entire drop in the total Democratic numbers within the City of Decatur....
How did heavily White wealthier precincts within Decatur vote in 2016 and 2017?
Median Household Income by Census Tracts:
()
Here are precinct numbers for Decatur Alabama....
()
So there are four precincts highlighted in Blue, where Doug Jones added votes compared to HRC's '16 numbers....
Several precincts stand out.... Precinct #17 (TC Almon Rec Center) is an overwhelmingly White precinct, with an MHI of almost $73k/yr where Dems expanded their total vote numbers 44% between '16 and '17 (20% HRC- 75% DJT) to (38% Jones- 59% Moore).
It's still the most Republican precinct in the City, but damn those margin swings make the +20% HRC margin swings in places like the Upper-Income White 'Burbs of Chattanooga, Knoxville, and various places in Texas, look like child's play.
Float down to precinct # 10 (Decatur Baptist Church), overwhelmingly White with an MHI of some $ 70k /Yr (25-71% Trump), (44-54% Moore)....
Now lest anyone thinking I'm obsessed with how Upper-Middle Class White 'Bamans voted in 2017, head on over to Precinct # 16 (Oak Park Baptist Church)....
The MHI here is only about $ 40k/ Yr (23-72% Trump) suddenly goes (44-52% Moore)....
So what does this all mean? In Northern Alabama, at least in the largest City in Morgan County, we saw a Universal swing among White voters towards Doug Jones, regardless of social and economic class, with major gains in raw votes among Upper-Income and Working-Class White precincts alike....
This is certainly not insignificant, as I stated earlier, it would be virtually impossible for Doug Jones to win, without bringing these voters back home, especially in an Ancestral Democratic part of Alabama.
Ok... enough talk about Decatur, what the hell happened in the rest of the County?
Let's look at the 2nd largest City in the County, Hartselle (Pop 14.4k)
Overwhelmingly White (93% vs 4% African-American), fairly wealthy part of the County (MHI $ 51.4k/Yr), 33% have a College Degree, 24% of the population works in manufacturing, higher than normal population of occupations in items such as Engineering...
So the problem here is that the two precincts also include a bunch of surrounding rural areas, so it doesn't give us a complete picture compared to US Census Data...
()
Now let's take a look at the wealthiest City within Morgan County....
Priceville---- MHI $ 79.2k/Yr, 93% White, 42% with a College or two year degree, occupations and industries have strong correlations with professional occupations and manufacturing industries....
()
We have similar issues as with Hartselle in that you have these surrounding rural areas that are included within municipal election precinct boundaries, so swings within the City itself are likely much larger than suggested by the Precinct results.
Last stop... Rural areas (42% of the County Vote)....
So the term rural gets a bit tricky, since after staring at precinct maps and Census tract data for a few hours, I can tell you there is at least one precinct and probably a second that technically are more likely "Exurban in Nature" where Doug Jones gained a decent chunk of Trump voters, but hell trying to segregate these wasn't the main focus of the project.
Important take-aways from Rural precincts.... Roy Moore saw roughly a 45% decrease in total Republican Vote compared to the 2016 General Election, within the most overwhelmingly Republican Part of the County (42% of total County Vote), meanwhile it looks like the Jones campaign was able to get just about every last Democrat out to vote in just about all of these rural precincts (!!!), which is an impressive organizing endeavor in and of itself.
The Jones campaign was running like this was General Election turnout campaign in Alabama, and the Moore campaign was sitting there with their thumbs up their derrieres thinking name recognition and Special Election turnout levels would be enough to get the job done (This was even before the sexual assault allegations hit).
Now there is one rural precinct that was eliminated (Ebenezzer Volunteer Fire Department) and consolidated with the Morgan County election precinct (So ignore the data for those two---- I'm already aware of that and it doesn't change much other than just the total vote, margins, and % numbers for those two precincts between '16 and '17).
()
Anyways, hope all of y'alls appreciate the work I did on this, took me a couple hours to pull this all together, and now that the election has been certified, I would much rather spend my time dissecting the results of the US-Senate election in Alabama than all this other wrangling that has been dominating this thread for well over a month now.
Title: Re: NOVA GREEN's Election Analysis Thread
Post by: NOVA Green on April 01, 2018, 07:53:59 PM
This is great does anyone have a shift map of the alabama senate race? or have a link to it on atlas I can't find it I know someone added it
Although this might not be the exact link you are looking for, I think Former President Griff has done a significant amount of research and maps on this election, as well as perhaps of few of our our esteemed Atlas posters from the Southlands....
But yeah, if you want to look at Alabama 2017 US-SEN County level Swing Maps, I think there were some appetizers that Fmr President Griff gave us shortly before the election as what a potentially winning Dem County map might potentially look like in 'Bama, which I believe was generally pretty close to mark if my "old man memory" is correct... :)
https://uselectionatlas.org/FORUM/index.php?topic=279603.msg5964813#msg5964813
Title: Re: NOVA GREEN's Election Analysis Thread
Post by: NOVA Green on April 01, 2018, 08:12:57 PM
So I decided to spend a little bit of time looking at precinct level data for the Allegheny County portion of the district to see what if anything it might tell us about the upcoming Special Election....
For starters, here is overall how the CD-18 section of the County voted in US PRES elections between 2008 and 2016.
Thanks to Oryxslayer for posting the data from '08 a few pages back!!!
()
So apologies for restating the obvious to many of us, but the historically Democratic Parts of the district are not actually located within Allegheny County, which has actually been gradually shifting slightly towards the Democratic Party over the past decade, even as Washington and Greene Counties have been swinging hard Republican.
Where are the voters located within South Allegheny CD-18?
Because there are so many municipal jurisdictions in this heavily suburban/exurban area, and diffuse concentration of voters, I had to consolidate places with less than 3% into the "Other" category, but at least include over 80% of the voters into discrete subcategories....
()
So in order of voting population:
1.) Mt Lebanon--- 12.7%
2.) Bethel Park- 12.0%
3.) Moon- 8.1%
4.) Upper St Clair--- 7.6%
5.) Scott--- 5.4%
6.) S. Fayette- 5.1%
7.) Whitehall--- 4.9%
8.) South Park-- 4.6%
9.) Elizabeth Twp--- 4.4%
10.) N. Fayette--- 4.2%
11.) Robinson--- 4.2%
12.) Jefferson HL--- 3.9%
13.) Pleasant HL--- 3.0%
14.) Collier--- 3.0%
We'll be getting back to some of these places in more detail shortly....
How did these places vote in the 2016 Presidential Election?
()
Now let's take a look at these same places in the 2012 Presidential Election....
()
NOW---- Where and what were the swings within South Allegheny (CD-18) between 2012 and 2016???
()
So, interestingly enough pretty much almost all of the larger population centers within the County swung against Donald Trump with roughly 20% swings in Mt Lebanon and Upton St Clair....
Now, as we have seen before even in areas that swung +20% Dem between '12 and '16, there is still further room for collapse, meaning that considering Trump's decreased approval ratings over the past year, it is entirely plausible that we could see even more significant swings towards a local Centrist Dem candidate in some of these suburban/exurban South Allegheny political jurisdictions....
Ok--- time to dig a bit further into the weeds of South Allegheny CD-18 and check out some of the Social Demographics for various communities within the district....
1.) Mount Lebanon Township---- Pop 33k--- MHI $ 76.0k/Yr--- 91% White--- 68% Degree > HS---
2016 Pres (61-34 D)
Occupation sectors heavily concentrated in Professional and Management....
()
Needless to say, we will likely see extremely high turnout here on Tuesday, as well as likely increased swings beyond the 2016 (61-34 D) numbers from the 2012 (53-46 D) numbers.
2.) Bethel Park--- Pop 32.3k--- MHI $ 69.3k/Yr--- 95% White--- 53% Degree > HS 2016 (43-52 R)
()
This is obviously a must win and must win by +10% City for Lamb, since if recent polls of the CD are to believed Trump is sitting at only about 50% Fav ratings (+3-4%), it's places like this where his support likely slumped more so than in other areas....
3.) Moon Township--- Pop 24.6k--- MHI $ 67.2k/Yr--- 89% White--- 53% Degree > HS, 2016---
(43-53 R)
Occupations...
()
So despite the household income and educational attainment similar to Bethel Park, is a bit more Blue Collar/ Pink Collar, with a much smaller percentage of workers concentrated in the "Knowledge and Professional sectors"
Similar to Bethel Park, this is a place where Lamb needs to win by at least high single digits
4.) Upper St Clair Township--- Pop 19.3k--- MHI $ 106.3k/Yr--- 90% White--- 74% Degree > HS--- 2016 (46-50 R)
This was only one of two places in South Allegheny (CD-18) that swung 20% towards HRC between '12 and '16, although it was still a (46-49 R) jurisdiction in 2016....
Occupations....
()
Needless to say there is a disproportionate amount of Upper Middle Class voters here in what appears to be more a "Country Club Republican" part of the County....
We'll see how this area votes after Tuesday, but if the results we have seen from NoVa to Alabama in similar districts in Special Elections recreate themselves in the "Rust Belt", I wouldn't be surprised to see this Township flip hard against Trump....
5. Scott Township--- Pop 17.0k--- MHI $ 61.4k/ Yr--- 82% White, 11% Asian--- 53% Degree > HS.... 2016 (52-44 D)
Occupations:
()
So this one is a bit interesting, in that although it didn't have the dramatic swings towards HRC that Mt Lebanon and Upper St Clair did, but yet it is fairly highly educated with a relatively large Asian-American population, and yet moderately low MHI numbers, and one of the only Obama 2012 places within Allegheny CD-18....
Not sure how much swing is left in the '17 Special election, but would imagine a 60-40 Lamb margin would be my target numbers here....
6.) South Fayette Township--- Pop 14.7k--- MHI $ 78.9k--- 90% White/ 7% Asian--- 54% > HS Degree... 2016 (44-52 R)
Occupations....
()
Ok.... suspect I'm starting to run out of space on the character count for a post, but I think we're starting to get the picture that a good chunk of the voting population of the County are actually Suburban/Exurban Pittsburgh voters, like some of our well known local experts on SW PA have been stating....
So which parts of South Allegheny (CD-18) swung towards Trump compared to 2012?
1.) Elizabeth Township (+11 'Pub swing '12 to '16)--- Pop 13.3k--- MHI $ 59.7k--- 98% White--- 36% Degree > HS
Now this is a pretty old district in terms of age compared to the Allegheny CD section of the County, right over the border from Westmoreland County, and a bit removed from Metro Pittsburgh, so in some ways I would suspect the demographics more closely resemble parts of Greene and Washington County, than most of Southern Allegheny....
2.) We saw a few other marginal swings towards Trump compared to Romney '12 'Pub percentages in Jefferson Hills Township, North Fayette, and South Park Township, but interestingly enough there was only a 1% increase on the 'Pub voting percentage between '12 and '16 in these three places, meaning that although there were swings, it was mainly as a result of defections towards 3rd Party Candidates.
To finish: I don't know what if anything all of this means in the context of an extremely unusual special election in a district Trump won by + 20%.
What I do know is that the trends in the South Allegheny County portion of the district are not at all favorable towards Trump, and considering that 43% of the CD-18 vote is cast here will likely be the make or break moment for Lamb....
Like Pittsburgh Steel and some other knowledgeable posters have been saying this district isn't nearly as "rural" as is being present by the MSM on all Media outlets....
I almost spat out my coffee this morning listening to a media pundit talking talking about how the "Democratic suburbs of Pittsburgh" might flip this district....
Still, in order for Lamb to win this district it will require both a significant swing towards the Dem in South Allegheny (That is increasingly shifting Dem in the "Age of Trump"), combined with recovering enough Ancestral Dem voters in Washington and Greene Counties that as recently as 2008 were only narrowly won by McCain by the sliver of a hair off of my neckbeard.
Title: Re: NOVA GREEN's Election Analysis Thread
Post by: NOVA Green on April 01, 2018, 08:20:06 PM
Now that we have the election results available, excepting a small number of provisional and military ballots, I pulled some comparative and historical data for the South Allegheny portion of CD-18, to follow up on a preceding post that I made prior to the election....
https://uselectionatlas.org/FORUM/index.php?topic=281457.msg6102019#msg6102019
Although the subject of to what extent Ancestral Democrats and Obama > Romney > Trump Democrats returning home to vote for Lamb is an important question in its own right, as well as potential implications for the future in both PA elections, as well as elsewhere in the country, the massive shifts towards the Democratic Party in the Pittsburgh suburbs has equally important potential implications.
Republicans are absolutely correct if they are terrified about what happened in CD-18, especially within the local context of Pennsylvania politics.
These are Republican leaning suburbs that for the most part have resisted significant swings towards the Democratic Party, unlike many similar communities elsewhere over the past 10+ years.
There are a ton of similar communities elsewhere within the Pittsburgh suburbs, which means if we see similar patterns in the 2018 and 2020 General Elections has profound implications within PA politics.
Let's look at how "South Allegheny" voted as a whole between 2008 and 2017....
()
As we can see, generally the 'Burbs of South Allegheny vote considerably to the Right of PA, as well as Allegheny county as a whole, although we did see the gap narrow considerably in the 2016 in both the US PRES and US SEN race.
Let's look at the data from another perspective...
()
Here we can see that generally between '08 and '16, South Allegheny roughly voted 10% more Republican than PA as a whole, especially in Presidential Races where it voted 12-15% more 'Pub than PA as a whole in '08 and '12.
This is part of the reason why I say that although the South Pittsburgh 'Burbs have potentially been gradually trending Dem, until the Special election in CD-18 we had yet to see a real breakthrough Dem moment, outside of a handful of Communities.
As I stated earlier PA Republicans have a major issue on their hands if this pattern is replicated in 2018 and 2020 here, and in similar parts of the Pittsburgh 'Burbs.
()
Time to get into the meat of the matter (Or Veggie Protein options if that is one's preference)....
How did the various communities in South Allegheny Vote in 2017, and how did they swing compared to the 2016 GE PRES?
()
()
The most striking thing here is how extensive the Democratic victory in South Allegheny was, only losing 2/14 largest Townships/Municipalities (Elizabeth & Jefferson Hills), and a swing from 15-20% compared to the '16 Pres GE results everywhere, except Elizabeth Township and only a 14% Dem swing in Upper St Clair.
Much of the MSM and Atlas coverage has been focused on Mt Lebanon, but the reality is that it is only very recently that it has become anything approaching a "Democratic Stronghold", as I posted a reply on this thread earlier regarding which areas to watch closely on Election Night, and it only accounts for a relative sliver of South Allegheny and CD-18, so is perhaps much less typical of Suburban Pittsburgh than many of these other communities.
Ok... let's roll with some charts and stats of elections results by place within South Allegheny from '08 to '16....
2016 PRES Results by Place Graph...
()
2016 PRES results by Place Chart
()
Even in 2016 where South Allegheny shifted DEM, Clinton only won 3/14 of the largest places with Mt Lebanon standing out, as well as an acceptable performance in Scott Township, throw in a narrow victory in Whitehall and the "Other Category".
2016 PA SEN by Place Charts & Graphs....
()
()
2014 PA GOV by Place Charts & Graphs...
()
()
2012 PA PRES South Allegheny Charts & Graphs:
()
()
2012 PA South Allegheny SEN Charts & Graphs:
()
()
2010 PA South Allegheny SEN Charts & Graphs:
()
()
()
2010 PA South Allegheny GOV Charts and Graphs:
()
()
2008 PA South Allegheny Charts & Graphs:
()
()
Massive raw data dump here and still need to take some time to digest and pull up and publish the Political and Social Demographics of the various communities to mine whatever potential past, current, and future implications have to say.
Thinking my next move should examine the question to what extent high Base Democratic turnout vs Republican turnout might have potentially changed the results, similar to some of my analysis of precinct level returns from the Alabama Special elections results, where it appears that a mixture of high Dem turnout in certain places, combined with low Pub turnout in other places, and throw in a decent chunk of Republican > Dem crossover voters in Upper Incomes suburbs contributed to Doug Jones win in Alabama....
On the surface it does NOT appear that a turnout variable was a significant contribution to Lamb's win in PA CD-18, but rather a massive swing among Republican leaning voters in the Pittsburgh suburbs of South Allegheny combined with even larger swings among Ancestral Dem voters in Washington and Greene Counties (Westmoreland is still a place I have not examined in any significant detail)....
Part of the reason why I think this election is particularly significant is that unlike many other special elections it was a relatively high turnout election closer to a Midterm level Turnouts as opposed to many other recent Special Elections, where there might be a decent argument to be made that Dem Base voters turned out in much higher numbers than usual....
The story that we are seeing from the Pittsburgh suburbs appear to tell an entirely different story....
Title: Re: NOVA GREEN's Election Analysis Thread
Post by: NOVA Green on April 01, 2018, 08:23:58 PM
To summarize the dump of election data by place for South Allegheny between 2008 and 2017 that I posted last night, here is a chart that I coded by color to present a more accessible visual of +/- Dem Margins that reinforces the point that I have been making regarding the historically Republican nature of these communities within the past ten years....
()
So, I took a little bit of time to pull up some of the key demographic stats for these various communities within South Allegheny for some of the common variables that have been associated with National Presidential election results from 2008 > 2016.
These include items such as Median Household Income, Race/Ethnicity/Age/Educational Attainment, so see if this helps explain or provide insights into changing voting alignments and swings at a larger level throughout PA, and with possible implications elsewhere within the Region.
()
Certain things make sense within the context of the current Trump ascendancy within the Republican Party....
1.) Upper St Clair, the wealthiest and most educated "municipality" went from being the most Republican stronghold within the district up until 2016 when Trump was on the ballot, where he only won by 3.5% (But still it went heavily 'Pub for US Senate) to being a +10% Dem CD with typically high voter turnout.
Interestingly enough it also has the highest % of school children (<18 Yrs) and this is the type of community where voters can easily swing based upon educational funding and quality type policy issues and perceptions.
2.) Mount Lebanon is an interesting recent development as a "Democratic Stronghold", since although it shares in common with Upper St Clair a high level of Educational Attainment, actually only ranks 4th in MHI within the largest places in the District, and age and ethnicity actually track relatively close to South Allegheny at large. It does have a higher % than average of school age students, and is obviously much more closely proximate to Pittsburgh, so perhaps has less of the "City/Suburban" type issue than some other places within the district?
Perhaps one of our local residents can elucidate us on why this area has been a relatively solid Dem constituency since '08?
3.) Bethel Park--- Looks a bit older and a bit more Anglo, but in terms of MHI, Educational Attainment is still solidly Upper Middle Class, and this is first major election where it has voted Democrat since before '08.
4.) Moon Township--- Really similar to Bethel Park demographically and politically, with both virtually voting in tandem with the exception of the '14 PA GOV race, and slightly lower swings towards Lamb than Bethel (Trump effect?). Only major demographic difference is that Moon Township is less Anglo than Bethel fwiw.
5.) Scott Township---- One of a handful of "Middle Class" 'Burbs here with an MHI of only $61k/Yr, but is only 82% Anglo with an older than average population and relatively high educational attainment levels.
One of the few consistent Democrat voting communities here, with the exception of '12 PA SEN and '10 PA GOV.
6.) South Fayette--- Wealthier and more educated than many places within South Allegheny, and actually a bit younger than most of the other places referenced above.
One of the larger flips within South Allegheny never having voted Dem for any of the races covered and by +21% Swing.
7.) Whitehall Borough------ The lowest income municipality of the 14 largest places within South Allegheny. One of the older places within the County and with a lower than average level of educational attainment.
Politically, it's one of only a handful of communities that Obama almost won in '08, and was actually one of the more Democratic parts of So Allegheny in '12 PA SEN and '14 PA GOV, and actually flipped and voted DEM for HRC in '16 after having voted for McCain and Romney previously.
Ancestral retired Democrats????
8.) South Park Twp---- Whiter, Younger, solidly Middle Class and lower levels of educational attainment than most of the top 14 communities.
One of Obama's best communities in South Allegheny in '08, and one of a handful of places the '12 Dem Sen and '14 Dem Gov candidates won here....
Interestingly enough was one of Lamb's worst Top 14 places within SoAlleg....
9.) Elizabeth Township---- Sure the Pub had a homefield advantage here as Lamb did in Mt Lebanon, but you are basically looking at the Whitest, Oldest, and least educated community within the Top 14 of SoAlleg.
Still, the interesting thing about Elizabeth Township is how far it swung Republican, even as other parts of the district were swinging marginally Democrat.... Basically we are right on the edge of the Westmoreland County line and perhaps there is an ancestral Anti-Pittsburgh thing going on, without the Ancestral Dem thing in parts of Washington and Greene Counties (IDK????)
I can roll through a few more using the charts provided above, and we see Robinson Township swinging hard (Educated, Upper Middle Class, Higher than avg % of Non-Anglos for the District), but then we roll into Jefferson Hills Borough, which on the surface is very similar to Robinson, except it is 96% Anglo vs 88 % Anglo, which was the only real difference that stood out to me based upon Demographics....
Now we go the Pleasant Hills Borough, which is pretty much the oldest and Whitest place here, next to Elizabeth and Whitehall, and we see one of the largest swings towards the Dem candidate of almost anywhere in the County, where the last time it voted Dem was in '12 narrowly for the US SEN!!!!
So y'all can put that in your pipe and smoke it, since I've been doing a stream of consciousness as I have been running the Demographics by Community against historical election results, so I don't have any firm conclusions about what all of this means without delving deeper into precinct level detail and Census Data....
What I suspect might well be the case is that:
1.) Senior Citizens (65+) that tend to vote regularly swung hard towards Lamb because of the perception that the Affordable Care Act and Government Entitlement Programs that benefit Seniors are under attack by the Republican Congress.
(Ancestral Democrats)
2.) Upper and Middle Class College Educated voters in the 'Burbs of Pittsburgh are starting to swing heavily, and not just in the most heavily educated places within the CD (Upper St Clair and Mt Lebanon).
3.) In general "Soft Trump" voters within even Lean 'Pub areas in Metro 'Burbs are starting to shop around, since the whole "Anti-Bush" style of Republicanism portraying a classical isolationist and protectionist ideal is being rubbed raw as the Emperor is exposed as having no clothes, and instead of focusing on keeping decent paying jobs in America and avoiding foreign engagements overseas, is basically looking like your "Old Skool 'Pub Pres", where Robin Hood means "robbing the hood", tax cuts for everyone, means "tax cuts for the rich", bringing jobs back to America means "Same old Same old and whatever manufacturing jobs come back pay 25-50% of the wages they did 20 years ago", where "protecting our borders" means sending Americas sons and daughters born of Immigrant parents back home to a land they never knew, except through the stories of their parents and grandparents.
Regardless of some minor amount of hyperbole on my last point, I do believe that in the eyes of many Trump voters, including some Millennials that I know, they did not intend to vote for the current policies and direction of the country, regardless of how much they disliked HRC and thought that maybe, just maybe Trump would be a different type of Republican than they had seen in decades.
()
So, I took a little bit of time to pull up some of the key demographic stats for these various communities within South Allegheny for some of the common variables that have been associated with National Presidential election results from 2008 > 2016.
These include items such as Median Household Income, Race/Ethnicity/Age/Educational Attainment, so see if this helps explain or provide insights into changing voting alignments and swings at a larger level throughout PA, and with possible implications elsewhere within the Region.
()
Certain things make sense within the context of the current Trump ascendancy within the Republican Party....
1.) Upper St Clair, the wealthiest and most educated "municipality" went from being the most Republican stronghold within the district up until 2016 when Trump was on the ballot, where he only won by 3.5% (But still it went heavily 'Pub for US Senate) to being a +10% Dem CD with typically high voter turnout.
Interestingly enough it also has the highest % of school children (<18 Yrs) and this is the type of community where voters can easily swing based upon educational funding and quality type policy issues and perceptions.
2.) Mount Lebanon is an interesting recent development as a "Democratic Stronghold", since although it shares in common with Upper St Clair a high level of Educational Attainment, actually only ranks 4th in MHI within the largest places in the District, and age and ethnicity actually track relatively close to South Allegheny at large. It does have a higher % than average of school age students, and is obviously much more closely proximate to Pittsburgh, so perhaps has less of the "City/Suburban" type issue than some other places within the district?
Perhaps one of our local residents can elucidate us on why this area has been a relatively solid Dem constituency since '08?
3.) Bethel Park--- Looks a bit older and a bit more Anglo, but in terms of MHI, Educational Attainment is still solidly Upper Middle Class, and this is first major election where it has voted Democrat since before '08.
4.) Moon Township--- Really similar to Bethel Park demographically and politically, with both virtually voting in tandem with the exception of the '14 PA GOV race, and slightly lower swings towards Lamb than Bethel (Trump effect?). Only major demographic difference is that Moon Township is less Anglo than Bethel fwiw.
5.) Scott Township---- One of a handful of "Middle Class" 'Burbs here with an MHI of only $61k/Yr, but is only 82% Anglo with an older than average population and relatively high educational attainment levels.
One of the few consistent Democrat voting communities here, with the exception of '12 PA SEN and '10 PA GOV.
6.) South Fayette--- Wealthier and more educated than many places within South Allegheny, and actually a bit younger than most of the other places referenced above.
One of the larger flips within South Allegheny never having voted Dem for any of the races covered and by +21% Swing.
7.) Whitehall Borough------ The lowest income municipality of the 14 largest places within South Allegheny. One of the older places within the County and with a lower than average level of educational attainment.
Politically, it's one of only a handful of communities that Obama almost won in '08, and was actually one of the more Democratic parts of So Allegheny in '12 PA SEN and '14 PA GOV, and actually flipped and voted DEM for HRC in '16 after having voted for McCain and Romney previously.
Ancestral retired Democrats????
8.) South Park Twp---- Whiter, Younger, solidly Middle Class and lower levels of educational attainment than most of the top 14 communities.
One of Obama's best communities in South Allegheny in '08, and one of a handful of places the '12 Dem Sen and '14 Dem Gov candidates won here....
Interestingly enough was one of Lamb's worst Top 14 places within SoAlleg....
9.) Elizabeth Township---- Sure the Pub had a homefield advantage here as Lamb did in Mt Lebanon, but you are basically looking at the Whitest, Oldest, and least educated community within the Top 14 of SoAlleg.
Still, the interesting thing about Elizabeth Township is how far it swung Republican, even as other parts of the district were swinging marginally Democrat.... Basically we are right on the edge of the Westmoreland County line and perhaps there is an ancestral Anti-Pittsburgh thing going on, without the Ancestral Dem thing in parts of Washington and Greene Counties (IDK????)
I can roll through a few more using the charts provided above, and we see Robinson Township swinging hard (Educated, Upper Middle Class, Higher than avg % of Non-Anglos for the District), but then we roll into Jefferson Hills Borough, which on the surface is very similar to Robinson, except it is 96% Anglo vs 88 % Anglo, which was the only real difference that stood out to me based upon Demographics....
Now we go the Pleasant Hills Borough, which is pretty much the oldest and Whitest place here, next to Elizabeth and Whitehall, and we see one of the largest swings towards the Dem candidate of almost anywhere in the County, where the last time it voted Dem was in '12 narrowly for the US SEN!!!!
So y'all can put that in your pipe and smoke it, since I've been doing a stream of consciousness as I have been running the Demographics by Community against historical election results, so I don't have any firm conclusions about what all of this means without delving deeper into precinct level detail and Census Data....
What I suspect might well be the case is that:
1.) Senior Citizens (65+) that tend to vote regularly swung hard towards Lamb because of the perception that the Affordable Care Act and Government Entitlement Programs that benefit Seniors are under attack by the Republican Congress.
(Ancestral Democrats)
2.) Upper and Middle Class College Educated voters in the 'Burbs of Pittsburgh are starting to swing heavily, and not just in the most heavily educated places within the CD (Upper St Clair and Mt Lebanon).
3.) In general "Soft Trump" voters within even Lean 'Pub areas in Metro 'Burbs are starting to shop around, since the whole "Anti-Bush" style of Republicanism portraying a classical isolationist and protectionist ideal is being rubbed raw as the Emperor is exposed as having no clothes, and instead of focusing on keeping decent paying jobs in America and avoiding foreign engagements overseas, is basically looking like your "Old Skool 'Pub Pres", where Robin Hood means "robbing the hood", tax cuts for everyone, means "tax cuts for the rich", bringing jobs back to America means "Same old Same old and whatever manufacturing jobs come back pay 25-50% of the wages they did 20 years ago", where "protecting our borders" means sending Americas sons and daughters born of Immigrant parents back home to a land they never knew, except through the stories of their parents and grandparents.
Regardless of some minor amount of hyperbole on my last point, I do believe that in the eyes of many Trump voters, including some Millennials that I know, they did not intend to vote for the current policies and direction of the country, regardless of how much they disliked HRC and thought that maybe, just maybe Trump would be a different type of Republican than they had seen in decades.
Title: Re: NOVA GREEN's Election Analysis Thread
Post by: NOVA Green on April 01, 2018, 08:25:42 PM
Now I've posted more detailed level election results for South Allegheny a few weeks back here, as well as summarizing some of the data and adding in Demographic data by place in a follow-up post...
https://uselectionatlas.org/FORUM/index.php?topic=281457.2550
https://uselectionatlas.org/FORUM/index.php?topic=281457.2550
Time to take a look at what the data shows for South Allegheny when it comes to the more thorny question of the question of Democratic and Republican base turnout versus swings from Trump '16 > Lamb '18 crossover voters.
This question is perhaps a bit more difficult than some of the data I posted based upon detailed precinct and municipal analysis from the 2017 Alabama US Senate election, where for example I pulled up multiple places where there was clearly a massive flip among Trump '16 > Jones '17 voters in many places throughout the State.... (See link below for example on some interesting items in Baldwin County)
https://uselectionatlas.org/FORUM/index.php?topic=279603.375
OK---- let's look at the overall Total Vote in municipalities within South Allegheny in the 2018 Special Election as a % Share of the 2016 Presidential Election Total Vote by Municipality and DEM/REP respective % in 2018 of their 2016 PRES numbers to see what if anything this might tells us of enthusiasm gap vs flip voters....
()
Let's repost the Demographic data chart that I posted previously by Municipality:
()
Let's throw in a graph I posted regarding '16 GE Pres vs '18 CD-18 Swings:
()
What does this data tell us?
1.) The highest turnout was in the two places with the highest level of Educational Attainment (Mount Lebanon and Upper St Clair) which had respectively 74% and 70% turnout levels compared to the 2016 General Election, and the next highest level of Turnout was in Bethel Park and Elizabeth Townships.
If we look at the % of the '18 Democratic vote compared to the '16 GE, we see the Democratic Candidate capturing 87% of the Vote in Mt Lebanon, 86% in Bethel Park, 84% in Upper St Clair, and 81% in Elizabeth Township.
We see the 'Pub nominee capturing 60% of the Trump vote in Mt Lebanon, 59% in Bethel Park, 63% in Upper St Clair, and 65% in Elizabeth Township....
1.) It's pretty clear that in Mt Lebanon there was both a mixture of Democratic Base turnout combined with Cross-Over Trump > Lamb voters (After all his home base community) even within the context of relatively high Republican voter turnout).... Overall margins swings were significantly less than we saw in many of the other largest communities within South Allegheny.
2.) Upper St Clair which is the wealthiest and most educated larger municipality, had one of the lowest swings to Lamb compared to Trump '16 %, and had the 2nd highest % level of Republican voters compared to 'Pub GE Pres numbers.
Although I have no doubt that there were quite a few Trump > Lamb voters here, it does not appear that the Upper-Income Anglo voters here (MHI $106.3k/Yr) were nearly as significant as elsewhere within South Allegheny, despite the fact that this was a + 19% McCain '08 district that in '16 became a + 4% Trump district, and then a 55-45 Dem district in '18 Special Election.
Still, it is worthy of noting that this is first time ever in recent political history that this Community has voted Democrat, and with the exception of 2016 has been the most Republican community within South Allegheny.
3.) Bethel Park---
If we look at the 2018 Special Election results, it's pretty clear here based upon turnout and % of choice, that there was a significant amount of Trump > Lamb crossover voters compared to many other larger municipalities within the district....
If we cross-ref against the other data this appears more like a moderately Middle/ Upper-Middle-Class Community within So Allegheny that is relatively close to the overall Demographic Profile.
4.) Elizabeth----.... Since 2016 has become one of the highest level Republican strongholds within this portion of the County and one of the only 'Pub 18 Municipalities in '18....
We see the lowest differential between Trump '16 and 'Pub '18 numbers, in a high turnout election for both candidates.... Sure it was the 'Pub nominees home town, but still cross-over voters appear much lower here than elsewhere within the district....
5.) Where it appears that we might seem some of the biggest swings are in places such as Jefferson Hills, Pleasant Hills, and Collier.
6.) North Fayette and Robinson are iffier since looking at the overall turnout levels, how much of the swing was a depression of the Republican vote versus voters that swung from Trump '16 to Lamb '18.
7.) Still not so sure about Moon, Scott, South Fayette, and Whitehall regarding the question of Dem/Rep turnout versus Trump > Lamb voters.
Anyways, still looking in more detail at individual precinct results, but wanted to do a first dive into the whole Democratic/Republican Base Turnout question versus Trump voters that swung towards Lamb.
https://uselectionatlas.org/FORUM/index.php?topic=281457.2550
https://uselectionatlas.org/FORUM/index.php?topic=281457.2550
Time to take a look at what the data shows for South Allegheny when it comes to the more thorny question of the question of Democratic and Republican base turnout versus swings from Trump '16 > Lamb '18 crossover voters.
This question is perhaps a bit more difficult than some of the data I posted based upon detailed precinct and municipal analysis from the 2017 Alabama US Senate election, where for example I pulled up multiple places where there was clearly a massive flip among Trump '16 > Jones '17 voters in many places throughout the State.... (See link below for example on some interesting items in Baldwin County)
https://uselectionatlas.org/FORUM/index.php?topic=279603.375
OK---- let's look at the overall Total Vote in municipalities within South Allegheny in the 2018 Special Election as a % Share of the 2016 Presidential Election Total Vote by Municipality and DEM/REP respective % in 2018 of their 2016 PRES numbers to see what if anything this might tells us of enthusiasm gap vs flip voters....
()
Let's repost the Demographic data chart that I posted previously by Municipality:
()
Let's throw in a graph I posted regarding '16 GE Pres vs '18 CD-18 Swings:
()
What does this data tell us?
1.) The highest turnout was in the two places with the highest level of Educational Attainment (Mount Lebanon and Upper St Clair) which had respectively 74% and 70% turnout levels compared to the 2016 General Election, and the next highest level of Turnout was in Bethel Park and Elizabeth Townships.
If we look at the % of the '18 Democratic vote compared to the '16 GE, we see the Democratic Candidate capturing 87% of the Vote in Mt Lebanon, 86% in Bethel Park, 84% in Upper St Clair, and 81% in Elizabeth Township.
We see the 'Pub nominee capturing 60% of the Trump vote in Mt Lebanon, 59% in Bethel Park, 63% in Upper St Clair, and 65% in Elizabeth Township....
1.) It's pretty clear that in Mt Lebanon there was both a mixture of Democratic Base turnout combined with Cross-Over Trump > Lamb voters (After all his home base community) even within the context of relatively high Republican voter turnout).... Overall margins swings were significantly less than we saw in many of the other largest communities within South Allegheny.
2.) Upper St Clair which is the wealthiest and most educated larger municipality, had one of the lowest swings to Lamb compared to Trump '16 %, and had the 2nd highest % level of Republican voters compared to 'Pub GE Pres numbers.
Although I have no doubt that there were quite a few Trump > Lamb voters here, it does not appear that the Upper-Income Anglo voters here (MHI $106.3k/Yr) were nearly as significant as elsewhere within South Allegheny, despite the fact that this was a + 19% McCain '08 district that in '16 became a + 4% Trump district, and then a 55-45 Dem district in '18 Special Election.
Still, it is worthy of noting that this is first time ever in recent political history that this Community has voted Democrat, and with the exception of 2016 has been the most Republican community within South Allegheny.
3.) Bethel Park---
If we look at the 2018 Special Election results, it's pretty clear here based upon turnout and % of choice, that there was a significant amount of Trump > Lamb crossover voters compared to many other larger municipalities within the district....
If we cross-ref against the other data this appears more like a moderately Middle/ Upper-Middle-Class Community within So Allegheny that is relatively close to the overall Demographic Profile.
4.) Elizabeth----.... Since 2016 has become one of the highest level Republican strongholds within this portion of the County and one of the only 'Pub 18 Municipalities in '18....
We see the lowest differential between Trump '16 and 'Pub '18 numbers, in a high turnout election for both candidates.... Sure it was the 'Pub nominees home town, but still cross-over voters appear much lower here than elsewhere within the district....
5.) Where it appears that we might seem some of the biggest swings are in places such as Jefferson Hills, Pleasant Hills, and Collier.
6.) North Fayette and Robinson are iffier since looking at the overall turnout levels, how much of the swing was a depression of the Republican vote versus voters that swung from Trump '16 to Lamb '18.
7.) Still not so sure about Moon, Scott, South Fayette, and Whitehall regarding the question of Dem/Rep turnout versus Trump > Lamb voters.
Anyways, still looking in more detail at individual precinct results, but wanted to do a first dive into the whole Democratic/Republican Base Turnout question versus Trump voters that swung towards Lamb.
Title: Re: NOVA GREEN's Election Analysis Thread
Post by: 100% pro-life no matter what on April 02, 2018, 11:34:14 PM
Is the data available for Tuscaloosa County yet? It might be interesting to compare and contrast it with Lee County, since Tuscaloosa has a far larger population that has nothing to do with the university, but also a large university population.
Title: Re: NOVA GREEN's Election Analysis Thread
Post by: NOVA Green on April 03, 2018, 02:06:43 AM
Is the data available for Tuscaloosa County yet? It might be interesting to compare and contrast it with Lee County, since Tuscaloosa has a far larger population that has nothing to do with the university, but also a large university population.
Extreme Conservative, good to see you around these parts... you are in my Top Ten category for posters from the Southlands when it comes to objective political election data, demographics, and analysis, even though we might frequently not see eye-to-eye on a wide variety of political topics.
No---- I have not yet been able to obtain precinct level data from Tuscaloosa County for the 2017 Alabama Special Election, although it is actually on my "top wanted list" for this election.
Tuscaloosa County is fascinating for a wide variety of reasons, as I'm sure you and many other Atlas observers are well aware....
The Sixth largest County in Alabama, home to arguably the most well known University/College within the State, that although it has a slightly higher % of Brothers and Sisters than the State at Large, is still overwhelmingly White.
Obviously within Tuscaloosa itself you have a fairly educated population, regardless of the U of A student vote, that may or may not have voted within their home Counties during the Winter Break.
Now Tuscallosa itself only accounts for 50% of the County Vote, and meanwhile out in the Eastern section of the County you have Vance, Alabama home to a major Mercedes-Benz Plant....
I referenced the dramatic surge towards Doug Jones in the areas right around the major Honda Plant in Calhoun County in one of my Alabama posts above, obviously we all know that the Huntsville Area has a major Auto Sector component (Which I have thus far bypassed because of their tricky precinct changes between '12 and '16).
I would not be surprised if some of the major swings in Tuscaloosa County actually happened in the Eastern portion of the County, where basically Moderate Republican professionals dumped the Nutjob 'Pub Senate dude, and flipped hard Jones, just like many other educated Upper-income Alabama voters did.....
Still, without access to raw data it is hard to see what exactly happened in Tuscaloosa County.... Obviously one would expect that since Classes were closed for the Season, many Undergrad students voted at home in their parent's precincts, leaving the City of Tuscaloosa itself more of a mixture of "Townies and Gownies" (Profs and Grad Students). but it doesn't sufficiently explain the overall election results, without looking at the other 50% of the County, where even if most of the U of A students were gone, would logically mean that this Democratic leaning City would have a much smaller voter share compared to the County compared to a normal General Election....
Anyone want to anonymously send me a link or file of precinct data from Tuscaloosa County, will be happy to review and ad to the mix... ;)
Title: Re: NOVA GREEN's Election Analysis Thread
Post by: Gustaf on April 03, 2018, 07:16:41 AM
Fivethirtyeight finally did this analysis that I've been waiting for someone to do. Thought it might be interesting to see how it measures up with your more granular analysis:
https://fivethirtyeight.com/features/be-skeptical-of-anyone-who-tells-you-they-know-how-democrats-can-win-in-november/ (https://fivethirtyeight.com/features/be-skeptical-of-anyone-who-tells-you-they-know-how-democrats-can-win-in-november/)
https://fivethirtyeight.com/features/be-skeptical-of-anyone-who-tells-you-they-know-how-democrats-can-win-in-november/ (https://fivethirtyeight.com/features/be-skeptical-of-anyone-who-tells-you-they-know-how-democrats-can-win-in-november/)
Title: Re: NOVA GREEN's Election Analysis Thread
Post by: NOVA Green on April 07, 2018, 06:50:11 PM
As Richard Nixon used to famously say when talking to his key advisers regarding a wide range of Policy Issues from Vietnam, to the Civil Rights Movement transitioning to Northern States, Economic Policy, etc:
"How Will it Play in Peoria"????
https://en.wikipedia.org/wiki/Will_it_play_in_Peoria%3F
Although Richard Nixon was talking about Peoria, Illinois and not Peoria, Arizona, it is perhaps a fitting barometer of the 8th Congressional District of Arizona, where Peoria represents almost 25% of the Vote Share of the district, and essentially will provide a key test of Trump's ability to keep the Republican Party brand intact within a fast growing Exurban City within the Sun Belt, where in theory Trump's American Nativist and Hardline stance on immigration should be a winning proposition.....
Let's start with taking a look at the relative vote share by Community within AZ-08.
()
So as we see the vote share within the Congressional District is roughly as follows:
Peoria- 23%
Glendale- 17%
Surprise- 16.5%
Phoenix- 11%
Goodyear- 9%
UNINC-OTHER- 8%
Sun City- 7%
Sun City West- 4%
Others- 5 %
Why do I provide such significance to Peoria within CD-08, compared to other communities within the District, other than just the raw percentage of the vote coming from this "City"?
Basically any roadmap for Democratic victory within CD-08 will by necessity involve exceeding Democratic Maricopa County Sheriff candidate Paul Penzone's numbers in a district where Trump ally "Sheriff Joe Arpaio" won by 16,000 votes ( +5% Rep), while Trump won it by 70k votes (+ 20.7% Rep).
There are a huge number of Trump > Penzone cross-over voters that traditionally vote Republican, that any Democratic Candidate will need to win in this hardcore Rock-Ribbed 'Pub Suburban/Exurban Phoenix district.
Here's a chart of the '16 Sheriff Results by Place within CD-08.
()
Let's look at the '16 Presidential Results by Place within CD-08:
()
Now, to put this all within the larger context, we have not only the largest voting bank within the District, but additionally the place with almost the highest percentage of Trump > DEM Sheriff cross-over voters in 2016, other than some Upper-Income parts of Phoenix which I'll get to later !!!!
What else makes Peoria particularly significant when it comes to CD-08?
It generally mirrors the overall Demographics of the District.
AZ-CD08: Race & Ethnicity:
()
Peoria AZ: Race & Ethnicity:
()
Arizona CD-08: Household Income by Place:
()
Arizona CD-08: Education by Place:
()
Ok---- we have now established the Peoria is really perhaps the key place to watch in CD-08 when it comes to electoral margins.
Peoria Election Results 2012 PRES and 2016 GENERAL:
()
So what we see here is again how reliably Republican Peoria is, even in the 2016 Presidential Elections, with the local County elections for Sheriff being the only real case of a major deviation from recent voting history.
Now, although I haven't compiled the numbers for other Maricopa County downballot races, it does appear that in places like Peoria there was not only a major rejection of "Sheriff Joe" running under the Republican banner, but also to a significant extent local elected County offices from County Attorney, to County Recorder, to County School Superintendent even in solidly Republican precincts in Maricopa County.
It is potentially an early warning sign that Anglo Middle-Class Exurban voters are starting to reject their Maricopa County Republican Party Machine at a local level, and might well move on up the Food Chain in 2018.
Maybe it is, maybe it isn't, but many of these voters went Democratic in essentially a nationalized election (County Sheriff) for the first time in their voting histories in a Metro Area where in theory the whole "Anti-Immigrant" shtick used be a shoe-in for any Republican Candidate running for office.
Glendale, Arizona:
In theory, Glendale should be the closest potential thing to a Democratic stronghold in the event of a massive 2018 Democratic Wave election.
It has a huge 17% of CD-08 votes, Trump "only" won by 12.5% of the Vote, and the Democratic Candidate for Sheriff captured a whopping 52% of the Vote against Arpaio.
The reality is that CD-08 was basically designed to take to most Democratic and Latino portions of Glendale and pack them into the district in the South, and essentially left the 2/3 of the City with the most traditionally Republican voters "Up North" as a safety insurance policy.
So although overall Glendale was only (45-47 Trump) in 2016, the 25% of the Population outside of CD-08 was (59-33 Clinton).
The 80% of Glendale remaining within the district incorporates a mix of Working-Class / Lower Middle-Class communities in the Southern precincts that tend to be heavily Anglo with a decent Latino Population, to rolling North to heavily Upper Middle-Class Anglo precincts in the far Northern part of the City.
Here is a Map of Glendale Arizona shaded by % of Latinos within the Population....
()
So for anyone not used to looking at these types of maps, basically what you are looking at with the darkest shading are heavily Latino precincts, not located within Arizona CD-08, and the part of Glendale you see North of the Giant dividing line, includes some precincts in "South Central" Glendale that might be around 25 % Latino.
Here is a Map shaded by Median Household Income for Glendale that shows that the heavily Upper-Income parts of the City reside in the Northern Part of the City.
()
Here is a Glendale precinct map that shows the overall Trump > Clinton margins by Precinct:
()
Note there are three precinct cut off the Map (Butler +9 HRC, Caron +4 DJT, Glencroft +6 HRC), but I think y'all get the picture that this should normally be considered solidly Republican Suburban Country under a normal "Generic Republican" Universe.
Now, we are looking a potential scenario where places like the Gerrymandered most 'Pub section of Glendale is looking like a potential Democratic stronghold within CD-08 in November '18, in a similar fashion like Mt. Lebanon, Pennsylvania went from being a Lean Republican suburb of Pittsburgh to an overwhelmingly Democratic stronghold within barely over 10 years....
Ok--- that might be a bit of a stretch, but still the South Pittsburgh 'Burbs of PA-18 mostly resisted the major Dem swing in Upper-Income Anglo 'Burbs in the '16 GE (+ 5% '12 >'16 Dem Pres Swing) and then came swinging hard with massive whacks off the baseball bat....
Anyways--- have tons of more data from the 142 precincts that make up AZ CD-08, but unlike PA CD-18, there are no Ancestral Democratic voting blocks that are available to come back to the fold to add to major swings in Suburban/Exurban Republican areas for a win.
Instead what we have is a new emerging Democratic Coalition in the most Republican Part of Metro Phoenix without any real historical Democratic Base (HRC won 12/142 Precincts in '16), with the overwhelming majority of the others won by Trump with Double Digits, and the only election in recent memory where a Democrat has won a huge chunk of real estate throughout the district was running as County Sheriff against a guy under multiple legal clouds, who cost the taxpayers of Maricopa County Hundreds of Millions of Dollars because of his shady law enforcement techniques.
My suspicion is that for a Democrat to win this seat it would take something like the following from the places within the district:
1.) Peoria (52-48 D)
2.) Glendale (59-41 D)
3.) Surprise (51-49 D)
3.) Phoenix (53-47 D)
4.) Goodyear (61-39 D)
5.) Sun City (44-56 R)
6.) Sun City West (41-59 R)
7.) Uninc Others (48-52 R)
To Be Continued.....
Title: Re: NOVA GREEN's Election Analysis Thread
Post by: NOVA Green on April 07, 2018, 06:51:36 PM
Realized that maybe I jumped the gun a bit when it came to my original post regarding CD-08 and started jumping into the weeds a bit perhaps without providing the topline election numbers by community within CD-08....
Here is a Chart that I made for how the various places within AZ CD-08 voted from '12 to '16 for key races...
()
So, what does this data tell us within the context of the AZ-08 Special Election and potentially the AZ '18 GE???
First thing obviously to look at would be how the Democratic and Republican US SEN candidates performed in the 2012 AZ-SEN race...
The reason why I consider that significant is that here you had a Republican Senator significantly under-perform the US-PRES candidate in 2012 but still win by (56-39 R), so if Dems might potentially flip the district in a Special Election in '18, the Dem candidate would need to perform exceptionally well in places where Flake was relatively weak.
We can also look at the 2012 vs 2016 Presidential Election numbers as a potential data point in terms of areas where one might expect to see larger swings towards the Dem in the '18 AZ CD-08 Special Election....
()
So interestingly enough despite the "Latino Surge" of 2016, it appears that at least within the most heavily Latino and Working-Class part of the Congressional district, Millennial Latinos shifted heavily towards 3rd Party Candidates if we look at El Mirage for example.
Now, it does get confusing in the Suburbs and Exurbs of Phoenix when trying to separate the Anglo/Latino Vote, without going deep into the weeds of precinct results, but the immediate data does seem to suggest that the '12 to '16 Dem Pres Swings were more predominant in more heavily Anglo precincts within the district.
This is actually both positive and negative data when it comes to a Democrat running within the district for a "low turnout" Special Election....
The negative side is obvious, is that even with a "surge" of Latino Millennials voting in '16 for 3rd Party Pres candidates, will they actually turn out to vote in a 2018 Special Election?
The positive side is that there appears to have been a significant shift among Middle and Upper-Middle Class Anglos towards a Democratic Candidate in a big way for the first time ever in many of these communities....
()
Key question here, is to what extent was the rejection of "Sheriff Joe" considered to be more of an issue of corrupt local top cop and an Anti-Latino bigot to boot, vs a rejection among many McCain/Flake/Romney traditional 'Pub voters that gave Trump a pass in '16, that having voted Democrat for the first time in quite a few years, might continue to follow that path into the 2018 General Election?
I don't pretend to have the answers to any of these questions, and hopefully will have some time to go through the various communities that consist of CD-08 in greater detail before the upcoming special election.
Still, hopefully there is some food for thought here....
Title: Re: NOVA GREEN's Election Analysis Thread
Post by: NOVA Green on April 07, 2018, 06:52:37 PM
Decided to shift focus slightly here, since it appears that we will have some updated results of Early Vote totals by Partisan Registration and Arizona State legislative districts to potentially provide us with some means of trying to interpret early voting results as they roll in from the Great State of Arizona...
People might want to file away or bookmark some of this data as a reference point over the next couple weeks....
So here is a chart I made that shows the current Early Voting numbers by legislative districts compared against the 2016 General Election and 2014 General Election that gives us an idea of the relative vote share by State Districts.
()
I'll try to keep updating this semi-regularly as we get updated results for EV numbers by district.
Now, the key caveat here is that the numbers for '14 and '16 are the total vote share by district (Including Election Day ballots, as well as all Early Voting ballots) and obviously the numbers on the left are constantly under development.
Although I don't pretend to be a fluent expert on the dynamics of Early Voting in Arizona, but in Oregon that has long been an all Vote-by-Mail State, we typically tend to see a massive surge of ballots show up in the last week on an election, and these frequently tend to come from younger and Middle-Aged voters, Cities/Suburbs, and tend to skew a bit more Democratic than some of the earliest wave of mail-in-ballots.
Thus far we are seeing one major trend in CD-08 vote share that stands out, which is the extremely lopsided numbers from State District 22, which has always been the largest "Vote Bank" in the district, and looking at an off-year election in 2014 tends to have an even heavier weight.
If we look at the next largest district State District 21 we see a relatively stable performance compared to '14 and '16.
Elsewhere thus far we are seeing significant drops in most other State Districts, with the exception of State District 13.
The largest % drop of EV in AZ-08 compared to total Vote Share by State District, is in District 20.
This is perhaps not surprising, considering that those districts that vote early early by mail, versus those areas with much higher rates of "Same Day" turnout are going to experience some variances, but it is still important to continue to observe going forward.
Now, how did these Arizona State Districts vote between 2012 and 2016 for some key races?
()
So what does this matrix that I generated tell us (If anything) about voting patterns in CD-08?
1.) Look closely at the 2012 US-SEN results by district to see how well a "New Republican Congressional Candidate" performed by State District in CD-08 in what was generally considered to be a favorable Republican election year.
A.) We see really only three Republican State District strongholds (Districts 1, 15, and 22) and then some relative marginal numbers in Districts 13,20, & 21.
B.)Some of the margins are explained by a 3rd Party Libertarian Candidate that performed quite well, but Trump still outperformed Flake in most of the State Districts as a % of Total 'Pub Votes, with the exception of State District 15, 29 & 30.
2.) The closest thing we have to a winning Democratic playbook in CD-08 would be the 2016 Maricopa County Sheriff Election where Sheriff Joe won by 5% within the CD.
A.) We see a massive breakthough in House District 20 (Most of Glendale within the District), that was only +9 Flake in '12, and also where there was a significant drop in 'Pub support between the '12 and '16 Presidential Elections, but basically where even in the '16 Pres and '12 Sen election, only 52% voted 'Pub.
B.) District 21 is starting to look like increasingly marginal 'Pub territory looking at the '12 US SEN results, Trump only capturing 54% in '16, and Sheriff Joe only winning in a squeaker here....
As I previously stated, it's all about Peoria, Arizona and considering that Sun City didn't swing hard Dem on Sheriff, means that the part of the district in Peoria and Surprise likely played a key role here.
3.) Ok--- thus far we have seen much higher EV numbers come out of the most heavily Republican State Senate District within CD-08 (District 22) and also District 15 (One of the only other overwhelmingly 'Pub Districts), and much lower EV turnout among the handful of Dem leaning districts, and also within the key District 20, where Dem's need to win big in Glendale to make this anything close to a horserace).
4. Now, what do the early voting numbers tell us from CD-08 compared against previous margins from recent key elections?
()
So, interestingly enough the total Registered Republican vs Registered Democratic vote margins appear to be weakest in the most Republican Districts within CD-08.
The places where Republican vs Democratic EV turnout compared to previous elections is highest compared to total votes are in the most heavily Democratic or potentially Democratic leaning areas (Where there is much higher % of Same Day voting)....
There could be multiple explanations for the significant decline of Republican EV turnout in the most heavily Republican portions of the County, and certainly one could possibly be the explanation that I suggested earlier in this thread, that one can't automatically assume that Independents tend to Lean Democratic in this particular district, which could obviously perhaps explain why there appears to have been a bit of a collapse in the most heavily 'Pub Arizona districts, but that might well be a bit of a stretch.
At this point it's looking like the 'Pub numbers in State Districts (1,15, and 22) are starting to look fairly weak, district 20 (Must win heavily Dem area) strong, plus some relatively favorable early indicators from district 21 (Must flip Dem area)....
To be Updated and Continued accordingly, but still we now have some additional data points to watch the EV in "Real Time" without knowing how Dems/Reps/Indies will breakdown in final voting numbers within the district....
Title: Re: NOVA GREEN's Election Analysis Thread
Post by: NOVA Green on April 07, 2018, 07:04:18 PM
So shots out to nclib, in a metaphorical hip-hop style, not like I just got off a homemade shooting range with one of son in laws that like to occasionally like to do some target practice on some family land outside of City limits....
If we look at the "Flagship State Colleges and Universities" (Although there are some legitimate arguments as to to merits of inclusion when it comes to a few states in our Great Union, we need to roll with the classic definitions to sake of common discussion, rather than wrangle in the weeds about the merits of Academic Inclusion into this most coveted list).
We see the following results:
()
Now if we were to roll it into an Atlas map by % of support for the winning candidate we see something like the following:
(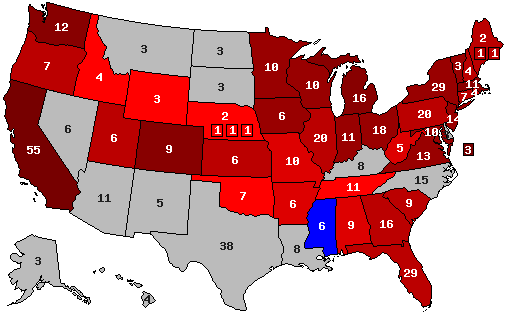 )
)
Naturally, one must assume that UT-Austin would vote more Democratic than the County at large, same gig with NM, AZ.
Certainly Chapel Hill NC would fit into that equation as well....
The initial numbers I ran on Grand Forks, ND appear that Trump won the City by significant numbers...
SD haven't played around with yet, let alone the great unknown of Pacific Northwest City of Fairbanks Alaska...
Very curious about exact numbers from Lexington Kentucky, but once again this will be solid Clinton Country, more curious about the margins myself....
Missoula is pretty much a given heavy Dem City, and generally one of the most Democratic Cities in Montana, but again more interested in the margins and overall percentages than the result.
Pretty amazing map if you look at it, especially considering that those graduating from the public universities with the highest status and prestige can pretty much roll out of college and get a job anywhere, and essentially represent the next generation of leaders in the worlds of business/commerce, math/science, political leadership, arts/culture, are voting so overwhelmingly against the party of Trump....
I still remember the days as a Gen Xer where the College Students were so much more conservative than the "townies" during the days of the "Reagan Youth", including working class precincts like mine....
If we look at the "Flagship State Colleges and Universities" (Although there are some legitimate arguments as to to merits of inclusion when it comes to a few states in our Great Union, we need to roll with the classic definitions to sake of common discussion, rather than wrangle in the weeds about the merits of Academic Inclusion into this most coveted list).
We see the following results:
()
Now if we were to roll it into an Atlas map by % of support for the winning candidate we see something like the following:
(
Naturally, one must assume that UT-Austin would vote more Democratic than the County at large, same gig with NM, AZ.
Certainly Chapel Hill NC would fit into that equation as well....
The initial numbers I ran on Grand Forks, ND appear that Trump won the City by significant numbers...
SD haven't played around with yet, let alone the great unknown of Pacific Northwest City of Fairbanks Alaska...
Very curious about exact numbers from Lexington Kentucky, but once again this will be solid Clinton Country, more curious about the margins myself....
Missoula is pretty much a given heavy Dem City, and generally one of the most Democratic Cities in Montana, but again more interested in the margins and overall percentages than the result.
Pretty amazing map if you look at it, especially considering that those graduating from the public universities with the highest status and prestige can pretty much roll out of college and get a job anywhere, and essentially represent the next generation of leaders in the worlds of business/commerce, math/science, political leadership, arts/culture, are voting so overwhelmingly against the party of Trump....
I still remember the days as a Gen Xer where the College Students were so much more conservative than the "townies" during the days of the "Reagan Youth", including working class precincts like mine....
Title: Re: NOVA GREEN's Election Analysis Thread
Post by: NOVA Green on April 07, 2018, 07:07:00 PM
Ok--- time to update the Flagship University City map and numbers....
(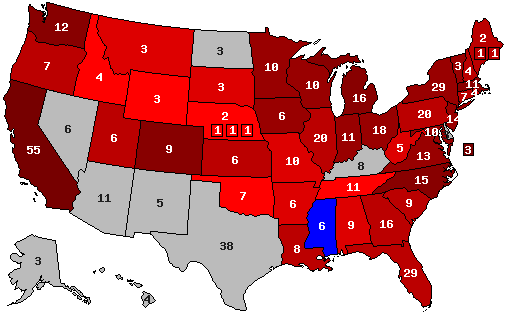 )
)
()
So, also I decided to add in the 3rd Party combined vote by Flagship University City to see the extent to which voters in these college towns defected from the two major party candidates....
In five states thus far the combined 3rd Party vote exceeded the Republican candidates vote totals (Berkeley, California--- Amherst, Massachusetts---- Salt Lake City, Utah---- Burlington, Vermont---- Seattle, Washington)
Additionally, I coded Gray Flagship University Cities where the combined 3rd Party vote exceeded 10% (Although I accidentally skipped Morgantown WV).... the list would look something like the following:
Fayetteville, Arkansas--- 10.1%
Moscow, Idaho--- 20.8% (!!!)
Lincoln, Nebraska-- 10.4%
Eugene, Oregon--- 11.6%
Morgantown, West Virginia--- 11.1%
Laramie, Wyoming--- 17.3% (!!!)
Now Moscow and Laramie are likely partially explainable because they are part of two states that are at the heart of the "Mormon Belt", so a decent chunk of the 3rd Party defections went to McMullin, as well as your typical Johnson/Stein voters seen throughout most states.....
(
()
So, also I decided to add in the 3rd Party combined vote by Flagship University City to see the extent to which voters in these college towns defected from the two major party candidates....
In five states thus far the combined 3rd Party vote exceeded the Republican candidates vote totals (Berkeley, California--- Amherst, Massachusetts---- Salt Lake City, Utah---- Burlington, Vermont---- Seattle, Washington)
Additionally, I coded Gray Flagship University Cities where the combined 3rd Party vote exceeded 10% (Although I accidentally skipped Morgantown WV).... the list would look something like the following:
Fayetteville, Arkansas--- 10.1%
Moscow, Idaho--- 20.8% (!!!)
Lincoln, Nebraska-- 10.4%
Eugene, Oregon--- 11.6%
Morgantown, West Virginia--- 11.1%
Laramie, Wyoming--- 17.3% (!!!)
Now Moscow and Laramie are likely partially explainable because they are part of two states that are at the heart of the "Mormon Belt", so a decent chunk of the 3rd Party defections went to McMullin, as well as your typical Johnson/Stein voters seen throughout most states.....
Title: Re: NOVA GREEN's Election Analysis Thread
Post by: NOVA Green on April 07, 2018, 07:58:41 PM
So, started a thread initially looking at how Division 1-A Football Communities voted in 2016, initially as a concept to see how Millennial Voters in College communities voted, that was later expanded towards a more detailed analysis of on-campus / off-campus College Undergrad precincts....
https://uselectionatlas.org/FORUM/index.php?topic=273504.150
PAC-12 North:
PAC-12 South:
Big 10- East Campus/ Off Campus:
Big 10-West Campus / Off-Campus:
Anyways, tons more data on the thread and in my files in what was essentially an incomplete project that still provides some insights into how younger Millennial College Students voted in 2016 in most of the Public Universities that tend to be on the prestige radar because they happen to have a top tier College Ball Team.....
https://uselectionatlas.org/FORUM/index.php?topic=273504.150
PAC-12 North:
So here are the basic numbers for PAC-12 North University Precincts splitting the "Dorm Vote" from the off-campus precincts that are overwhelmingly Undergrad College students...
()
()
Needless to say, these numbers do not bode well for the Republican Party within the West Coast, when Trump actually placed 3rd behind combined third party candidates, and in some instances actually placed 3rd or 4th....
I haven't really had a chance to fully digest the data yet on this Thanksgiving Day, but at least wanted to throw the graphs out and complete the PAC-12 North data drilled down to the University Precinct level.
()
()
Needless to say, these numbers do not bode well for the Republican Party within the West Coast, when Trump actually placed 3rd behind combined third party candidates, and in some instances actually placed 3rd or 4th....
I haven't really had a chance to fully digest the data yet on this Thanksgiving Day, but at least wanted to throw the graphs out and complete the PAC-12 North data drilled down to the University Precinct level.
PAC-12 South:
So, let's look at how the PAC-12 South Undergrad University Precincts voted in 2016 in a Graphical Format:
Dorm/Campus Vote:
()
Off-Campus Undergrad Vote:
()
So what meaning is there if anything delving into the weeds of Undergrad voting patterns within the PAC 12?
1.) Obviously the results from the University of Utah stand out dramatically, especially looking at the compare/contrast of the Campus Precincts vs Off-Campus Under-Grad Precincts, especially when looking at the numbers from Arizona State University off-campus precincts....
*** Maybe *** this is just an issue of which precincts were included in the "off-campus" precinct category, but even when looking at a much cleaner precinct level like the "Dorm Vote" as ASU, it's looking clearly as the most Republican student voters of the entire PAC-12 (24% Trump)....
The numbers are fairly consistent between ASU Campus and Off-Campus Precincts, which appears that this not a random outlier nor variable....
We can all certainly understand why the University of Utah results stand out, but what is even more interesting is why the ASU results stand out so much?
2.) One must certainly wonder UCLA and USC stand out as the most Democratic Universities within the Conference, even compared against traditionally Liberal / Democratic Universities like University of Colorado- Boulder and University of Arizona- Tucson???
What has changed in the composition of the student population over the past few decades that has shifted these number so dramatically?
3.) Regardless of these numbers, the trends to not appear well for Republicans in the Southwest, considering these are generally overwhelmingly Anglo Universities, where the student base appears to be voting very differently from the behavior of their parents....
PAC 12 Undergrad Consolidated:
Big 12 Campus/ Off Campus:
Dorm/Campus Vote:
()
Off-Campus Undergrad Vote:
()
So what meaning is there if anything delving into the weeds of Undergrad voting patterns within the PAC 12?
1.) Obviously the results from the University of Utah stand out dramatically, especially looking at the compare/contrast of the Campus Precincts vs Off-Campus Under-Grad Precincts, especially when looking at the numbers from Arizona State University off-campus precincts....
*** Maybe *** this is just an issue of which precincts were included in the "off-campus" precinct category, but even when looking at a much cleaner precinct level like the "Dorm Vote" as ASU, it's looking clearly as the most Republican student voters of the entire PAC-12 (24% Trump)....
The numbers are fairly consistent between ASU Campus and Off-Campus Precincts, which appears that this not a random outlier nor variable....
We can all certainly understand why the University of Utah results stand out, but what is even more interesting is why the ASU results stand out so much?
2.) One must certainly wonder UCLA and USC stand out as the most Democratic Universities within the Conference, even compared against traditionally Liberal / Democratic Universities like University of Colorado- Boulder and University of Arizona- Tucson???
What has changed in the composition of the student population over the past few decades that has shifted these number so dramatically?
3.) Regardless of these numbers, the trends to not appear well for Republicans in the Southwest, considering these are generally overwhelmingly Anglo Universities, where the student base appears to be voting very differently from the behavior of their parents....
PAC 12 Undergrad Consolidated:
So here are the overall number for the PAC-12 Student precincts including Campus and Off-Campus Student Votes...
()
()
Big 12 Campus/ Off Campus:
Ok--- Big 12 Conference summarized in a Graphical / Chart Format:
Big 12 Conference Cities--- 2016 Votes by Party:
()
Ok--- already summarized in a previous graph, but decided to modify the chart to name the City rather than the University, since these are the total vote numbers from the Municipality in which the Campus is located.
Big 12 Conference: Dorm Votes from precincts heavily based "On Campus":
()
Comments:
1.) Trump appears to have won the "Dorm Vote" at two Universities--- TCU and Texas Tech, which is perhaps not that surprising considering these both have student populations that are more likely to come from backgrounds less receptive towards voting Democrat (Private Christian University, and major Texas Science & Tech school) than many other White/Anglo Millennials in many other parts of Texas, and within the Conference overall.
2.) I was surprised to see Clinton win the Oklahoma State University Dorm Vote, not to mention the margins at KSU, Iowa State University, and Baylor
3.) Obviously the margins at places WVU and University of Oklahoma were much higher than one might have expected, as opposed to UT-Austin and University of Kansas/ Kansas University, where one could have made a reasonable supposition that these would be heavily HRC voters.
Big 12 Conference: Off-Campus Heavily Undergrad Precincts:
()
1.) So here the interesting thing is that HRC appears to have won the "Off-Campus" Undergrad vote in all of these Universities, even TCU and Texas Tech.... Now, tbh "off-campus precinct data" can be a bit trickier in some cases, as I noted in the various posts regarding these two Universities as well as others, so there is a higher potential MOE since sometimes these precincts might include a higher or lower percentage of grad students, and or locals not currently enrolled at the University.
Still, the Undergrad student votes from Texas Tech and TCU appear to be pretty close between the two major party candidates, once one includes the off-campus student population.
2.) The consistency between Campus and Off-Campus results at WVU, UT-Austin, and Oklahoma State University tend to reinforce the overall voting numbers of the Undergrad student voting population.
3.) We do see some significant variances between "Dorm Votes" and "Off-Campus" voters in several off-campus University towns, Iowa State and Kansas State stand-out as skewing quite a bit more Democratic with the "off-campus vote" and University of Oklahoma as skewing much more Republican with the "off-campus vote"....
These results are likely as a result of a mixture of factors, with off-campus undergrad students much more likely to be 20-22 + Years, working part-time jobs in the surrounding "Student Ghetto" communities on the edges of Campus, and mingling in a bit more with the local younger "Townies", many of whom are also working these same types of jobs on the edges of Campus.
Throw in a few Grad Students working in the "Sweatshops of Academia" getting paid crap wages to teach 100-200 level Undergrad Classes as a "Professor", a few townies mingled into the mix, but still these are heavily Undergrad student precincts selected to minimize data contamination.
Consolidated University City/Campus/Off-Campus Chart:
()
1.) So here we see HRC outperforming DJT Trump in every Big 12 City among the student population, with the exception of Fort Worth and possibly Ames, Iowa (Depending upon the Campus vs Off-Campus Undergrad student breakdown).
2.) TCU "Off-Campus" votes are interesting, considering they are actually pretty close to Fort Worth as a whole, despite the University being pretty heavily Anglo, compared to the City at large.... Similarly Texas Tech numbers are interesting, considering the Lubbock has an extremely large Latino population, as well as a decent sized African-American population, but still the University voted much more Democratic than the City as a whole....
3.) Numbers from Waco (Baylor), Manhattan (KSU), Norman ( Univ of Oklahoma) show an extremely sharp contrast between the "Townie Vote" vs the "Gownie Vote" especially considering that we don't have an easy methodology to subtract the University Vote from the City Vote, but still it looks pretty clear that the Student vote flipped Waco TX, Manhattan KS, Stillwater OK, and Norman OK....
4.) Votes from students added to Democratic margins in Morgantown WV, Austin TX, and Lawrence KS, although these Cities would still have voted Democratic by decent numbers regardless of the Undergrad Student Vote....
Big 10- East Campus/ Off Campus:
So, let's summarize the results from the Big 10- East in a graphical format....
Here are the results from the Cities/Towns that comprise the Conference...
()
Here are the results from the Dorm/Campus Vote by University...
()
Here are the results from Off-Campus heavily Undergrad Precincts:
()
So what to make of all this???
1.) Obvious outliar that stands out is Penn State, where 30% of the Undergrad Student population voted Trump....
What was it about this student population that caused it to be so heavily Republican, compared to so many other student populations in the region?
2.) We see Trump achieving over 20% of the vote in 5/7 Big 10-East campuses, but only at MSU did Trump hit 25% (Other than Penn State).
3.) Third Party support appears to be extremely low among University Students here, compared to most PAC-12 and Big-12 University campuses...
4.) At the "Elite" public Universities of Ohio, Indiana, and Michigan it appears that the Undergrad Millennial Student body overwhelmingly rejected the message of Trump, despite the massive swings towards Trump in the "Rust Belt" of the Upper Midwest....
5.) Again, I ask the question did the College kids in Ohio, Michigan, and Pennsylvania cost HRC the 2016 Presidential Election because of lack of turnout, defection to 3rd Party Candidates, and general complacency with a Dem Pres Candidate that was not particularly inspiring that nobody viewed as "The third Obama Term" (Despite the message HRC was trying to roll with).
Big 10-West Campus / Off-Campus:
Big Ten West--- University Precinct Results Completed!!!!
Here are how the Cities of the Big 10- West voted in 2016:
()
Here are how the Dorm/Campus voters of the Big 10- West voted in 2016:
()
Here are how the Off-Campus Undergrad precincts of the Big 10- West voted in 2016:
()
Here are the consolidated Dorm/Campus precincts and Off-Campus precincts of the Big 10-West and how they voted in 2016:
()
I'll let others comment in more detail, as I already made various comments running through the individual University campus communities, but hell at least here is a summary sheet for Christmas Day, for anyone out there that at least vicariously observes the Holiday, as well as something interesting to look at for those who don't celebrate the Holiday, but still want to check out something interesting on Atlas, even on a slow-posting day for the most part. :)
Anyways, tons more data on the thread and in my files in what was essentially an incomplete project that still provides some insights into how younger Millennial College Students voted in 2016 in most of the Public Universities that tend to be on the prestige radar because they happen to have a top tier College Ball Team.....
Title: Re: NOVA GREEN's Election Analysis Thread
Post by: NOVA Green on April 11, 2018, 01:09:50 AM
So, started doing a review of some of the demographics of portions of CD-08 to see what if anything that might indicate.
If we look at the preceding information that I posted the other day, the Legislative District 1 portion of CD-08, with generally Democrats only receiving about 30% of the Vote and Republicans generally hitting 65-70%, with the exception of the '16 Sheriff race where it was 40% Dem and 60% Republican.
What is interesting is that despite it being a reliably Republican predominately Unincorporated part of the County, thus far we aren't seeing the Republican Turnout levels, nor turnout advantage that we might expect (This could still all obviously change.)
So here's a map that shows the borders of this area and some basic demographic information (Race/Ethnicity, Median Household Income, % of population 60+ and % of population with 4+ Yr Degrees.
So here several things jump out immediately.... even though this is a Republican stronghold it really isn't that old compared to many other parts of the district. It is generally Pretty Anglo and Upper Middle-Class by income, with a not especially dramatic level of education compared to what one might expect.
Note that the largest precinct within the district by Population, roughly aligns with the Census Data for a tract with a Median Household Income of $102k/Yr,
Also, although the Census tracts don't break down Occupation in as much detail, here is a chart of the Occupations that include the bulk of this portion of CD08.
So here we see an occupation breakdown that leans heavily White Collar and Professional.
Needless to say, these are exactly the types of suburban voters that a Democrat will need to make significant inroads with in order to win the district, considering relative age, occupation, and incomes.
We did see something similar in heavily Republican suburbs of South Allegheny among these types of voters that predominately resisted the major Democratic suburban swings between '12 and '16, so it is not completely out of the question that this could potentially occur within this portion of CD-08.
I would imagine that the Democratic Candidate would need to keep the Republican down to a +10 to +15 point lead in this portion of the district to have a shot at winning in CD-08.
Arizona Legislative District 4:
This is a relatively small sliver of the voting electorate within CD-08 only accounting for 2-3% of the total district vote, and is one of a only a small handful of consistently Democratic voting areas within the district.
Although we don't have a nice occupational chart, we see the occupational sectors skew much for Lower Middle-Class and Working Class occupations such as Sales, Administrative, Food Service and the like and only about 20% of the workforce employed in more "Professional" type occupations such as Management, Business, Computers, Engineering, etc....
So several things stand out here we have a population that includes a significant bloc of Democratic leaning constituencies since this part of the district is only 55% Anglo (Although likely a much larger share of Registered Voters) and a relatively young voting age demographic (32% of the entire population is 18-39 Years).
The key question for Democrats is will the ease of Vote-by-Mail in Arizona, the increased voter registration activities tied to the election to defeat Sheriff Joe, translate into both high turnout levels in the Special Election, and a high level of Democratic support?
There are plenty of other pockets similar to this scattered throughout CD-08 and Democrats will obviously need every vote they can get here.
Right now we're only seeing this Legislative District represent 1.5% of the total Early Vote, far below the 3% from the '16 GE, and Republicans are leaning 37-39% on the EV ballots cast thus far.
Democrats would likely need to hit 60% here to meet benchmarks, with 58% of the voters having rejected Sheriff Joe in November '16.
Will post more on some of the other Legislative Districts when I get a chance....
Title: Re: NOVA GREEN's Election Analysis Thread
Post by: NOVA Green on April 11, 2018, 01:11:39 AM
Arizona Legislative District 13:
This one is a bit tricky since it encompasses a wide range of Political and Demographic terrain, but it is one of those areas where Democrats will need to perform well to contest CD-08, since not only does it account for 8-9% of the total CD-08 Vote Share, and although it is probably the 4th most Republican Legislative District located within CD-08, Flake only received 54% of the vote here in '12, "Sheriff Joe" only won here by 2% in '16, and Trump received "only" 56% of the Vote here in 2016, and ran a few points below his CD-08 average.
So what does the Census and Demographic data tell us about this section of the district?
Note: Some of the Census Data I needed to amalgamate by various Block Tracts to try to get the best possible data, and there were a few precincts within the CD-08 legislative portion of the district where it was either too labor intensive to get the data, so please don't view this as the definitive statement on the demographics of all the CD-08 portions of this Arizona Legislative district.
So where to start? We see a handful of heavily Anglo and older precincts (Pebble Creek & Wigwam stand out), a couple precincts that are borderline Anglo majority with solidly Middle-Class household income levels, and a relatively younger population (Desert Vista and Rio Paseo stand out here), and then we have relatively exurban precincts (Waddell and Alsup) which is a place where I am least confident of the demographic data, since I needed to try to consolidate among multiple Census tracts from Citrus Grove, to a couple slivers of Glendale, and then some of the Uninc areas surrounding that don't have any type of CDP designation.....
Now, what do the election results by precinct show us in 2016 for the Arizona Legislative District 13 part of CD-08?
So we see 43% of the 2016 Sheriff results come out of just three precincts that voted for Sheriff Joe, versus 7 precincts that voted for the Democratic Candidate.
Pebble Creek, which must be a Senior Only Community (88% 60+ Yrs) and is 93% Anglo voted +26% Trump, +14% Sheriff Joe, but was +37% Romney in '12 (+11% Dem Pres Swing) accounted for 21% of the CD-08 AZ District 13 vote in 2016....
So interestingly enough these Upper Middle-Class Seniors (MHI of $65k/Yr in an overwhelmingly retirement community) appear to have swung more Democratic than Maricopa at large in the Presidential Election, while still backing the Sheriff.
Swing Chart by Precinct:
If we look at Wigwam (80% Anglo, 33% 60+) and 19% of CD-08 sections of AZ-LD 13, we see Trump only winning by 10 Points, but going 54-46% Dem for Sheriff.
So it is not inconceivable that Anglo Seniors in CD-08 might potentially swing increasingly Democrat in a Special Election where the Democratic Candidate has been pressing hard on Health Care related issues, where much of the dramatic support for ACA has been coming from Seniors that are digging it now that they see how it actually works for them, while the 'Pubs tried to kill ACA (Thanks to Senator McCain for their failure).
The other major Republican precinct within the district is Waddell (67-26 Trump), and 20% of the 2016 vote within LD 13 portion of CD-08 and also where I am least confident of the demographic data presented....
Although it's not really an "Old folks precinct" per se by Phoenix standards, I strongly suspect that the Anglo proportion of the voters are much higher than demographic data indicates, and that there's something about Desert Rats that want to live outside of any type of Municipal boundaries to lower their tax burden vs those that prefer to live within communities that provide a range of services from water/sewage/garbage/law enforcement, etc....
I don't really pretend to have an angle on this precinct, and it's a bit harder to read than most others within the district.
What about the rest of the Legislative District???
We don't really see much in the way of Democratic strongholds, Luke Field stands out as the only HRC precinct within the district, but I didn't run the demographic numbers here, but has long been the most Democratic precinct within the district even in 2014 for the Gov Election where the Dem candidate captured 43% of the Vote against the 'Pubs 50.7%.
Desert Vista obviously stands out here considering not only is it the least Anglo precinct that I pulled numbers from (48% Anglo, 31% Latino, 8% Black, 7% Asian), but also has the highest Median Household Income of any precinct surveyed $95k/Yr, AND 35% of the population is 18-39 Years old.
This precinct went 45-47 Trump, but 56-43 Dem for Sheriff, 42-57 Romney (+17% Dem Swing), and 45-52 Flake in '12.
Rio Paseo in theory be more Democratic than it is (43-49 Trump) but 54-46 Dem Sheriff, but still had the Highest Dem swing than any other precinct within this portion of district (+15% Dem Pres '12 > '16).
So, there's quite a bit more data out for this portion of CD-08, but one of the key things to look at since we don't really have much in the way of "Ancestral Democratic" places to look at here, are those places which swung hardest Democrat between '12 and '16.
Here we see a mixture of the greatest swings happening to largely Anglo and Senior precincts (Pebble Creek and Wigwam), and those places with the highest concentration of Ethnic Minorities (Desert Vista and Rio Paseo), even though there are significant differences in MHI and Demographics between these two Communities.
Although I still haven't fully processed all of the data compiled yet for this district, it's pretty clear that there is a potential path for a Dem in CD-08 Legislative District 13 that expands upon the gains among Senior Anglos, while simultaneously achieving high voter turnout within those precincts that are ground zero of the "New Emerging Democratic Coalition" within the 'Burbs of Phoenix.
Title: Re: NOVA GREEN's Election Analysis Thread
Post by: NOVA Green on April 11, 2018, 01:13:13 AM
OK, here are the charts that I was trying to embed in my post yesterday to look at voter turnout by precincts through the April 5th Update (Yes, I know there is a new one out today, but haven't been able to get into updating the spreadsheet yet).
This includes the TOTAL precinct turnout through the 4/5/18 update for precincts where over 48% of the total ballots have been returned to date.
I sorted by % of ballots already received and color coded on the basis of '16 PRES and '16 Sheriff Margins, with the darker shades of Blue being the most Republican in a CD that went + 23 Trump and only + 5 "Sheriff Joe". The white cells in the PRES margins category are for those areas that voted Trump by less than his CD average.
What do these precincts where the highest level of turnout have been thus far in the Special Election share in common?
They are overwhelmingly Elderly, Anglo and fairly heavily Republican as well as concentrated within a relatively small slice of the CD-08 by Population.
The other common denominator is that they did not really experience the significant swings towards the Democratic opponent to Sheriff Joe, that much of the rest of the district did.
This is part of the reason why I consider them relatively inelastic, although it should be noted that Sun City itself (As opposed to Sun City West) is certainly a place where there might be a potential Democratic swing in '18/'20 in AZ.
Still, to follow to the point that I made yesterday, one must wonder to what extent Republicans have essentially cannibalized their EV margins by front-loading these areas. This means that by logical extension, the overall DEM-REP-IND EV % and ultimately TOTAL election results % will look very different than the current Party turnout %. (More on that later in a subsequent post).
Which precincts so far have the lowest turnout levels?
Again tried to use a similar kind of coding system and just focus more on the color shading rather than a staggered margin fancy scaling system and all that.
So surprise, surprise precincts that have the lowest Early Voter Turnout levels to date, also happen to correspond to the most Democratic precincts (In General).
Republicans like to vote early and vote often to counterbalance perceived voting fraud from over-represented ethnic minorities.... (JOKE---- couldn't resist so please no offense my 'Pub friends and family out there).
Ok--- now really for the most part this list tends to correlate much more heavily with precincts with higher proportions of younger, Latino, and working-class populations than many other parts of CD-08.
El Mirage is perhaps the most observable, but as you can see from the list there are similar communities scattered all around the district with places in Goodyear and Surprise showing up heavily on the list, not to mention a couple precincts from Peoria.
So.... Arizona CD-08 is a "Tale of Two Districts" where the Older Anglo SoCal and Midwest retiree Republicans have traditionally been a dominant political force, with several newer generations, including the increasingly Multi-Ethnic Millennial Generation that tends to lean Democratic even here, with the Middling Turnout levels of the "Bridging Generation" being where most likely any election in this district will be decided....
(I did not post the 33% of the precincts that I consider to be in that swing category yet, but I'll give y'all of y'alls a hint to anyone that's been following my posts, it really comes down to how heavily key parts of Glendale and Peoria swing--- that are essentially more of your Middle-Aged and Middle-Class majority Anglo precincts, much more likely to have kids in public schools, registered Independents, and most importantly is where if we are going to see the district flip in a Special Election is where Democrats will turn out in high numbers, Republicans might be more likely to flip, and Indies can swing wildly.)
Something to chew on....
Title: Re: NOVA GREEN's Election Analysis Thread
Post by: NOVA Green on April 22, 2018, 07:14:12 PM
Decided to shift focus slightly here, since it appears that we will have some updated results of Early Vote totals by Partisan Registration and Arizona State legislative districts to potentially provide us with some means of trying to interpret early voting results as they roll in from the Great State of Arizona...
People might want to file away or bookmark some of this data as a reference point over the next couple weeks....
So here is a chart I made that shows the current Early Voting numbers by legislative districts compared against the 2016 General Election and 2014 General Election that gives us an idea of the relative vote share by State Districts.
()
I'll try to keep updating this semi-regularly as we get updated results for EV numbers by district.
Now, the key caveat here is that the numbers for '14 and '16 are the total vote share by district (Including Election Day ballots, as well as all Early Voting ballots) and obviously the numbers on the left are constantly under development.
Although I don't pretend to be a fluent expert on the dynamics of Early Voting in Arizona, but in Oregon that has long been an all Vote-by-Mail State, we typically tend to see a massive surge of ballots show up in the last week on an election, and these frequently tend to come from younger and Middle-Aged voters, Cities/Suburbs, and tend to skew a bit more Democratic than some of the earliest wave of mail-in-ballots.
Thus far we are seeing one major trend in CD-08 vote share that stands out, which is the extremely lopsided numbers from State District 22, which has always been the largest "Vote Bank" in the district, and looking at an off-year election in 2014 tends to have an even heavier weight.
If we look at the next largest district State District 21 we see a relatively stable performance compared to '14 and '16.
Elsewhere thus far we are seeing significant drops in most other State Districts, with the exception of State District 13.
The largest % drop of EV in AZ-08 compared to total Vote Share by State District, is in District 20.
This is perhaps not surprising, considering that those districts that vote early early by mail, versus those areas with much higher rates of "Same Day" turnout are going to experience some variances, but it is still important to continue to observe going forward.
Now, how did these Arizona State Districts vote between 2012 and 2016 for some key races?
()
So what does this matrix that I generated tell us (If anything) about voting patterns in CD-08?
1.) Look closely at the 2012 US-SEN results by district to see how well a "New Republican Congressional Candidate" performed by State District in CD-08 in what was generally considered to be a favorable Republican election year.
A.) We see really only three Republican State District strongholds (Districts 1, 15, and 22) and then some relative marginal numbers in Districts 13,20, & 21.
B.)Some of the margins are explained by a 3rd Party Libertarian Candidate that performed quite well, but Trump still outperformed Flake in most of the State Districts as a % of Total 'Pub Votes, with the exception of State District 15, 29 & 30.
2.) The closest thing we have to a winning Democratic playbook in CD-08 would be the 2016 Maricopa County Sheriff Election where Sheriff Joe won by 5% within the CD.
A.) We see a massive breakthough in House District 20 (Most of Glendale within the District), that was only +9 Flake in '12, and also where there was a significant drop in 'Pub support between the '12 and '16 Presidential Elections, but basically where even in the '16 Pres and '12 Sen election, only 52% voted 'Pub.
B.) District 21 is starting to look like increasingly marginal 'Pub territory looking at the '12 US SEN results, Trump only capturing 54% in '16, and Sheriff Joe only winning in a squeaker here....
As I previously stated, it's all about Peoria, Arizona and considering that Sun City didn't swing hard Dem on Sheriff, means that the part of the district in Peoria and Surprise likely played a key role here.
3.) Ok--- thus far we have seen much higher EV numbers come out of the most heavily Republican State Senate District within CD-08 (District 22) and also District 15 (One of the only other overwhelmingly 'Pub Districts), and much lower EV turnout among the handful of Dem leaning districts, and also within the key District 20, where Dem's need to win big in Glendale to make this anything close to a horserace).
4. Now, what do the early voting numbers tell us from CD-08 compared against previous margins from recent key elections?
()
So, interestingly enough the total Registered Republican vs Registered Democratic vote margins appear to be weakest in the most Republican Districts within CD-08.
The places where Republican vs Democratic EV turnout compared to previous elections is highest compared to total votes are in the most heavily Democratic or potentially Democratic leaning areas (Where there is much higher % of Same Day voting)....
There could be multiple explanations for the significant decline of Republican EV turnout in the most heavily Republican portions of the County, and certainly one could possibly be the explanation that I suggested earlier in this thread, that one can't automatically assume that Independents tend to Lean Democratic in this particular district, which could obviously perhaps explain why there appears to have been a bit of a collapse in the most heavily 'Pub Arizona districts, but that might well be a bit of a stretch.
At this point it's looking like the 'Pub numbers in State Districts (1,15, and 22) are starting to look fairly weak, district 20 (Must win heavily Dem area) strong, plus some relatively favorable early indicators from district 21 (Must flip Dem area)....
To be Updated and Continued accordingly, but still we now have some additional data points to watch the EV in "Real Time" without knowing how Dems/Reps/Indies will breakdown in final voting numbers within the district....
People might want to file away or bookmark some of this data as a reference point over the next couple weeks....
So here is a chart I made that shows the current Early Voting numbers by legislative districts compared against the 2016 General Election and 2014 General Election that gives us an idea of the relative vote share by State Districts.
()
I'll try to keep updating this semi-regularly as we get updated results for EV numbers by district.
Now, the key caveat here is that the numbers for '14 and '16 are the total vote share by district (Including Election Day ballots, as well as all Early Voting ballots) and obviously the numbers on the left are constantly under development.
Although I don't pretend to be a fluent expert on the dynamics of Early Voting in Arizona, but in Oregon that has long been an all Vote-by-Mail State, we typically tend to see a massive surge of ballots show up in the last week on an election, and these frequently tend to come from younger and Middle-Aged voters, Cities/Suburbs, and tend to skew a bit more Democratic than some of the earliest wave of mail-in-ballots.
Thus far we are seeing one major trend in CD-08 vote share that stands out, which is the extremely lopsided numbers from State District 22, which has always been the largest "Vote Bank" in the district, and looking at an off-year election in 2014 tends to have an even heavier weight.
If we look at the next largest district State District 21 we see a relatively stable performance compared to '14 and '16.
Elsewhere thus far we are seeing significant drops in most other State Districts, with the exception of State District 13.
The largest % drop of EV in AZ-08 compared to total Vote Share by State District, is in District 20.
This is perhaps not surprising, considering that those districts that vote early early by mail, versus those areas with much higher rates of "Same Day" turnout are going to experience some variances, but it is still important to continue to observe going forward.
Now, how did these Arizona State Districts vote between 2012 and 2016 for some key races?
()
So what does this matrix that I generated tell us (If anything) about voting patterns in CD-08?
1.) Look closely at the 2012 US-SEN results by district to see how well a "New Republican Congressional Candidate" performed by State District in CD-08 in what was generally considered to be a favorable Republican election year.
A.) We see really only three Republican State District strongholds (Districts 1, 15, and 22) and then some relative marginal numbers in Districts 13,20, & 21.
B.)Some of the margins are explained by a 3rd Party Libertarian Candidate that performed quite well, but Trump still outperformed Flake in most of the State Districts as a % of Total 'Pub Votes, with the exception of State District 15, 29 & 30.
2.) The closest thing we have to a winning Democratic playbook in CD-08 would be the 2016 Maricopa County Sheriff Election where Sheriff Joe won by 5% within the CD.
A.) We see a massive breakthough in House District 20 (Most of Glendale within the District), that was only +9 Flake in '12, and also where there was a significant drop in 'Pub support between the '12 and '16 Presidential Elections, but basically where even in the '16 Pres and '12 Sen election, only 52% voted 'Pub.
B.) District 21 is starting to look like increasingly marginal 'Pub territory looking at the '12 US SEN results, Trump only capturing 54% in '16, and Sheriff Joe only winning in a squeaker here....
As I previously stated, it's all about Peoria, Arizona and considering that Sun City didn't swing hard Dem on Sheriff, means that the part of the district in Peoria and Surprise likely played a key role here.
3.) Ok--- thus far we have seen much higher EV numbers come out of the most heavily Republican State Senate District within CD-08 (District 22) and also District 15 (One of the only other overwhelmingly 'Pub Districts), and much lower EV turnout among the handful of Dem leaning districts, and also within the key District 20, where Dem's need to win big in Glendale to make this anything close to a horserace).
4. Now, what do the early voting numbers tell us from CD-08 compared against previous margins from recent key elections?
()
So, interestingly enough the total Registered Republican vs Registered Democratic vote margins appear to be weakest in the most Republican Districts within CD-08.
The places where Republican vs Democratic EV turnout compared to previous elections is highest compared to total votes are in the most heavily Democratic or potentially Democratic leaning areas (Where there is much higher % of Same Day voting)....
There could be multiple explanations for the significant decline of Republican EV turnout in the most heavily Republican portions of the County, and certainly one could possibly be the explanation that I suggested earlier in this thread, that one can't automatically assume that Independents tend to Lean Democratic in this particular district, which could obviously perhaps explain why there appears to have been a bit of a collapse in the most heavily 'Pub Arizona districts, but that might well be a bit of a stretch.
At this point it's looking like the 'Pub numbers in State Districts (1,15, and 22) are starting to look fairly weak, district 20 (Must win heavily Dem area) strong, plus some relatively favorable early indicators from district 21 (Must flip Dem area)....
To be Updated and Continued accordingly, but still we now have some additional data points to watch the EV in "Real Time" without knowing how Dems/Reps/Indies will breakdown in final voting numbers within the district....
Title: Re: NOVA GREEN's Election Analysis Thread
Post by: NOVA Green on April 22, 2018, 07:16:41 PM
So, started doing a review of some of the demographics of portions of CD-08 to see what if anything that might indicate.
If we look at the preceding information that I posted the other day, the Legislative District 1 portion of CD-08, with generally Democrats only receiving about 30% of the Vote and Republicans generally hitting 65-70%, with the exception of the '16 Sheriff race where it was 40% Dem and 60% Republican.
What is interesting is that despite it being a reliably Republican predominately Unincorporated part of the County, thus far we aren't seeing the Republican Turnout levels, nor turnout advantage that we might expect (This could still all obviously change.)
So here's a map that shows the borders of this area and some basic demographic information (Race/Ethnicity, Median Household Income, % of population 60+ and % of population with 4+ Yr Degrees.
()
So here several things jump out immediately.... even though this is a Republican stronghold it really isn't that old compared to many other parts of the district. It is generally Pretty Anglo and Upper Middle-Class by income, with a not especially dramatic level of education compared to what one might expect.
Note that the largest precinct within the district by Population, roughly aligns with the Census Data for a tract with a Median Household Income of $102k/Yr,
Also, although the Census tracts don't break down Occupation in as much detail, here is a chart of the Occupations that include the bulk of this portion of CD08.
()
So here we see an occupation breakdown that leans heavily White Collar and Professional.
Needless to say, these are exactly the types of suburban voters that a Democrat will need to make significant inroads with in order to win the district, considering relative age, occupation, and incomes.
We did see something similar in heavily Republican suburbs of South Allegheny among these types of voters that predominately resisted the major Democratic suburban swings between '12 and '16, so it is not completely out of the question that this could potentially occur within this portion of CD-08.
I would imagine that the Democratic Candidate would need to keep the Republican down to a +10 to +15 point lead in this portion of the district to have a shot at winning in CD-08.
Arizona Legislative District 4:
This is a relatively small sliver of the voting electorate within CD-08 only accounting for 2-3% of the total district vote, and is one of a only a small handful of consistently Democratic voting areas within the district.
()
Although we don't have a nice occupational chart, we see the occupational sectors skew much for Lower Middle-Class and Working Class occupations such as Sales, Administrative, Food Service and the like and only about 20% of the workforce employed in more "Professional" type occupations such as Management, Business, Computers, Engineering, etc....
So several things stand out here we have a population that includes a significant bloc of Democratic leaning constituencies since this part of the district is only 55% Anglo (Although likely a much larger share of Registered Voters) and a relatively young voting age demographic (32% of the entire population is 18-39 Years).
The key question for Democrats is will the ease of Vote-by-Mail in Arizona, the increased voter registration activities tied to the election to defeat Sheriff Joe, translate into both high turnout levels in the Special Election, and a high level of Democratic support?
There are plenty of other pockets similar to this scattered throughout CD-08 and Democrats will obviously need every vote they can get here.
Right now we're only seeing this Legislative District represent 1.5% of the total Early Vote, far below the 3% from the '16 GE, and Republicans are leaning 37-39% on the EV ballots cast thus far.
Democrats would likely need to hit 60% here to meet benchmarks, with 58% of the voters having rejected Sheriff Joe in November '16.
Will post more on some of the other Legislative Districts when I get a chance....
Title: Re: NOVA GREEN's Election Analysis Thread
Post by: NOVA Green on April 22, 2018, 07:18:07 PM
Arizona Legislative District 13:
This one is a bit tricky since it encompasses a wide range of Political and Demographic terrain, but it is one of those areas where Democrats will need to perform well to contest CD-08, since not only does it account for 8-9% of the total CD-08 Vote Share, and although it is probably the 4th most Republican Legislative District located within CD-08, Flake only received 54% of the vote here in '12, "Sheriff Joe" only won here by 2% in '16, and Trump received "only" 56% of the Vote here in 2016, and ran a few points below his CD-08 average.
So what does the Census and Demographic data tell us about this section of the district?
Note: Some of the Census Data I needed to amalgamate by various Block Tracts to try to get the best possible data, and there were a few precincts within the CD-08 legislative portion of the district where it was either too labor intensive to get the data, so please don't view this as the definitive statement on the demographics of all the CD-08 portions of this Arizona Legislative district.
()
So where to start? We see a handful of heavily Anglo and older precincts (Pebble Creek & Wigwam stand out), a couple precincts that are borderline Anglo majority with solidly Middle-Class household income levels, and a relatively younger population (Desert Vista and Rio Paseo stand out here), and then we have relatively exurban precincts (Waddell and Alsup) which is a place where I am least confident of the demographic data, since I needed to try to consolidate among multiple Census tracts from Citrus Grove, to a couple slivers of Glendale, and then some of the Uninc areas surrounding that don't have any type of CDP designation.....
Now, what do the election results by precinct show us in 2016 for the Arizona Legislative District 13 part of CD-08?
()
So we see 43% of the 2016 Sheriff results come out of just three precincts that voted for Sheriff Joe, versus 7 precincts that voted for the Democratic Candidate.
Pebble Creek, which must be a Senior Only Community (88% 60+ Yrs) and is 93% Anglo voted +26% Trump, +14% Sheriff Joe, but was +37% Romney in '12 (+11% Dem Pres Swing) accounted for 21% of the CD-08 AZ District 13 vote in 2016....
So interestingly enough these Upper Middle-Class Seniors (MHI of $65k/Yr in an overwhelmingly retirement community) appear to have swung more Democratic than Maricopa at large in the Presidential Election, while still backing the Sheriff.
Swing Chart by Precinct:
()
If we look at Wigwam (80% Anglo, 33% 60+) and 19% of CD-08 sections of AZ-LD 13, we see Trump only winning by 10 Points, but going 54-46% Dem for Sheriff.
So it is not inconceivable that Anglo Seniors in CD-08 might potentially swing increasingly Democrat in a Special Election where the Democratic Candidate has been pressing hard on Health Care related issues, where much of the dramatic support for ACA has been coming from Seniors that are digging it now that they see how it actually works for them, while the 'Pubs tried to kill ACA (Thanks to Senator McCain for their failure).
The other major Republican precinct within the district is Waddell (67-26 Trump), and 20% of the 2016 vote within LD 13 portion of CD-08 and also where I am least confident of the demographic data presented....
Although it's not really an "Old folks precinct" per se by Phoenix standards, I strongly suspect that the Anglo proportion of the voters are much higher than demographic data indicates, and that there's something about Desert Rats that want to live outside of any type of Municipal boundaries to lower their tax burden vs those that prefer to live within communities that provide a range of services from water/sewage/garbage/law enforcement, etc....
I don't really pretend to have an angle on this precinct, and it's a bit harder to read than most others within the district.
What about the rest of the Legislative District???
We don't really see much in the way of Democratic strongholds, Luke Field stands out as the only HRC precinct within the district, but I didn't run the demographic numbers here, but has long been the most Democratic precinct within the district even in 2014 for the Gov Election where the Dem candidate captured 43% of the Vote against the 'Pubs 50.7%.
Desert Vista obviously stands out here considering not only is it the least Anglo precinct that I pulled numbers from (48% Anglo, 31% Latino, 8% Black, 7% Asian), but also has the highest Median Household Income of any precinct surveyed $95k/Yr, AND 35% of the population is 18-39 Years old.
This precinct went 45-47 Trump, but 56-43 Dem for Sheriff, 42-57 Romney (+17% Dem Swing), and 45-52 Flake in '12.
Rio Paseo in theory be more Democratic than it is (43-49 Trump) but 54-46 Dem Sheriff, but still had the Highest Dem swing than any other precinct within this portion of district (+15% Dem Pres '12 > '16).
So, there's quite a bit more data out for this portion of CD-08, but one of the key things to look at since we don't really have much in the way of "Ancestral Democratic" places to look at here, are those places which swung hardest Democrat between '12 and '16.
Here we see a mixture of the greatest swings happening to largely Anglo and Senior precincts (Pebble Creek and Wigwam), and those places with the highest concentration of Ethnic Minorities (Desert Vista and Rio Paseo), even though there are significant differences in MHI and Demographics between these two Communities.
Although I still haven't fully processed all of the data compiled yet for this district, it's pretty clear that there is a potential path for a Dem in CD-08 Legislative District 13 that expands upon the gains among Senior Anglos, while simultaneously achieving high voter turnout within those precincts that are ground zero of the "New Emerging Democratic Coalition" within the 'Burbs of Phoenix.
Title: Re: NOVA GREEN's Election Analysis Thread
Post by: NOVA Green on April 22, 2018, 07:20:43 PM
Arizona LD-15 precincts located within CD-08: Social and Political Geography:
Continuing my series on the political and social demographics of CD-08, it's time to take a look at this district, which basically includes six precincts located within the City of Phoenix and accounts for roughly 6% of the total CD-08 vote in a typical General Election.
()
As we can see from looking at the demographic information by precinct, the fundamental characteristics of this district tend to skew fairly Middle-Aged, with a relatively small Senior population compared to many other parts of the district, Upper Income and Upper Middle-Class, fairly well educated, and a bit more Anglo than the district at large.
Politically, it tends to lean fairly reliably Republican:
2016 Pres: +24 Trump (+6% D Swing)
2012 Pres: +30 Romney
2012 SEN: +24 Flake
However, in the 2016 Maricopa County Sheriff race, it was only 48-52 Republican.
Several obvious points here, is that this is exactly the type of area where a Democratic candidate will need to perform well to make this a competitive election since these are precisely the types of voters that thus far in Maricopa County have been resistant to voting Democratic, even as many similar areas in the Country swung heavily towards HRC in 2016.
Let's take a look at how these six precincts voted in the 2016 General Election, as well as Turnout thus far in the 2018 Special Election, AND the 2012 PRES and SEN races....
()
()
Thus far we see the most Democratic precinct (Julie) with the lowest % of ballots returned to date for LD-15. This was the only precinct here to vote against Sheriff Joe, and where Trump only received 51% of the vote in 2016, and logically a place where one might expect a Democrat to perform fairly well within this election, considering it skews younger with a relatively large Minority component. Here we have the highest % of 3rd Party defections in 2016, with 10% supporting LIB, GRN, WI, etc.... This same precinct mirrors the overall 2012 to 2016 PRES swings within CD-08 LD-15 (+5% D), so is potentially a good composite of the precinct to look at as we move deeper into 2018, although 3rd Party defections likely played a major role in the numbers being much lower for HRC than the overall precinct profile might suggest.
Julie RV: (26 D- 38 R- 34 I)
The next lowest share of turnout is Creedence, which although it is also heavily younger in population, is much more Anglo than Julie, and also fairly Republican, excepting the '16 Sheriff Race. It is slightly less Republican than most of the other precincts in this portion of the LD, and the only place to swing towards Trump in 2016, which was likely mainly a result of 8% of voters defecting to 3rd Party Candidates.
RV: (22 D- 45 R- 31 I)
Now, lets shift focus to a couple other precincts where we are seeing the highest level of Turnout to date within CD-08 LD-15:
Pyramid Peak:
Accounted for 28% of the vote here in 2016, making it the largest precinct by vote share.
The wealthiest precinct within the district as measured by MHI, with a Median Household Income of $ 108k/Yr, 38% of the Population with at least a 4+ Yr College Degree,and also the 2nd largest Asian-American population within this portion of LD-15 (7%)....
Traditionally heavily Republican and current voter turnout is 37% (2nd Highest within LD-15), is also one of two precincts where we saw the greatest PRES swing '12 > '16 (+9.5% Dem).
As I suggested on previous posts on this thread, places where we saw the greatest '12> '16 Dem swings within CD-08, as well as places where we saw the greatest Trump/ Sheriff Joe swings, might well be the types of places where if a Dem will win an election in CD-08.
RV: (22 D- 48 R- 30 I)
Desert Sage:
This precinct is the one where I am least confident in the Demographic profile, because of US Census tract data doesn't cleanly overlap the way it does in the other precincts here.
Still, the basic demographic profile indicates that it has the 2nd lowest Anglo population within LD-15 (72% Anglo) and the highest Asian-American population (11%)....
Looks to be heavily Middle-Class and Middle-Aged voters with an extremely low proportion of the population aged 60+.
The biggest swings between the PRES numbers '12>'16 occurred here, with a +9.8% Dem swing.
Overall voter turnout to date skews towards the Middle Range of Ld-15 to date, AND it was "Sheriff Joe's" 2nd best precinct (+5.3% R).
It was the most Pub precinct in the '14 Governor race, the most Pub precinct in the '12 Pres race and Flake grabbed 63% of the vote in the '12 SEN race.
Really curious about this precinct, (Although honestly I'm always curious about most precincts in the US), because it is a bit unusual for CD-08 in many ways....
RV: (21 D- 48 R- 30 I)
OK--- we have two precincts left to check on with the Socio-Demographic data overlapped with Electoral Data....
Happy Valley:
The most 'Pub precinct in the '16 PRES GE election (30-64 Trump, 46-54 R Sheriff,). Also the 2nd most Pub precinct in '12, and most Pub precinct in the '12 US-Sen race.
The 2nd wealthiest precinct when it comes to Median Household Income ($104k/Yr). The highest % of population aged 60+ Yrs (24%), and the 2nd highest precinct with people that have a 4+ Year College Degree....
We see the highest % Turnout to Date within the LD, considering that it is the oldest is perhaps not surprising.
We also see only a +2.5% D PRES swing between '12 > '16, with only a 6% 3rd Party defection in '16.
Keep watching the turnout here, since it's one of those places where apparently the older Anglos are extremely heavily Republican, AND the upper-income Middle-Aged Anglos are also not especially "swingy" either.
RV: (21 D- 52 R- 26 I)
Lindner:
The last precinct within the district is a weird hybrid, with the Northern half of the precinct looking much more like Julie, and the Southern half appears to be one of those "Senior Only" type Phoenix area suburban places....
The Northern portion of the precinct tends to be much more Latino than the Southern Portion, and although the overall precinct MHI of $66.5k makes it look like more of Middle-Class community, the reality is that once you factor in the Senior Population the data starts to get murkier.
Overall this precinct looks like one of the least "Trump friendly precincts" (57.9% Trump), and one of the lowest '12>'16 Dem swings (+1.6%), but actually the 2nd best precinct for the Dem running against Sheriff Joe.
The key question here is the balance between the Senior Voters to the South and more varied demographic landscape to the North....
RV: (24 D- 44 R- 31 R)
Wish we had more data points to work with when it comes to a competitive Dem race in CD-08, but hey got to work with what we got, right?
To be continued with LD-20 (Must win big for a DEM in CD-08)....
Title: Re: NOVA GREEN's Election Analysis Thread
Post by: NOVA Green on April 22, 2018, 07:23:24 PM
So we have some new EV Turnout numbers by Party Registration and PEVL Votes (Those voters pre-approved) to Vote-by-Mail) that includes data from Friday, Monday, and Tuesday, that was just updated today on the election website.
We're now up to ~ 144k Total Votes, or roughly 1/3 of the Registered Voters within CD-08.
The AZ Data Guru has been a bit over the map on turnout models, but currently has it at around 50% of the final total votes (280k Total Turnout), but posted a graph today as to why the uncertainty in total estimated voter turnout numbers.....
https://twitter.com/Garrett_Archer
If we look at the PEVL voters, already 45% of those that received Mail-in Ballots have them returned and "in the bank"!!!
Roughly 70% of Registered Voters have Mail-in-Ballots and 30% can only vote same-day, hence my multiple previous statements on this thread that we should have a much clearer idea of the potential partisan composition of the electorate by Election Eve Monday.
()
Now, the key thing to note here is that thus far, both Registered Democratic and Republicans appear to have already delivered 50% of their respective mail-in-base to the polls, whereas Indies are lagging at 37%.....
Another way of looking at it is that Dems basically have 34k Mail-In-Ballots outstanding, Pubs 72k, and Indies 65k!!!!
Obviously Dems should hope that these Indy Ballots start surging towards the endgame, and aggressively target various precincts and locations with last minute GOTV efforts in places where that would likely net a favorable outcome, since in a straight up DEM-REP fistfight in CD-08 with weak Indy voting, the math becomes increasingly problematic.
Time to look at EV voting numbers to date by LD...
()
So here we have perhaps a better sense of the changes within the state of the election a week after we started to get our first surge of early ballots....
The key item that I look at are the changing overall Vote Share between LD-20 and LD-22 precincts located within CD-08....
LD-22 generally accounts for the Largest chunk of CD-08 Voters (35% in '16 and 37% in the off-year '14 election).
It not only the largest LD within CD-08 by Vote Share, but also the 2nd most Republican District.....
LD-22 Vote shares within CD-08 have dropped from 42% to 40% between 4/5 and 4/17 posting numbers....
This is likely because of the early "vote banking" from overwhelmingly Republican Sun City West (Elderly overwhelmingly Anglo Upper Middle Class retirees marketed to SoCal Seniors thinking of making a move to Phoenix....)
The fact that these shares continue to drop is obviously an extremely positive sign for the Democratic Contender, considering that unless something completely bizarre happens like a +10 D win, THIS will be the CD-08 'Pub Firewall to protect against major Indy swings elsewhere...
This is why I monitor by LD as a Macro Level overview in the fast moving data flow of VbM elections....
We are now seeing LD-20 starting to getting closer to catching up with their 9% Vote Shares in the '16 and '14 GEs....
This is significant, since as I mentioned previously, this is a place where DEMs need HUGE % margins and Turnout to make this election close.
Meanwhile, what I consider the likely decided factor is LD-21 (26-28% of LD-08), hence my previous "How Will it Play in Peoria" references, that in many ways is this is really the closest thing to a "Swing District" within LD-08....
Current EV numbers are actually closely tracking historical patterns as a total district vote share.....
Trump only received 54% of the PRES vote here in '16, and Sheriff Joe only received 50.3% of the Vote in '16.... AND Flake only captured 52% of the Vote in '12.....
Although we don't have much in the way of objective modeling when it comes to D-R-I historical results, THIS is the LD that will likely provide the make-break for either the DEM or PUB in CD-08....
Title: Re: NOVA GREEN's Election Analysis Thread
Post by: NOVA Green on April 22, 2018, 07:24:46 PM
I'm starting to wonder if Republicans are running into some Turnout issues in LD-01 and LD-15....
basically Exurban Northern Phoenix Area and a few precincts in NW Phoenix....
Started to think about this since I found some odd numbers in both LDs earlier today, ran some numbers, and it does appear that Republican Early Voting in these relatively affluent Republican areas is way lower than one would expect from traditional Early Voting habits....
Here are the precinct numbers for turnout among Pre-Approved Early Voters, and we do see that Dems are well exceeding their Party Vote Share by PEVL, compared to Pubs in the vast majority of precincts....
One must certainly wonder to what extent this pattern also exists in the wealthier and educated precincts in places like North Glendale, North Peoria, etc....
Throw in a 60-40 Indy Scene in similar places, makes the district look extremely different from a political perspective...
()
Title: Re: NOVA GREEN's Election Analysis Thread
Post by: NOVA Green on April 22, 2018, 07:25:51 PM
So to expand upon an item that I first observed last night, it does appear that Republicans do appear to have a significant Early Voting Turnout Gap in many Upper-Income Middle-Aged Anglo precincts within CD-08....
This is potentially significant in terms of where we might observe major swings towards the Democratic Candidate on Election Night, since these are the types of places where voters tend to be heavily Registered Republican, and vote early by Mail...
After spending a bit of time reviewing CD-08, my current take is that this was not only designed as a "SAFE PUB" district, but more significantly designed to appeal to multiple different elements of the Maricopa County Republican Coalition, that include the following voting blocs:
1.) Senior Citizens
2.) Upper Middle-Class Anglo Professionals
3.) Fast Growing Exurban populations
Throw in a healthy dose of Middle and Working Class communities with a significant Latino population, but where the population is majority Anglo... and meet AZ CD-08....
So let's look at those places where the Democratic Party has been turning out their Registered Voters at a much higher % than Registered Republican Voters to see what the early vote turnout battle looks like To Date....
()
Although there is no question that these are overwhelmingly Republican Precincts, one must certainly wonder if Republican EV turnout is extremely low in places like this, to what extent we will see a higher level of swings among Registered Republicans, and most significantly Independent voters break hard Dem....
()
Now let's look at those precincts where EV REG DEM turnout is running in the Mid Range compared to EV REG REP turnout....
()
So here we are starting to see Democrats turning out their base in greater numbers in some Senior Citizen precincts in Sun City and Sun City West, combined with a mixture of relatively Upper-Income Anglo precincts...
Note the 2nd range down is heavily concentrated in LD-22, which is basically the most Republican LD within CD-08, excepting perhaps LD-01 (Where we saw disproportionate EV Turnout levels covered above)....
So, let's overlap that briefly with the 2016 GE numbers for PRES and Sheriff...
()....
Obviously there is a flip side to the equation, which involves the much lower Turnout levels in more heavily Latino precincts among Early Voters, that I previously discussed especially in my LD-21 post, but is equally applicable to LD-04, LD-29, and LD-30, and to some extent parts of LD-20....
There are massive EV turnout gaps in some of the most Latino, Working-Class and heavily Democratic precincts within CD-08....
Look at the EV numbers from the following precincts: Butler, Dysart, Glencroft, Goodyear, and Surprise for example....
We can roll through various other precincts with relatively large Working-Class Latino populations, from places around El Mirage, Goodyear and the Southern precincts of Glendale within CD-08, and we similar patterns....
Sure, this election will be most likely won or lost on how heavily Anglo Seniors, Upper-Income, and Middle-Class voters swing in a special election, but at this point I'm not seeing the turnout from the relatively minor sliver of Working-Class Latino communities yet to indicate the same level of enthusiasm that we saw in the '16 General Election where Donald Trump and Sheriff Joe were both on the ballot....
Title: Re: NOVA GREEN's Election Analysis Thread
Post by: NOVA Green on April 28, 2018, 03:55:12 PM
Now that the overwhelming majority of ballots have been counted in CD-08, excepting an extremely small number of ballots outstanding from active duty service members and Americans living overseas, we have pretty close to a complete picture of the election....
Let's start briefly with a few topics such as turnout and early voting:
1.) Based upon official results, it's looking like overall turnout was about 40.4% of Registered Voters, compared to roughly 49.9% in the 2014 November General Election....
Although this number sounds pretty impressive for a Special Election, it is significantly lower than early voter models had predicted based upon historical data.
2.) It appears that voters in Arizona are increasingly relying on Early Voting, rather than Election Day Voting, as the State increasingly transitions more towards a Vote-by-Mail (VbM) model.
In the 2012 GE roughly 70% of voters cast their ballots through Early Voting here, in 2016 roughly 80% did....
In the 2018 Special Election, roughly 90% of voters cast their ballots early....
3.) This explains some of the discrepancies we have seen in the various polls of the district, where trying to weigh EV vs ED numbers alongside of Party Registration Data becomes a bit problematic.
4.) A relatively low turnout election (By the historical standards of this CD) skewed the electorate heavily Senior, in a CD where Senior Citizens even in normal Presidential GE environments tend to be a pretty hefty chunk of the electorate.
5.) I already touched on EV turnout by Party Registration in previous posts, but what we do know is that EVs represented a much larger share of the total vote compared to RVs in terms of Registered Republicans, as well as to a somewhat lesser extent Registered Democrats, and Registered Independents comprised a much smaller share of the electorate than their Voter Registration status....
Unfortunately, I don't have the final numbers broken down by party registration by EV/ED but as of the official numbers posted Monday, there were 155.7k EV ballots that were cast by registered party ( 27.9 % D, 48.3% R, 23.8% I)....
6.) Considering that 90% of the electorate voted early, the actual Election Day numbers appear to indicate that not only did registered independents that voted swung hard Democrat, but additionally that there was a significant Republican defection as well towards the Centrist Democrat running in this district.
Ok--- now let's look at a few numbers and charts.
Here are the % of Vote Share by Arizona Legislate District (LD), results by LD for the special election, and historical results by LD for precincts located within this CD.
()
Several things to note here:
1.) LD-22 was disproportionately represented in this special election, accounting for 38.5% of the Vote share in the Special Election... for historical standards it accounted for 36.6% in the "off-year" 2014 General Election, and only 34.9% in the 2016 General Election, much closer to the 34.1% RV share. Part of this might be explained by the fact that it contains some of the fastest growing exurbs within CD-08.
This is especially significant, as it is the 2nd most Republican LD of CD '08 and voted for Lesko by +10.
2.) Vote share was down, even compared to the 2014 GE in the handful of "Democratic Leaning" LDs (LD-4, LD-29, and LD-30), which although they contain a relatively small share of the total electorate, start to become more significant in a hypothetical close election within the district.
3.) Vote share was significantly down in LD-20, which in previous postings I described as not only a "must win" LD for Dems, but a "must win by double-digits" place.
4.) LD-21 vote share was roughly between '14 GE and '16 GE numbers, which I had described as a "must flip" Dem LD.
Now what interesting patterns stand out from the April 24th results by LD?
1.) Democrats achieved their best numbers ever in recent elections in LD-22.
The swing compared to the 2016 Sheriff Election was higher here than anywhere else within CD-08, and the fact that a "Generic Republican" only won it by +9.5 should obviously be of deep concern to any Republican observer of Arizona politics, as it was a + 32 Romney and + 28 Trump LD and 47% of Registered Voters are Republicans (and close to 50% of the EV).
2.) Other interesting record gains for Democrats are observable in the heavily Upper Middle-Class and educated areas North of Phoenix (LD-01) and Northwest Phoenix (LD-15).
LD-01 has long been a base Republican stronghold with not only a HUGE Republican voter registration edge, but also regularly a +35 to +40 R margin edge, so seeing only a +20 R edge for a 2nd Election (the only previous one was Sheriff Joe) is noteworthy.
LD-15 is an interesting bag.... one the one hand it has the 3rd highest % of Registered Pubs in CD-08, but increasingly appears to be flirting with the Democratic Party... Needless to say, there are plenty of other similar precincts in what is generally considered solidly Republican "North Phoenix".
3.) LD-21 is an interesting beast, and although it appears that this was a Republican HOLD based upon the top-line numbers, what is obscured is that extremely low turnout in heavily "Base Democratic" precincts around El Mirage, and parts of "South Peoria", is the main reason we didn't see a flip here, despite some pretty favorable swings towards the Dems in the more Upper Middle-Class neighborhoods, and to some extent in Sun City as well...
4.) We actually saw a drop in Democratic margins in three LD's compared to the 2016 Sheriff Election (LD-4, LD-29, LD-30)....
These are relatively small LD's (See note above on Vote Share by LD), but still elections are won and lost on the margins, as I frequently like to emphasize....
These areas all have an extremely higher number of Latinos, Younger, and more Working-Class voters...
Democrats would obviously want to see turnout levels in November in these areas be more like 2014 GE numbers (or higher), which is entirely plausible this November considering that Maricopa County residents will be barraged by TV ads for months with all of the competitive elections coming up.
Will be posting shortly with some additional nuggets, now that I have more raw data from the "final" results entered into the Excel Worksheet, just need to run a few formulas, do a bit of compare/contrast, and figure out which themes are the most relevant when examining this election.
Title: Re: NOVA GREEN's Election Analysis Thread
Post by: NOVA Green on April 29, 2018, 06:37:58 PM
Time to take a look at the Senior Vote in Cd-08....
We know from official AZ data that the average and median age of EV in CD-08 was close to 65 Years old...
In most congressional districts it starts to get tricky trying to examine the Senior Vote since the population is not distributed in a manner where we can examine the Senior Vote in greater detail.
Fortunately when it comes to data analysis, we do have some real data from Arizona, since the district not only reports EV by Age, but additionally we have massive clusters of Senior Only Communities, so at least we can look at the numbers in much more extensive detail than normal, without having to rely solely on Statewide exit polls, etc....
This is not exhaustive of the Senior Vote in CD-08, and essentially is only representative of the heavily Anglo Senior only planned communities, which generally tend to be from more Upper Middle-Class backgrounds, than the Senior electorate at large within the district.
Let's start by looking at the vote share for these Senior Only communities in recent Elections in CD-08...
()
So here we see these communities represented approximately 25% of the total vote in CD-08 in the April special election and a slightly higher share in the 2014 General Election.
If we look at Presidential Election years, these communities comprised roughly 19% of the vote in 2012, and only 17.2% in 2016 where there was overall higher voter turnout in Maricopa County, much likely caused by the combination of Trump and Sheriff Joe being on the ballot.
It will be interesting to observe if these distributions change in November '18, compared to the Special Election in '18 and GE '14...
Let's break down these communities into three categories Sun City, Sun City West, and Misc Other Planned Senior communities with both a chart and graph for each....
Sun City Historical Voting Chart:
()
Sun City Historical Voting Graph:
()
What does this data tell us?
Sun City is obviously pretty solidly Republican (Stating the obvious I know).
The +20% Voter REG edge is a killer here, regardless of 'Pub cross-over votes or heavy REG Indy swings towards the Dems.
Although there were marginal swings at the Presidential Election level between '12 and '16, most of this was a defection from the Pubs towards 3rd Party Voters, and there was only a 0.4% gain for the Dem '16 nominee.
Even in the '16 Sheriff election Sun City voted +16% for "Joe", despite the legal clouds and corruption charges racking up against him.
I posited a few pages back on this thread before the election, that if a Dem were going to make CD-08 a horse-race election, they would need to approach the '14 levels of support for a Democrat achieved by the candidate running for the Arizona Superintendent of Education race...
We saw that happen last week where the 'Pub only won Sun City by slightly less than 10%....
Sun City West Chart:
()
Sun City West Graph:
()
What does this data tell us?
Sun City West is even more Republican than Sun City, which kinda makes sense since Sun City first originated in 1960 and Sun City West sometime in the late '70s....
Over 50% of the EV here was cast by REG 'Pubs, and Dems only hit 40% of the Vote once here, during the '14 AZ Sup of Ed race.
We saw a lower increase in the DEM EV Vote Share than in Sun City, and higher IND EV vote share, and 'Pubs still only won by +14% and well outperformed their record 40.3% number from '14, achieving a remarkable 42.9% of the vote here.
Republicans are used to winning Sun City West by roughly 2:1 margins every election....
Let's look at results from the other planned retirement communities in CD-08:
This gets a bit trickier without delving extensively into Census Data, but fortunately for the purpose of this exercise, it's really easy to pinpoint those precincts that are exclusively "Senior Only" communities simply by looking at Turnout levels in off-year elections, and then pulling up the Census Data and finding out whoah 95% of the population is 55+ (etc....).
So here are the precincts that I included in the list of Senior Planned Retirement Communities...
Now a couple of these are obvious, such as Saddle Ridge which is split between Sun City and Peoria, although I didn't code it as "Sun City" and Kodiak split between Sun City West and Surprise.
()
Here is the chart for the "Other Planned Senior Retirement Precincts"
()
Here is a graph for the "Other Planned Senior Retirement Precincts:
()
So what does any of this tell us here?
The "Other" Senior Precincts category shows many similarities with Sun City West, except it has even a lower % of Registered Democrats (21.3%), slightly lower % of Registered Republicans, and a higher % of Registered Indies....
Again, we see a record level of support for a Democratic Candidate, even compared against the 2016 AZ-Sheriff race, and 2014 AZ-Sup of Ed Race....
Final thoughts:
1.) Anglo Senior Citizens in CD-08 swung hard Democrat in a national election, as opposed to relatively more localized elections (Maricopa County Sheriff '16, and AZ-Sup of Ed '14).
2.) Not only did AZ Anglo Seniors swing hard DEM on 4/24/18, but Democrats exceeded the highest benchmarks to date of a Democratic candidate among this population, with '16 Sheriff being a potential outlier because of Sheriff Joe's baggage and '14 AZ Sup of Ed being much more localized affair.
3.) The level of elasticity among the Anglo Senior population of the district exhibited by the Special Election is a bit mind boggling looking at historical election results, and part of the reason why I was generally skeptical about this being anything like PA-18.
4.) The thing that really has Senior 'Pub strategists, AZ 'Pub political leaders, crapping bricks is that this collapse of support happened among what was supposed to be one of their three core legs of the Arizona Republican Party.
In Non-Presidential Election Years (Where most of the Statewide races occur), turnout tends to be much lower among potentially Democratic leaning base voters....
Anglo Seniors account for a disproportionate share of the electorate during those off-year elections and they vote regularly....
Although there appears to be a "Crisis of Confidence" among these Anglo Seniors with the overall direction the Republican Party is taking, it still remains to be seen to what extent this will manifest in the upcoming Arizona Statewide Election contests.
Still, these numbers do not appear good for the Republican Candidate running for Flake's Senate seat in November, and it's entirely plausible that we will see some interesting numbers from similar type precincts come November '18 for the AZ-GOV race not to mention various AZ-LD SEN seats that Dems need to flip in November to take control of the AZ State Senate...
Title: Re: NOVA GREEN's Election Analysis Thread
Post by: NOVA Green on May 01, 2018, 11:18:43 PM
Ok--- let's look at the overall 75% of the electorate in the Special Election that doesn't live in Senior Only Precincts, not that there aren't Seniors living throughout these places....
Here the total numbers thus far break down roughly 67k D (48.7%)- 70.2k R (51.0%)....
Let's start with the places where there was roughly a 25% Democratic Swing between the 2016 Presidential Election and the 2018 Special Congressional Election....
These communities represented roughly 11.2% of the CD-08 Vote in 2018 vs 12.9% in the '16 Pres Election, and 11.6% in the '14 GE....
Here is the raw precinct swing chart....
()
Now we look at how these precincts voted from '12 to '16....
()
So again, you have places with roughly a 2:1 Registered Republican Voting Edge, that voted +5% for Sheriff Joe, where typically Republicans will usually win by somewhere in the +30% Margin range, that actually voted to elect a Democrat to represent them in the US House....
Even the Early Vote breakdown disproportionately favors Republicans, where the vast majority of the ballots were cast early.
If we look at the 2014 GE numbers the total raw vote from these precincts was roughly equal to that of the 2018 Special Election....
One could perhaps make an argument that there was a bit of Republican and Republican-Leaning Indy disillusionment in these places, and as I mentioned before the election I was starting to notice a slight bit of turnout gap in the Dem's favor in these types of precincts based on EV numbers.....
Now Turnout gap is obviously not an issue when your electorate is looking +20 % R vs D, and Indies aren't really showing up as much in an off-year election....
There were a ton of "flip voters" in these precincts who voted Trump/Romney, and even some who voted for Sheriff Joe....
Now where are these precincts located?
()
I'm missing a few in the far Northern part of the CD.... Majesty and Westwing, as well as one in the far Southwest part of the District.... Litchfield because I couldn't snip the CD precinct map and still have the vast majority of precinct names present...
First thing that stands out is the geographical diversity of these massive swing precincts stretching from some of the far Northern Exurbs of Phoenix, to a couple precincts in Northwest Glendale, to some more Centrally located precincts in Peoria, down to the fast growing Exurbs of Surprise, and
So what do these precincts look like from a Social-Demographic perspective?
Let's start with a Median Household Income by Census Tract Map...
()
So here you a strong overlap between Highest Income populations and largest Democratic swings between the Presidential Election of 2016 and the Arizona 2018 Special Election....
Can't see the dark red precinct in the Southwest since it missed the snip is Litchfield Park, Arizona ("Old Money Republican")....
https://en.wikipedia.org/wiki/Litchfield_Park,_Arizona
Now, let's look at the Ethnic population Map by Census Tract in CD-08...
Anglo-American Population:
()
Latino-American Population:
()
Asian-American Population:
()
So what we see here is that these heavy swing precincts are overwhelmingly Anglo in terms of population, and in many of these precincts have a significant Asian-American population, and with the exception of the SW Exurban around Surprise have a relatively low Latino-American population....
VAP numbers are likely significantly lower for the Latino-American population in most of these precincts....
Now, I can follow-up with the 20-25% swing precincts, and we will see the same pattern, although to a slightly lesser extent....
Arizona Republicans appear to have a major Anglo problem, and not just in the in the collapse of support that they saw among Reliably Republican Senior Citizens, but now among the Second Leg of the Arizona Republican coalition, Upper-Income Anglos....
Although this population votes less frequently than Seniors in off-year elections, they swung much harder Democratic than ever before in precincts that voted almost 2:1 Romney in 2012.....
Phoenix we have a problem....
Title: Re: NOVA GREEN's Election Analysis Thread
Post by: NOVA Green on May 04, 2018, 06:05:28 PM
What about those precincts that swung heavily Democratic between the '16 Presidential Election and '18 CD-08 Special Election?
Here is a list of precincts that swung +20-25% Democratc, and represented roughly 20% of the CD'08 electorate in both 2014 and 2018, and 22% of the CD-08 electorate in 2016.... ( I omitted two "Senior Only" precincts since they were included in that previous breakdown)
()
Similarly to the +25% Democratic swing precincts, we see a wide geographical dispersion pattern, with Peoria, Glendale, Surprise, and Phoenix/ Uninc North Phoenix all represented.
Let's look at the maps of the District split into the Northern Part of CD- '08 and the numerically larger Central and Southern Part of the district.
Precincts highlighted in RED are +25% D swing '16 GE to '18, those in BLUE are +20-25% D Swing...
Northern CD-08:
()
Central/Southern CD-08:
()
Let's go back and look at the Median Household Income (MHI) by Census Tract Map...
()
So, I outlined three broad areas where MHI runs about $100k/Yr....
This includes broadly (Some Precincts highlighted in BOLD):
1.) Some Unincorporated Areas North of Phoenix (Majesty and Hastings)... Deadman Wash was split into two between '16 and '18, with a new precinct Tramonto created, so although this '16 precinct swung heavily Dem, I did not include on the map.
2.)Northern parts of Glendale/Peoria/Phoenix from Lake Pleasant in the NW going South-by-Southeast through West Wing, Desert Sage, to Creedence and stretching all the way down to Angela and heads back west towards Indian Wells....
3.) A significant cluster of precincts in more of the Central part of Glendale located within the district , and Peoria, essentially crunched between Sun City to the West and Phoenix to the East where you had roughly a dozen precincts that swung 20+% Dem between '16 and '18....
4.) You have that one pocket Litchfield in the SW Portion of CD-08 that I mentioned in my previous post regarding +25% D swing precincts....
5.) Now you have one major cluster of +20/+25 D Swing precincts that is not represented on the MHI Map with high concentrations of +100k/Yr Median Household Income....
These are in the rapidly growing Exurban city of Surprise, Arizona (+220% pop growth 2010 to 2018)...
MHI runs roughly more in the $67k/Yr range, the population tends to skew much younger than CD-08 in general somewhere in the early '40s, still tends to be heavily Anglo.
These types of areas will be especially interesting to watch in the General Election this November and in the 2020 GE as the Exurban share of CD- '08 continues to grow as first time home buyers move further and further out into newer housing developments in the desert and trade more house for lower cost and longer commutes....
Ok---- how what does the voting history of the +20-25% Dem Swing ('16 GE > '18 CD SE) look like?
()
What do these numbers show from 20-22% of the CD-'08 electorate?
1.) Again we have areas with an overwhelmingly Republican voting history that almost elected a Democrat in a Special Election....
The Registered Voter Numbers (24 D- 44 R- 32 I) tend to be closer to the RV numbers in CD-08 than the Senior Citizen Precincts and the +25% D Swing precincts....
2.) Once again there were gains on the margins for the '18 Dem candidate (48-51 R) compared to the '16 Sheriff numbers (47-53 R)....
3.) If we do a compare/contrast for the +25% Dem swing precincts vs the +20-25% Dem swing precincts, the +20-25% D Swing precincts actually tend to vote slightly more Democratic than the +25% Dem swing precincts, but in the Special Election that was not the case....
The obvious variance between the two is that Independents voted at a lower level in the +20% Swing Precincts in the '18 Special Election, AND the DEMs did slightly worse in reducing the EV DEM/REP voter gap in the former....
Without doing an exhaustive study comparing the +20% vs +25% Dem swing precincts, it appears that the turnout levels in the former was a bit more favorable to the Democrats than the latter, but regardless overall +20% swing precincts accounted for a whopping 30% of the AZ CD-08 SE vote.
Some of this might possibly be related to variations in age and education differentials on the margins, combined with a bit of statistical "noise", but regardless we can see that turnout differentials were slightly less worse for 'Pubs here than in the HUGE swing precincts....
Ok--- before I finish this, there are a few more items to examine....
Here is a chart that shows the precinct level results by Party for the '18 SE and '16 PRES and '16 Sheriff Election, as well as the Early Voting partisan gap compared to the PEVL (Pre-Approved Early Voting List) numbers....
This gives us an idea of to what extent the turnout enthusiasm gap may have played a role in the EV numbers, which were obviously an overwhelming majority of the votes cast in this election....
()
So on the Left side of the chart I randomly chose Blue for some reason rather than Red (Atlas faux pas) to code DEM/REP EV turnout gaps.... basically which Party was turning out a greater number of their base voters than the other, and essentially leaving the Indy vote to the sidelines....
What do these numbers tell us?
1.) Democrats overall were much better than Republicans in getting their Early Voters to turnout, despite the last minute RNC GOTV drive....
2.) Although generally the Democratic candidate in the Special Election outperformed the Democratic Candidate running for Maricopa County Sheriff against "Sheriff Joe", it is notable that there were a relatively small number of precincts where the Dem CD-08 candidate under-performed....
Earlier in the thread I had posited that since we didn't have any real example of a potential Democratic precinct level win model in this district, the best we could do for precinct modeling would be look that the '16 Sheriff Election, and to a lesser extent the '14 Arizona Superintendent of Education Election as potential narrow routes towards a Democratic WIN in this district.
3.) Interestingly enough we don't really see the PEVL gap being the major correlation between election results in CD-08 4/24....
It looks more like a mixture of improvement on Sheriff Joe election numbers for the DEM in certain precincts, combined with a larger collapse among Trump levels of support in many of these precincts even where the Lesko out-performed Sheriff Joe....
4.) The more I look at the data, it really is starting to look like the Democratic candidate won some 65% of Registered Independents that voted, as opposed to my "High-Dem" Model of 60-40 D....
I am still extremely skeptical about any polling numbers and discussions about how 15-17% of Registered Republicans voted Democrat in this election, since we really don't have any precinct data to indicate that by Party Registration....
What I *suspect* might be the case is that these polling questions asked about Party Identification and not Party Registration.
As all of us regular Atlas Election Geeks well know Registered Independents frequently tend to lean heavily one way or the other when it comes to their voting history....
*IF* Dem's are winning 2:1 among Registered Indies in a CD where typically Dems barely break 50-50 or 53-47, 'Pub Phoenix has a massive Anglo problem....
Gotta take a break from the project, but will need to check '12 > '16 GE PRES swings for these precincts at some point.... ;)
Title: Re: NOVA GREEN's Election Analysis Thread
Post by: NOVA Green on May 05, 2018, 12:05:04 AM
Now let's shift gears and move towards the other side of the deck.... precincts where there was a '16 to '18 Dem Swing of less than 10%, and in a couple cases a reverse swing towards the Republican CD-08 candidate....
These precincts accounted for the vote share in CD-08:
Registered Voters: 9.9%
2018 Special Election: 7.1% of Total Vote
2016 General Election: 8.7% of CD-08 Total Vote
2014 General Election: 7.5% of Total Vote
Here's the list of precincts in CD '08 that had the lowest Democratic Swing between '16 PRES GE and '18 CD Special Election:
()
Here is how they voted in recent years (Filtered out Deadmanwash for reasons cited in my previous post)....
()
In theory these should be overwhelmingly Democratic Precincts compared to the RV numbers, Trump only narrowly won here (45-47 R), Sheriff Joe went down hard (56-44 D), the Dem Candidate for US SEN won in '12 (49-45 D), etc....
Reality is that in non-Presidential Year elections, these precincts start to become much more Republican as a result of turnout numbers among Registered Democrats and Indies....
Ok... here is the map of low Dem swing precincts in '18 compared to the '16 GE...
()
There a couple "Senior Only" precincts accidentally included in the final vote tally chart, Happy Trails, St Christopher and Lakeview (Sun City), that will move the numbers around a bit on the margins, but my fundamental point below still stands...
Let's look at the Latino Population of the District by US Census Tract...
()
So here we see the two precincts that swung Republican between '16 and '18 (Goodyear and San Miguel) both have fairly large Latino populations....
We also observe areas around the "Latino Belt" of CD-08 that runs South from Old Town Surprise down through El Mirage, and sweeps around to the SE portions of the district into "South Peoria" and into adjacent portions of Glendale....
El Mirage was featured in the seminal book: "The Patchwork Nation" published about eight years back as a key example of the "Immigration Nation" segment of Americana and voting habits...
http://www.patchworknation.org/Immigration-Nation
()
Although this district is not significantly Latino in terms of overall population, it is even much less so in terms of VAP and RVs, and Working-Class Latinos tend to vote less frequently in this part of the US in Non-Presidential Year elections....
Flake lost these precincts by + 1k Dem Total Votes in '12. the AZ Sup of Ed narrowly won by 100 Votes in 2014, Trump narrowly won these precincts by 450 votes in '16 (Inclusive of Senior Precincts), and Sheriff Joe lost by a huge 3.5k Votes in '16....
Hiral narrowly won these precincts by 500 votes in the Special Election, although voter turnout was only about 50% of 2016 numbers (Electorate much more Anglo and Middle-Class Latino and very few Working-Class Latino voters)...
Still, there are tons of places like this in Maricopa County, and with so many key elections on the line in Arizona in November 2018, the Special Election results from CD-08 thus far don't appear to indicate a massive Latino surge come November in Arizona...
This could easily change with extremely competitive US-SEN, AZ-GOV, races on the line not to mention pretty much all Statewide elections, and various Congressional Elections....
Still, despite the Republican Party's Maricopa County Anglo problem, the Democratic Party is facing an off-year election "Latino Problem" thus far when it comes to voter turnout and enthusiasm...
If Sheriff Joe is on the ballot as the Republican running in a GE to capture Flake's seat, this obviously won't be a problem, considering the massive Voter Registration Drives and grassroots organizing that happened in '16 against the racist a**hole.
Democrats can obviously win Arizona Statewide elections regardless of massive Latino turnout as results from CD-08 demonstrated in an off-year special election gig, but still votes are earned and not granted, AND without a significantly higher Latino turnout in the '18 AZ GE, numbers start to become much more complicated for Dems, regardless of whatever happens in the Nov '18 CD-08 rematch....
Title: Re: NOVA GREEN's Election Analysis Thread
Post by: NOVA Green on May 19, 2018, 01:37:40 AM
Now that we have most of the Oregon Election results in for the 5/'15 Primary, time to take a brief look at the Macro Level data....
Let's start with the total population of Registered Voters by County in the last reporting period prior to the 2018 Oregon Primary....
Light Gray= Counties that account for 0.0% - 0.5% of the Total Registered Voters within Oregon
Dark Gray = Counties that account for 0.6 % to 1.0 % of the Total Registered Voters in Oregon
Other colors are shaded and identified as a % of the total Statewide Registered Voting Population.
()
So the three main Counties of Metro- Portland (Multnomah, Washington, and Clackamas) account for roughly 43% of RVs within Oregon.
As I noted previously I do not consider Yamhill and Columbia Counties to be primarily Metro Portland, despite a few heavily exurban communities located on the fringes of Metro-PDX, because the predominant population in these counties do not consist of Metro-PDX commuters.
"Downstate Oregon" accounts for roughly 57% of the RVs within Oregon, and is essentially the reason why occasionally Oregon is still competitive for Statewide Elections, despite being overwhelmingly Democratic at the Federal Level....
Where are the respective Registered Democratic and Republican voting bases located at within Oregon?
Registered Democrats as % off total Party Vote Share by County:
()
Here we see that roughly 53% of Registered Democrats are located within the three counties of Metro Portland....
We see a couple decent chunks in Oregon's 2nd Congressional District (Jackson and Deschutes Counties), which account for about 9 % of Registered Dems in Oregon....
Mid Valley accounts for about 18 % of Registered Dems (Marion, Linn, Benton, Yamhill, and Polk....
Lane County (Eugene-Springfield) alone accounts for 9.4% of Registered Democrats, which forms the rump of OR CD-04, while Southwest Oregon (Douglas, Coos, Curry, and Josephine) account for only about 8% of Registered Democrats collectively....
Registered Republicans as % of Total Vote Share by County:
()
So here we see how truly marginalized the state of the current Oregon Republican Party is...
1.) About 32.7% of Registered Republicans reside in the three Counties of Metro Portland....
2.) About 21% reside in the Mid-Willamette Valley Counties, which used to be the traditional "swing district" part of Oregon and heavily located in CD-05, with the Cities of Albany and Corvallis carved into CD-04 after redistricting in 2010 to balance out the population growth from Metro-Portland and Mid-Valley to add additional population into OR CD-04....
3.) Lane County give the 'Pubs 8.5% of their total RV Share, heavily concentrated in rural and small town parts of the County, not to mention a decent chunk of voters from Metro Eugene-Springfield.
4.) SW Oregon accounts for close to 10% of the total 'Pub Vote Share in Oregon, thanks to the Oregon Republican Party swapping the 'Burbs of Portland in an attempt to make to play for Timber Country during the "Jobs vs Environment" BS angle from the 1990s....
5.) Jackson and Deschutes Counties alone account for close to 13% of the RV Republican Vote Share by County, which creates major issues for the Oregon Republican Party and brand considering these counties are increasingly trending a bit purple as a result of changing demographics and retirees from California and elsewhere relocating to these Counties that tend to be much more Liberal on Social and Environmental issues ....
The Oregon Republican Party is increasingly becoming a "rump party" dominated by an internal echo chamber making it extremely difficult to sell a comprehensive brand to a statewide audience, even for Statewide level elections, where they used to be competitive regardless of whatever was happening within the National political environment....
Oregon is a closed primary State--- Indies can't vote for any partisan primary.... So what happens when we look at the vote share by County by Party for the May 2018 Primaries?
Democratic Party Vote Share for Gubernatorial Election:
()
Oregon really didn't have very many competitive Democratic Party elections, so overall Democratic Primary turnout was a bit lower than average for an off-year election, so vote share distribution dropped a bit in Metro Portland and increased overall in most of "downstate Oregon"....
I used the Gubernatorial Democratic and Republican Primary numbers as a measurement to compare against overall RV numbers by party.
Where were the Democratic Primary Votes concentrated?....
1.) We see Metro-PDX drop to only 46.5% of Registered Democrats
2.) Mid-Valley 15.4% of Dem Primary Voters
3.) Lane County jumps to 11.8% of Dem Primary Voters
4.) SW Oregon roughly 6.0% of Dem Primary Voters
5.) Jackson/Deschutes bop up to about 10% of Dem Primary Voters
This is not bad news at all for Oregon Democrats, considering the majority of the targeted Oregon State Senate & House Districts targeted in Nov '18 for a Democratic Party "Super-Majority" in the State Legislature are in Downstate Oregon...
Where were the Republican Party Primary Voters located?
()
1.) Metro PDX--- Almost 26% of the 'Pub Vote located here....
Massive drop from the 33% of their RV Vote Share, which obviously creates some major questions and issues as to the future of the Republican Party for Statewide Elections, considering this is a part of the State, where even traditionally Republican leaning suburbs and exurbs are starting to skew heavily Democrat, well before Trump became the National standard bearer of the Republican Party.
2.) Mid-Valley--- About 21% of the 'Pub Vote located here...
Holds steady for Party Vote Share by Region
3.) Lane County-- 8.6 % 'Pub Vote Share by County
Holds steady for Party Vote Share by Region
4.) SW Oregon--- 13% of the 'Pub Vote Share....
Here's a chunk of the Republican Vote Share caused by the drop-off from Metro PDX
5.) Jackson/Deschutes--- 13.7% of the 'Pub Vote Share....
Increased numbers for 'Pubs as a share of their total vote share in some relatively fast growing "Minor Metro" Areas...
6.) Lion Share of the 'Pub increased Primary Vote Share came from heavily rural and small town areas in Eastern Oregon, as well as some numbers from NW Coastal Oregon....
Much of this information might well be completely irrelevant if one attempts to look the Oregon Primary Election and attempt to model for November '18 results considering the extremely high number of registered Independents and 3rd Party Candidates in Oregon.
Current Oregon Voter registration numbers show Registration by Party as being roughly 36% Registered Democrat, 26 % Registered Republican, and 38% Registered Independent / Other.
Still a +260k Dem RV edge is nothing to sneeze at in a relatively low population State such as Oregon with 2.684k RVs, where AVR and VBM have massively increased voter registration as % of the VAP...
This is worthy of a completely separate post, since AVR is a completely new phenomenon and has caused a major collapse in both Democratic and Republican Party Registration in Oregon alike, since the default voter registration is NAV, and most new voters don't really bother to tinker about with their voter registration until their are some major partisan primaries going on, most likely to occur in 2020 as a PRES GE year...
Now to briefly discuss the Oregon Gubernatorial Primary Elections:
1.) Kate Brown as expected performed extremely well among Registered Democrats....
There are definitely some warning signs from both the Left and Right wings of the Democratic Party if we take a brief peek at some of the County level results....
From the "Right" DINO wing of the Democratic Party you have this Ed Jones Bloke:
https://www.edjonesforgovernor.com/platform
He basically ran on a Republican platform, but managed to bag a huge chunk of Democratic Primary voters.... (8.5 %)
He hit about 20% of Democratic Primary Voters in a wide variety of Counties in Oregon, including some major populated centers such as Douglas, Linn not to mention 15+% some smaller counties throughout the State from Baker, Columbia , Coos, Crook, Umatilla, etc...
Many of these Registered Democrats will typically vote Democrat for Federal Elections and sometimes Democrat for Statewide Elections, but are voting in protest against where they see the direction of their Party going at the statewide level on issues such as Gun Reform, LGBT Equality, decriminalization of hard drugs in Oregon, and some of the other statewide programs that Kate Brown has successfully passed into law in her brief two year term as Governor.
From the Left, we have Candace Neville, who I might have considered voting for had we not had the most Progressive Democratic Governor ever in Oregon History.
Candace still managed to capture 7.3% of the Oregon GOV PRIM vote, although we don't really see a major Geographical variance in her vote distribution, with the exception of over-performing in the most heavily rural counties in the State.
I strongly suspect that most of the Neville voters will fall in line in November, with some minor defections to the Green or Working Family Party candidates for OR-GOV.
2.) I don't really have a decent take on the mindset of Republican Primary voters that went for Carpenter or Woolridge, but I strongly suspect that the vast majority of the Trumpistas and Evangelical Fundi's will fall in line behind Buehler, despite their major issues with an "establishment 'Pub" nominee since the vast majority literally despite Kate Brown to a level that we rarely see towards Democratic Governors of Oregon....
More to come....
Title: Re: NOVA GREEN's Election Analysis Thread
Post by: NOVA Green on May 19, 2018, 10:01:14 PM
Ok---- now that we've talked a bit and reviewed the data on relative DEM/REP Registered Voters by County and looked at the 2018 Primary DEM/REP Vote Share by County, time to take a look at the TWO Party May '18 RV numbers vs the May '18 OR-GOV numbers to do a compare and contrast, since even if Indies split 50-50 in the November GE, Dems hold a +16% lead over Pubs among Registered Voters, and a +12% lead over 'Pubs among Primary Democratic/Republican voters....
MAY 2018: Registered Voters as a % of combined TWO Party Votes (DEM/REP)
()
So right here, in theory, this map should be absolutely terrifying for Republicans, especially considering the DEM % of RVs dropped between '16 and '18, as many people switched from Registered NAV / 3rd Party in order to vote in the '16 DEM PRES Primaries, and switched their REG back to IND/OTHER.
I mean if hypothetically in a "Wave Election" Indies vote 60-40 Dem in Oregon in 2018, not only will we see Kate Brown win comfortably by mid double digits, but additionally the Oregon State Legislature will be Ironclad Democratic with a Super-Majority that overcomes many of the restrictions of revenue generation in the form of changing taxation policy in a direction where Big Business and extremely High Income individuals might have to cough up a few extra bucks to pay their fair share towards education, infrastructure, and social services....
Although OR CD-02 is not in play in 2018, I would not be surprised to see some significant swings in the two largest population centers within the district (Jackson and Deschutes Counties) where Republicans only narrowly hold a lead in terms of TWO Party voter registration.
Now, we do have some Ancestral Democratic voting populations in places like Coos, Tillamook, Columbia, and Wasco that obviously stand out, and I would argue that although the map obscures it Linn County as well to some extent....
OK--- What was the TWO PARTY OR breakdown for the May Primary look like by County????
I'll spare your eyeballs on this one and not code counties by color on this map, since the map that I used in MS Paint in previous posts hasn't worked as well as I would like....
()
So on the surface, again this map looks extremely positive for Democrats, especially considering that there extremely competitive Republican Primaries to challenge incumbent Democrats for a wide variety of races from OR-GOV, to OR-US-HOUSE, etc.... and on the Dem side we didn't have any real competitive primaries, other than a few races here and there for OR State SEN/HOUSE legislative districts to challenge incumbent 'Pubs....
Now what does the map look like if we take the May 2018 Two Party Margins among Registered DEMs/Pubs and contrast against the total May 2018 OR-GOV Primary Two Party numbers by County???
()
So we start to see an extremely interesting looking map, especially considering that there weren't really very many competitive Democratic Primaries in Oregon, compared to a huge number of competitive Republican Primary contests....
A few key items to note:
1.) Democratic Primary voters exceeded their Registered Voter numbers by +2.5% in the largest County and most reliable Democratic stronghold in Oregon.... Multnomah County
2.) We also see even more massive RV vs OR-GOV Two Party numbers in Benton and Clatsop Counties.
Although both are to various degrees Democratic strongholds. Clatsop County has a significant number of both retirees and Ancestral Democrats, along with a Regional Community College in Astoria. Benton County is heavily a University County, combined with a fairly educated population that works in the Tech Sector (HP), as well as massive regional Hospital that provides some of the highest quality Medical Services in Oregon outside of Metro Portland (OHSU)....
3.) Look carefully at the map along the Oregon Coast which is heavily retiree communities, and we see Dem margins doing extremely well, not only in the more Democratic Leaning retiree communities in the Oregon Coast, but even in more Republican leaning retiree communities along the Southern Oregon Coast (Coos County and Curry County)
4.) Obviously the +1.3% Dem margins in Lane County compared to RVs stands out as well, especially considering it is the major "anchor County" of OR-CD-04....
5.) Jackson County really stands out here (+0.8% Dem), considering that it increasingly looks like not only a "Flip County" but a "Flip Hard County" if the Oregon Republican Party AND the National Republican Party continues down their current trajectory....
Will need to further examine precinct level results here to see to what extent these changes are happening in Medford vs Rural Areas, and to what extent potentially high Dem turnout in Ashland and surrounding areas might be impacting these numbers.
6.) In the Portland Suburbs of Washington and Clackamas Counties we see some marginal 'Pub gains looking at RV numbers vs OR-GOV numbers by Party.
This is NOT an unexpected phenomemon considering the character and composition of the Democratic electorate in a non-competitive off-year Primary....
What is remarkable is how close these off-year primary numbers were compared to what we would normally expect historically speaking.
7.) We see significantly higher 'Pub RV vs GOV numbers in the Mid-Valley, which as I have stated before is the heartlands of the Evangelical Christian segment of the Republican electoral base.
Additionally, these same counties have some of the highest % of Latinos that are American Citizens compared to most parts of Oregon (Many Counties in Eastern Oregon have an extremely high % of Latinos that are "Guestworkers" in the farms, ranches, and agricultural processing plants in places from Umatilla to Malheur Counties).
Working-Class Latinos in Oregon tend to be more less likely to vote in off-year elections, just like in places like Texas and Arizona, especially when it comes to primary elections....
8.) SW-Oregon.... Josephine and Douglas Counties have long been the bedrock of Republican voters within Southern Oregon.... the former went for Goldwater in '64 and I don't believe has voted for a Democratic President since maybe once or twice for FDR...
There are no Timber mills left in Josephine County, in what used to be a major Timber Mill city in Oregon, where now "The Gut" a massive sprawling series of Mills has now been turned into shopping centers and discount food and apparel...
Grant's Pass accounts for a HUGE chunk of Total Voters within Josephine County and in the past few decades has transitioned from a Working-Class Republican Mill town to a retiree town.
Josephine County is probably the only place in Oregon where Democrats perform better in rural areas than the largest population center within the County.
Douglas County was ground zero in the Oregon "Timber Wars" of the late '80s to the present day...
It's a bit more of a Trip considering that it was only (47-53 R) in '88 and is now essentially the most Republican County in Oregon West of the Cascades.
There is still plenty of Timber to be logged, even without dipping into Old Growth in the National Forests of Douglas County....
There are still Timber Mills active in Roseburg, and other parts of the County, although the old Oregon Mantra goes: "Douglas County is where they harvest the Timber, and Lane County is where they Mill the Timber"
Still, this is a County where unemployment rates spike through the roof every time there is a National Recession and collapses of the Housing Market....
Can't remember offhand the exact numbers, but during the Bush Jr recession, thinking the unemployment rate spiked at something like 17% in '09....
9.) Deschutes County numbers look good for 'Pubs.... Turned out in high numbers to vote for the ("Moderate 'Pub) as opposed to the 'Fundi or the Trumpista candidate for OR-GOV.
10.) In the heavily Latino portions of Eastern Oregon (Morrow and Umatilla Counties) we see some of the greatest increases for the 'Pubs compared to the RV numbers for the Primary Election...
One could likely make an argument that Crook and Jefferson Counties were similarly impacted by low voter turnout among Latinos/ Native Americans...
More to come.....
Title: Re: NOVA GREEN's Election Analysis Thread
Post by: FairBol on June 05, 2018, 03:37:43 PM
This is cool! Any analysis on how things might play out in CT?
Title: Re: NOVA GREEN's Election Analysis Thread
Post by: FairBol on June 05, 2018, 03:39:12 PM
And I have to ask, where do you get all your stats from?
Title: Re: NOVA GREEN's Election Analysis Thread
Post by: FairBol on June 05, 2018, 06:53:02 PM
So....I'm working on some analysis of the voting situation in CT. This is going to take a while, but....here's a look at registered voters in Fairfield County, by party.
()
As you can see, most voters in Fairfield County have no party affiliation (NPA). Of voters that do have an affiliation, Democrats outnumber Republicans, 35-24. As far as the "minor parties" go (Green, Libertarian, and a couple of others), about one percent of registered voters are Independents.
More data and analysis of the seven other Connecticut counties coming soon.
Title: Re: NOVA GREEN's Election Analysis Thread
Post by: FairBol on June 06, 2018, 12:14:28 PM
A quick look at the numbers in Hartford County. I'll post an explanation of this chart soon.
()
()
Title: Re: NOVA GREEN's Election Analysis Thread
Post by: FairBol on June 06, 2018, 12:20:29 PM
Briefly, the percentages in Hartford County are 41.8 Democratic, 18.2 GOP, 1.8 Independent, and 38.2 NPA.
Title: Re: NOVA GREEN's Election Analysis Thread
Post by: NOVA Green on June 10, 2018, 08:59:51 PM
There is a lot of subtlety when it comes to looking at the issue of "Culturally Liberal" versus "Socially Liberal" attitudes, without even addressing the "Rural Areas" question....
Let's start with the question of what does it mean to be Culturally Liberal?
If we look at the limited Wikipedia Definition we see the following:
"Cultural liberalism is a liberal view of society that stresses the freedom of individuals from cultural norms and in the words of Thoreau is often expressed as the right to "march to the beat of a different drummer".[1]"
Cultural liberals believe that society should not impose any specific code of behavior and they see themselves as defending the moral rights of nonconformists to express their own identity however they see fit, as long as they do not harm anyone.[dubious discuss] The culture wars in politics are generally disagreements between cultural liberals and cultural conservatives, as cultural liberals are strongly opposed to censorship or any kind of oversight of spoken or written material.[2] They believe that the structure of one's family and the nature of marriage should be left up to individual decision and they argue that as long as one does no harm no lifestyle is inherently better than any other. Because cultural liberalism expresses the social dimension of liberalism, it is often referred to as "social liberalism", but is not the same as the political ideology known as social liberalism.
https://en.wikipedia.org/wiki/Cultural_liberalism
This definition is so broad that it would likely include large swathes of rural America since there is inherently a Libertarian component when it comes to fundamental items such as Freedom of Speech and the Individual versus attempts to restrict those existing rights.
Social Liberalism
Under social liberalism, the good of the community is viewed as harmonious with the freedom of the individual.[6] Social liberal policies have been widely adopted in much of the capitalist world, particularly following World War II.[7] Social liberal ideas and parties tend to be considered centrist or centre-left.[8][9][10][11][12] Social liberals see themselves as occupying the middle ground between social democrats and classical liberals.
"The term "social liberalism" is used to differentiate it from classical liberalism, which dominated political and economic thought for a number of years until social liberalism branched off from it around the Great Depression. In American political usage, the term "social liberalism" describes progressive stances on socio-political issues like abortion, same-sex marriage or gun control as opposed to "social conservatism". A social liberal in this sense may hold either "liberal" or "conservative" views on fiscal policy."
https://en.wikipedia.org/wiki/Social_liberalism
Although these definitions are sourced from Wikipedia, rather than any Political Science Journal focusing on Political Philosophy within the context of American Politics, it provides us with a starting foundation to at least address the question properly....
If we move to the definitions of "Rural" at least we have a commonly accepted means to discuss the data based upon US Census Definitions....
if we use the Census Bureau definitions of "rural" as I posted on another thread regarding "rural White Majority Counties won by HRC"....
https://uselectionatlas.org/FORUM/index.php?topic=292631.msg6219390#msg6219390
()
Now it get's trickier if we use the Census Definition of "rural" areas more narrowly, since this involves precinct level analysis and/or assumptions about the distribution of the "rural" population compared to whatever larger population centers exists within a given county:
According to the current delineation, released in 2012 and based on the 2010 decennial census, rural areas comprise open country and settlements with fewer than 2,500 residents.
Whew--- now where do we have at least some data points to examine issues relating to Abortion, LGBTQ Equality, Guns, Freedom of Speech, and Marijuana????
Well, we do have a decent amount of data from Oregon since ALL of these issues, (Plus many more) have popped up on the ballot as part of Oregon's direct democracy Citizen Initiative process (Although many of these were sponsored by the Oregon Citizen's Alliance from the late '80s to the Mid '00s....
Let's start with Freedom of Speech:
1996: Oregon GE Ballot Measure #31: Removes State Protections for Obscenity
()
So here we see even traditionally heavily Republican parts of Eastern and Southern Oregon reject the attempt to modify the Oregon State Constitution that would have made it much easier to "Ban Smut"....
What's really interesting about this map is that it was rejected by decent margins in Eastern and Southern Oregon, but still passed in most Counties within the Mid-Willamette Valley....
It's also notable that among several of the Counties on the Oregon Coast with the highest proportion of Seniors (Curry, Lincoln, and Tillamook) the race was much closer regardless of the variance in partisan affiliation....
The Counties with the largest support for the "Smut Ban" were the suburban Portland Counties of Washington and Clackamas, and even in the more heavily Mormon and "Cowboy Country" areas of SE and NE Oregon, this measure was rejected everywhere except for Malheur County....
2000 GE: Remove Protections for Adult Businesses from Oregon Constitution
()
This was basically an attempt to shut down strip clubs, adult bookstores, and even potentially LGBTQ businesses under the guise of giving power to individual units of Government (In places like Portland there are neighborhood associations that essentially control many zoning related decisions)...
Although this initiative was a bit closer in many parts of rural Oregon than the attempt to "Ban Smut" (Much of Eastern and Southern Oregon doesn't really have much in the way of Strip Clubs or Adult Bookstores), it still narrowly won in the "Bible Belt" of Oregon in the Mid-Valley although it still performed slightly worse in the Suburbs of Portland...
Coastal Oregon is interesting here in that the '96 "Banning of Smut" was closer than the attempt to ban strip clubs and adult bookstores...
Abortion:
1990 GE: Ban on Abortions with Three Exceptions....
()
So here we see how overwhelmingly Pro-Choice Oregon is, even in heavily rural parts of the State....
Key things to note here is that there were only two Counties in Oregon that voted over 40% to "Ban Abortion" (Linn and Malheur)....
The next biggest chunk of Anti-Choice Counties would be in "Bible Belt" of the Mid-Willamette Valley (Marion, Polk, Yamhill) and Douglas and Josephine Counties in Southern Oregon...
One could certainly make a decent argument that being Pro-Choice is Culturally Liberal vs Socially Liberal.
1990 GE: Requires Parental Notification for Minors Receiving Abortions
()
So here we see a potential gap between Social and Cultural Liberalism, with many Oregonians in both Rural areas and Cities saying "Yes we are Pro-Choice, BUT Parents should be notified 72 Hours in Advance if their Teenage kids are scheduled to have an Abortion procedure"....
There was essentially a similar measure on the ballot in '06, (Although it required 48 Hour Notification) and most of the Counties in Oregon had essentially minor variances from the '90 results....
()
What do we see here???
An Uptick of support for Parental Notification in much of Eastern and Central Oregon, with Southern Oregon holding steady, and an increase of support for a more "Socially Liberal" gig in the Counties of the Mid and Upper Coastal Rural parts of the State....
Not even going into the Portland suburbs and MultCo which are really where the major swings happened between '90 and '06 on this question...
GUNS:
Oregon has only really had one direct democracy initiative directly addressing Guns and it was way back in 2000, but still it gives us an idea regarding social/cultural Liberalism when it comes to something as basic such as closing the "Gun Show Loophole"
()
So this map is pretty fascinating.... as one might expect much of Eastern and Southeastern Oregon voted against closing the "Gun Show Loophole".... Still once we get outside of Ranching Country we see Umatilla County voting 45% YES...
When we move to Southern Oregon we see some interesting results from Josephine County, and Jackson County votes (58-42 YES)...
Rolling up into the Mid-Willamette Valley, we see only Linn County voting against, and overwhelming support in favor in Marion/Polk....
Mid and Northern Coastal Oregon votes heavily in favor, with the exception of Columbia County (Think WWC Deer Hunter Country)
LGBTQ Equality:
1992: Ballot Measure # 9: "Government Must Discourage Homosexuality"
()
Again, we see the Libertarian element at play in much of Eastern Oregon, even in some extremely heavily Republican parts of the State....
Looking at Southern Oregon, we see that the Coastal Counties (Coos and Curry) weren't too crazy about that, although it did narrowly pass in Jackson County, and perhaps as expected Josephine and Douglas Counties by large margins....
Again we see the "Grain Belt" of the Columbia River Gorge not being too crazy about all of this....
The "Bible Belt" of the Mid Valley tends to be a bit more split (Marion, Polk, Yamhill), and Linn County once again shames us all....
Columbia County obviously stands out here considering that it voted to the Right of Coos County, both of which have long time been "Ancestral Democratic" Counties, where Columbia just flipped for the first time from a Democratic Candidate in a Presidential Election since the New Deal era....
2000: Ballot Measure # 9: "Prohibits Schools from Promoting Homosexuality"
()
The slippery slimy weasels of the Oregon Citizens Alliance try it again, but this time doing their shtick about how they are trying to "protect the kids" from a Homosexual Agenda...
It performed much better at the Ballot Box than their '92 Measure.... Still it should be noted that many "rural" parts of Coastal Oregon rejected this Measure, as well as lackluster support in much of the Columbia River Gorge....
2004: Ballot Measure #36 Constitutional Amendment- "One Man One Woman"
()
Although arguably SSM was way ahead of its time in '04, this was yet another attempt by the Religious Right to spark turnout in a Presidential General Election Year in Oregon to spike Evangelical Voter turnout in what some 'Pubs thought might be a "Swing State" at the time....
Only two Counties in Oregon voted against a hypothetical Marriage Equality scenario (Multnomah and Benton)....
Still, looking at Rural Counties in Oregon, numbers from Lincoln, Clatsop, and Hood River, were actually fairly close....
Obviously SSM has seen one of the biggest changes overall when it comes to public support of any social issue, other than perhaps Marijuana Legalization, so we can't view Cultural/Social Liberalism on LGBTQ Equality alone from "Rural Counties" in Oregon from an election in '04....
I could pull up some various County maps from Oregon for Marijuana related policy issues, but had something floating around from the '14 Legalization Ballot Measure in Oregon.
Honestly I don't recall my exact color coding scheme (Although I rarely smoke the stuff myself except for maybe 3-4 times a year on a special occasion), but I'm assuming that Green means GO and RED means NO, YELLOW means NO but only SLOW, etc....
()
So again, the "Bible Belt" of the Mid-Valley votes Slow but NO, Green Lights from Southern Oregon, except SLOW from Josephine and NO from Douglas (Which is fascinating considering it for a long time has been one of the top 10 outdoor Marijuana Growing Counties in the US, going way back to the days of the decline of the Timber Industry)....
One could certainly make a decent argument that there many rural parts of Oregon that are Culturally Liberal, but not Socially Liberal....
Even there, in many parts of rural Oregon we see strong support for freedom of speech against attempts to overturn Oregon Constitutional Protections against Nude Dancing and Pornography, strong support for Female Reproductive Rights, even in many places including the Rights of Medical Privacy for Teenagers, in favor of closing the "Gun Show Loophole", Legalization of Medical/Recreation Marijuana, AND even although LGBTQ Equality didn't perform especially well at the Ballot Box in Oregon between '88 and '04, it's still pretty clear that there was a significant amount of support even in many Rural areas of Oregon against the attempts to destroy equal protections for the Community....
Cultural Liberalism/ Social Liberalism....
Now to the OP's question, my thought is where it comes to WWC Rural areas swinging against Trump, we would most likely see that in Coastal Oregon, the Columbia River Gorge, as well as perhaps certain parts of Southern Oregon and Central Oregon....
Honestly IDK about Trump in Eastern Oregon and SouthEastern Oregon in 2020, but potentially although these are not places I would consider "Socially Liberal" these might well be places more elastic than many other parts of "Rural Oregon" considering how poorly HRC performed compared to the performance of any other Democratic Presidential Candidate at any time in recent political history....
Title: Re: NOVA GREEN's Election Analysis Thread
Post by: NOVA Green on June 30, 2018, 05:15:17 PM
Although I do see Maricopa County, and with it Arizona likely flipping in 2020 with Trump at the top of the Republican ticket, I'm not convinced that this will necessarily be a permanent phenomenon turning Maricopa County into some type of Democratic stronghold....
There are some structural advantages that both Democrats and Republicans have in respective parts of the County that indicate it will if anything tend to remain more of a "Purple" County over the next few Presidential Election cycles, although if it breaks hard Democrat in 2018 and 2020 there is a good chance that many of those Republican leaning Indies are gone for good...
Here are a few charts and graphs that I came up with last November for Maricopa County...
Where are the votes located at within Maricopa County?
()
We see that Phoenix accounts for about 33% of the total votes in '16 (Which was basically unchanged from '12 > '16), and a number of medium sized cities accounting for about 57% of the County Vote, and roughly 10% of the votes coming from Unincorporated, and to a much lesser extent rural areas.
CITY 2016 % of Cty Vote Share
PHOENIX 32.9%
MESA 11.8%
CHANDLER 7.0%
GLENDALE 5.0%
SCOTTSDALE 8.0%
GILBERT 6.9%
TEMPE 4.1%
PEORIA 5.0%
SURPRISE 3.5%
AVONDALE 1.5%
GOODYEAR 2.3%
BUCKEYE 1.7%
Non Top 12 10.3%
How did these places vote in the 2012 and 2016 Presidential Election?
()
()
So several things stand out here...
1.) Phoenix is starting to move in the direction of being a solidly Democratic City, as opposed to being a marginally Democratic City, and accounted for a huge chunk of the '12 > '16 Dem vote gains within Maricopa County from + 27.5k D in '12 to + 75.0k D in '16.
Although the margin swing was lower than in many other communities in Maricopa County, the sheer size of the Phoenix vote share more than made up for those numbers.
Now it should be noted that many of the places within Phoenix that saw the largest '12 > '16 Dem swings were in relatively affluent Anglo and Republican leaning precincts within the City, so despite the '16 "Latino Surge" in some of the more heavily working and middle class neighborhoods within the City, even if we see a comparable surge in 2020, as well as the addition of a number of younger Democratic leaning voters showing up to vote for the first time with the simplicity of a heavily Vote-by-Mail (VbM) electorate, that is clearly not sufficient alone to maintain a +15% D vote margin
(54-39 D) that we saw in 2016.
2.) Mesa is still a solidly large Republican vote basket accounting for a +40k R 'Pub lead in 2012 and +30k R lead in 2016.
Although Trump performed significantly worse than Romney, it still went almost +17% R, with almost all of the 'Pub drop-off going to 3rd Party candidates. Not that there weren't some Romney > HRC voters here, but one would certainly imagine that 'Pubs would be the net beneficiaries in this City if 3rd Party voting craters in 2020 and beyond.
3.) Chandler appears that it is starting to move heavily in a Democratic direction, and I suspect that trend will continue into 2020 with Trump leading the Republican brand.
Still again, much of the movement here was from upper middle-class voters in a relatively diverse and educated suburb of Phoenix, so will that trend hold in the Post-Trump era or will some of these voters return if the Republican Party sheds some of the extremist rhetoric that alienates these types of voters?
4.) Glendale did not swing nearly as heavily Democratic between '12 and '16, mainly because there was a smaller drop-off of Republican vote percentages compared to Chandler.
Still, Dem's managed to gain votes compared to '12 and we do have an additional data point in the form of the 2018 AZ-CD 08 Special Election, which I posted extensive a detailed analyses of that many of you read on another thread.
The portion of Glendale located within CD '08 was essentially the heavily Republican part of the City and we saw a massive Democratic swing in the '18 Special Election compared to the '16 Presidential Election....
Here's a link to a few posts that I made regarding the election results from CD-'08 that go into quite a bit of precinct results and demographic details on Glendale, as well as Peoria, Surprise, etc...
https://uselectionatlas.org/FORUM/index.php?topic=288717.msg6183143#msg6183143
While one needs to be extremely cautious using data from a Special US House Election to extrapolate Presidential voting intentions into 2020, it is hard not to view this election as in many ways a referendum on the Trump Presidency, and when you see a +12.5% '16 Trump part of the City flip heavily Democratic in early '18 and then throw in the already heavily Democratic precincts NOT located within CD-'08 the trends start to look extremely bad for Republicans.
It should also be noted that most of the 20-25% Dem swing '16 PRES to '18 House Special election precincts within Glendale happened in overwhelmingly Anglo Upper-income Educated/Professional precincts.
Will these voters feel differently in November 2020 assessing the Trump Administration, looking at their tax bill, etc ???
5.) Scottsdale saw the largest Democratic swings in Maricopa between '12 and '16 with a +14.5% Dem swing and a net gain of +5.2% to the Dem vote share (From 60-38 R in '12 to 51-43 R in '16).
Have Dems maxed out their votes in Scottsdale or is there more room to expand?
There were relatively few 3rd Party votes here, compared to most other places in Maricopa County and even if we were to chop the 3rd Party vote by overall city percentages, it's difficult to see 'Pubs really gaining any significant raw vote margins compared to '16.
I haven't pulled the '08 PRES numbers for Maricopa, but it wouldn't surprise me if there were a decent number of Obama '08 > Romney '12 > HRC '16 voters in Scottsdale which tends to skew much older, Anglo, Educated, and Upper-Middle Class retirees contrasted against places like Sun City and Sun City West.
The Anglo retirees in Scottsdale appear to be much swingier and elastic than in some other parts of Maricopa County and we don't have any real election data to see how these voters are responding to the Republicans attempt to destroy the Affordable Care Act, which has become increasingly popular, especially among older voters.
6.) Gilbert is another Republican vote basket similar to Mesa, but even more Republican. There were larger swings here than in Mesa, not to mention a +1.9% increase of the Dem vote percentage between '12 and '16, but yet my gut says similar to Mesa a decrease in 3rd Party voting in 2020 would likely benefit the 'Pub nominee (Trump)....
Still, Gilbert skews more Middle-Aged than Senior, the Household Income remains high, but the Educational attainment level is pretty high for Metro Phoenix (#13 % overall for Bachelor degrees) so it's entirely possible that some of the Obama '08 > Romney '12 > Johnson '16 voters might break Dem in '20 without HRC at the top of Dem ticket and cut into Trump '20 raw vote margins and maybe shave another ~ 5k off the top of ticket race....
Wild Card???
7.) Tempe is a City where there is no place to go but up with Trump running as the 'Pub nominee in '20....
Tempe is the most Democratic City in Maricopa County of the largest 12 Cities voting for Obama '12 (56-41 D) and HRC (58-33 D).
Home Arizona State University (ASU) it's pretty safe to say that a large chunk of 3rd Party voters here would likely vote Democrat for President in 2020 without HRC at the top of ticket rather than a protest vote for Johnson or Stein or Bernie write-in.
It's entirely feasible to see a Dem Pres candidate in 2020 gaining a net +5k D vote margin, even with Trump maintaining 33-35% of the Total Vote.
8.) Peoria has long been a Republican stronghold with relatively minor changes in PRES % numbers between '12 and '16 and an almost +20k R raw vote margin in both elections.
Will the 2020 Pres numbers be closer to '12 and '16 % numbers or closer to the '16 "Sheriff Joe" referendum and the '18 House Special Election, roughly +4-5% R in both races????
As I posted shortly before the AZ CD-08 2018 Special Election: "How Will it Play in Peoria?"
https://uselectionatlas.org/FORUM/index.php?topic=288717.msg6145557#msg6145557
Peoria, Arizona is a bellwether city within AZ CD-'08 when it comes to overall voting margins, and I'm becoming increasingly convinced that it is an important place to test the relative elasticity of Republican leaning Indies within Maricopa County at large.
Although a Democratic Pres candidate doesn't need to win or come close to winning Peoria, in order for a Dem to win Maricopa they need to keep 'Pub margins to no more than + 20% R.
9.) Surprise a fast growing exurban City in the far Northwestern corner of CD-08 was the real surprise of the 2018 Special House election.
Although it was the least elastic largest City within Maricopa County (+0.5% D '12 > '16), and the most Republican City in the 2016 Pres Election (59-34 R), we saw some of the largest swings here between '16 GE PRES and '18 SE House....
Fast growing Exurban parts of Maricopa like Surprise and Buckeye are likely to continue to be extremely politically volatile over the next decade, and will likely determine the political trajectory of Maricopa County and indirectly Arizona well into the 2020s....
10.) Non Top 12 Cities in Maricopa County aka everything else accounts for 10% of the County Vote Share....
This includes a wide range of unincorporated areas, smaller communities, and even a few rural areas.
Obviously these places deserve a much more detailed analysis, since alone they accounted for raw +40k R vote margins in '16, +42k R raw vote margins in '12....
These places include the heavily Republican retiree communities of Sun City and Sun City West (See AZ CD '08 results) but also include Native American reservations, heavily Latino precincts of places like El Mirage where HRC wasn't especially popular especially after some of the Obama Anti-Immigration policies that caused him to be labeled the "Deporter in Chief" among many Spanish speaking communities, as well as extremely wealthy Uninc areas throughout Metro Maricopa, and then throw in some overwhelmingly rural precincts....
How do Republicans keep winning Maricopa County Arizona at a Presidential Level????
It's actually really easy...
1.) Let go of the culture war issues such as scapegoating Latinos and Ethnic and Religious Minorities. Not only does this make it much more difficult for the 'Pub brand among Minority voters in Maricopa, it also alienates a ton of educated and Middle-Class Anglo voters as well.
2.) Demonstrate that Republicans can run as a Moderate Center-Right Party of Government as opposed to tying to destroy funding for Government services such as Education, Entitlement Programs, Health Care, and Transportation.
3.) Change the focus from the negativity such as Trump's '16 Pres election campaign designed to appeal to WWCs in Northern States where job losses have continued to accrue as a result of Democratic/Republican Administration Free Trade policies alike over the past 30 years, to a more positive approach.
Arizona is a Sunbelt State and people tend to prefer optimism to pessimism in the Sunshine State....
Democratic and Republican politicians alike run campaign ads about gritty Northern Factory Towns and Cities where all hope is gone because the "Plant closed Down"....
That's not how voters in Maricopa County perceive their State and communities....
Metro Phoenix took a huge hit at the time of the Great Recession, as did Metro Las Vegas....
Not only did homeowners property values collapse, but all new home construction froze, and tons of skilled construction workers left and disappeared for good to retire, seek alternative employment, and in many cases go back to Mexico after 15-20 Years of living and working in the United States....
Now it is "Morning in Arizona" and Trump will need to contest this State hard to avoid losing and try to take something out of the Ronald Reagan playbook "Morning in America" campaign commercial where the official title was "Prouder, Stronger, Better"...
Link to the official Reagan '84 Campaign commercial from the Ronald Reagan Library....
https://www.youtube.com/watch?v=Zn9fR_-X9uw
Title: Re: NOVA GREEN's Election Analysis Thread
Post by: NOVA Green on July 22, 2018, 11:49:52 PM
Now that we are rolling into Special Election Season in OH US-REP CD-12 let's take a brief look at a few relevant items....
Let's start with the vote share by County within OH CD-12 Precincts....
()
So basically the concept of vote share over three election cycles using the topline election (US_PRES '16, OH-GOV '14, US PRES '12) is to be able to adjust data to control for voter turnout differentials as well as population growth rates within a given CD....
Basically, what we see here is that Franklin and Delaware County collectively account for ~ 60% of the Vote Share within the CD, and have essentially been a growing segment of the electorate between '12 and '16....
Licking County has been a consistent ~ 20% of OH CD-12 Vote Share, and obviously will be a major contributor to any CD-12 Special Election Results in August 2018....
The other Four Counties precincts located within CD-12 ('12 > '18 account for the remaing 20% of the Vote Share---- (Marion, Morrow, Muskigum, and Richland).
Now let's take a peak at the 2012 to 2016 US PRES vote swings by County within CD-12.
()
So here we see a dramatic increase in Democratic support within the Franklin County portion of CD-12, as well as to a lesser extent within Delaware County, but also some major swings towards Trump in other Counties within the precincts of CD-12....
Now let's look at the raw Total Vote DEM-REP Margin Changes between 2012 and 2016 for US PRES by County...
()
So here we start to see the raw power of massive swings among the heavily Upper-Income Anglo precincts of Franklin County between '12 and '16....
Honestly, I don't think the 'Pubs have yet hit rock bottom within these Franklin County precincts, but my suspicion is that O'Connor will likely outperform HRC, despite the "Trump Tax Cuts that nobody really experiences in the actual deductions on their Paychecks....
DEMS win '16 US-PRES in Franklin County precincts +36k and +22% Swings even excluding 3rd Party Votes....
Delaware County is obviously Ground Zero.... DEMS don't need to necessarily win Delaware County in CD-12 OH SE results, but just keep the PUB Margins as both % and RAW VOTE down to something more like ~ +7-10k R.... a 54-46 R win in Delaware County might be sufficient for a DEM win in CD-12...
Licking County and Muskigum County are a real test of if a LIB DEM can regain Obama '12 voters that defected to Trump.... Obama narrowly won Muskigum precincts with OH CD-12, and in Licking managed to bag a 42-56 R loss to Romney in '12....
I haven't had a chance to run all of these precinct numbers that I have for OH from '04 > '16, but to me it's starting to look like a potential combo scene between the relatively solidly Republican suburbs of South Pittsburgh moving hard Dem (Delaware County maybe less so???), but with a dramatically growing Dem base within the Franklin County portions of OH CD-12, where you really didn't have any comparison within PA-18 other than one township in South Allegheny (Mt Lebanon) that essentially swung dramatically DEM from '12 to '16 similar to the Franklin County precincts of OH CD-12....
What you did have in PA CD-18 were Ancestral DEMs in the SW portion of the County that although Lamb narrowly lost, he was able to replicate Obama '08 numbers in Fayette and Washington Counties....
At this point we have no real evidence whatsoever that Obama '12 (Or Obama '08 DEMs) will come home for a US House election in Licking and Richland Counties....
I'll continue to run the precinct level numbers, but Trump did have major swings in the Rural and Small Town WWC precincts here, which despite the dramatic swings towards HRC in Franklin, and to a lesser extent Delaware, still makes this a jump ball...
I'll run some more stats later, as I have done with PA-18, AZ-08, AL-SEN and mix in more data that overlaps with US CENSUS Stats in greater detail by Municipality and Township within CD-12....
Title: Re: NOVA GREEN's Election Analysis Thread
Post by: Adam Griffin on July 23, 2018, 01:05:29 PM
Glad to see you around! Hadn't seen you post in awhile (though maybe I've just not been looking in the right threads).
Title: Re: NOVA GREEN's Election Analysis Thread
Post by: NOVA Green on July 26, 2018, 03:09:52 AM
Franklin County is where the Democratic Candidate for OH CD-12 needs to win big in the Special Election in two weeks, or in the General Election this November, if Democrats are going to flip this US House District....
Let's take a more microscopic level of detailed analysis of the Franklin County precincts that account for roughly 33% of the CD vote in an average General Election.
Let's start with the Vote Share by municipality within Franklin County....
()
So here we see that the City of Columbus accounts in general for slightly less than 50% of the CD-12 vote Share within Franklin County, within a Presidential Election Year....
What happened in 2014 when it comes to the distribution of vote-share by place within Franklin Co CD-12 precincts???
()
Here is the same data from 2012....
()
OK--- to what extent does this really make a huge difference when it comes to the overall vote numbers in CD-12 precincts within Franklin County???
Obviously the only way that Democrats can win this special election in OH CD-12 is to rack up massive numbers within Franklin County, especially within precincts most favorably disposed to voting for a Democratic Candidate for a Federal Election....
In many ways very similar to the Southern Pittsburgh suburbs of South Allegheny County, even the most Democratic Precincts in recent years within Franklin County are relatively new converts to the Democratic Party, and tend to vote heavily Republican in most elections....
Let's take a look at the voter turnout by place 2012 to 2016 within the CD-12 precincts of Franklin County....
()
Now let's take a look at how Democratic these various municipalities are when it comes to Federal Elections.... Hint at the Statewide level these are overwhelmingly Republican Precincts in recent years....
()
So, although you will likely need to open the image in a new window to drill down to a level of detail, and working the long factory shifts, haven't really had tons of time to work on the visuals, but what really stands out is this:
Franklin County Precincts of CD-12 are NOT traditionally heavily Democratic at most election levels, even in 2016!!!!
What we see here are a handful of elections where Democrats have performed extremely well in various elections....
Even the precincts of Columbus only really voted heavily Democratic for Presidential Elections in '12 and '16, throw in a US SEN race from '12 with Sherrod, and OH-TREAS race from '14, but overall the results don't look particularly impressive, especially for US-House races....
Meanwhile Dublin looks like a Republican stronghold, with the exception of '16 PRES and '12 SEN, Westerville looks swingy but Lean Rep, and even Worthington generally votes 'Pub for most elections!!!!
Ok--- so now let's take a look at MHI by place within CD-12....
()
Wow!!! New Albany with an MHI of ~ $185k/yr went from 2012 (34-65 R) +31 R to in 2016 ( 48-48* R) for a +31% D swing....
Ok, not tons of people in these precincts, but still noteworthy...
Dublin clocks in with an MHI of $113.2k/Yr and in 2012 at the PRES level voted (40-59 R) and then in '16 (49-47 D) for a +21% D swing....
Meanwhile within the precincts in Columbus....
In 2016 (63-31 D) vs 2012 (59-39 D) for only a +12% D gain....
Where I'm trying to go here is that really we don't have any real history of even the "Democratic Strongholds" of OH CD-12 voting heavily Democratic, with the exception of the past few Presidential Election cycles plus votes for Sen Brown (D-OH)....
So before Dem avatars start getting too excitable, best not to develop too great a taste for the Hobbit leaf quite yet....
*IF* this election is nationalized in terms of local voting patterns, *AND* Dem Turnout is high, especially within the precincts located within the City of Columbus, and *ALSO* Dem margins in the Special Election within the Franklin County precincts look more like 2016 numbers, we might well have a horse-race....
Personally, my thought is that the OH CD-12 House Race will essentially be nationalized, and many of those Romney > HRC voters that went down-ballot Republican in virtually every election, will likely vote Democratic for the CD-12 Special Election.
Next Stop Delaware or Licking County....
Title: Re: NOVA GREEN's Election Analysis Thread
Post by: NOVA Green on July 26, 2018, 03:37:26 AM
Glad to see you around! Hadn't seen you post in awhile (though maybe I've just not been looking in the right threads).
Thanks Fmr Pres Griff!!!
Been a mixture of factors, the whole work-life balance scene, going back to some classic old skool PC gaming, and also quite simply that I don't find political partisan primaries particularly interesting when it comes to running more detailed precinct level and social-demographic data unless it's a US-PRES Primary, or a State or election I've been tracking...
I tend to defer much of the Primary detailed analysis to those on Atlas, such as yourself, that have a much better grasp on the intricate subtleties of Intra-Party political dynamics... :)
Besides, it's way too early to even comment on National Polling for many of these elections, since in the most interesting elections, we aren't even going to get a decent idea about how the contests might shape out until after Labor Day!!!!
Been doing a ton of lurking, especially now that most of the crap posters and trolls are basically done posting for whatever reason, and the overall quality of posts on most threads and boards have increased dramatically after all of the craziness on Atlas with the lead-up and aftermath of the '16 PRES election.... :)
Title: Re: NOVA GREEN's Election Analysis Thread
Post by: NOVA Green on July 27, 2018, 05:53:51 PM
Excellent post as always Nova. So here's my latest question. How do the various counties current share of the district's early vote compare to their share of the early vote at this time prior to the 2014 and 2012 elections? Would those numbers be at least a reasonable indicator of what the final share of each counties vote will be after election day? I ask because signs that Franklin County is outperforming its usual share, and by how much, are going to be every bit as key as O'Connor's margin there, frankly.
Another excellent question, and one that I don't believe we have comprehensive data-sets to be able to address, although some other posters such as Ebsy might have found access to data elsewhere that I have not yet obtained.
*** Off-Topic *** Although I can't consider myself a true Buckeye, I did live in Ohio for four Years in the early 1990s when I was in College outside of Dayton, and was heavily involved in Labor and Environmental activism at that time, as well as to a lesser extent Civil Rights and the Student Movements, and still have much love and appreciation, and interest for the people of Ohio, as well as election related stuff, so it's a real pleasure to see and interact with so many Atlas Ohio posters, such as yourself on this thread....
Here's why your question(s) are virtually impossible for me to address at this time:
1.) Badger Question: How do the various counties current share of the district's early vote compare to their share of the early vote at this time prior to the 2014 and 2012 elections?
Ohio does not appear to have any type of central archive of Early Voting by Date
There are some States where we can pull up this data for a current election, and even a few that will have this data available for historical elections, but Ohio does not appear to be one of these States.
Hence, trying to assess the EV numbers by date is simply not feasible, unless I'm missing some key links somewhere, or if this data is stashed in some Google Archive somewhere....
2.) Badger Question: Would those numbers be at least a reasonable indicator of what the final share of each counties vote will be after election day?
Although I don't believe we can forecast the total post-election vote-share by County based upon the *current status of EV voting by previous party primary voting TO DATE *, we might well be able to forecast what % of the vote will be absentee vs Same-Day for portions of OH CD-12 within the various Counties....
Even there it start's get slightly problematic within the context of a Special US-House Election, since we can pull '12/'14/'16 numbers for total breakdown by ED/EV (ABS PAPER, ABS IVO, EDAY PAPER, EDAY IVO, & PROV) by County, but shifting patterns of Early Voting can make it difficult to estimate how this will look this August....
For example, within Franklin County portions of CD-12 there was a much rate of ED voting in '14 compared to '12 and '16. (I'll get back to Franklin County shortly).
Once of the challenges that I struggled with, as well as many other analysts struggled with in the AZ CD-08 Special Election was what Total Vote number would look like.... we pulled data from previous elections within the district, but it turned out AZ voters in CD-08 ended up voting much more heavily by Mail than normal, so we needed to adjust our total turnout and total voter models to accommodate, and even on election eve many of us (myself included) were overestimating the Same-Day vote.
Is OH-12 necessarily any different???
3.) Badger Comment #3: I ask because signs that Franklin County is outperforming its usual share, and by how much, are going to be every bit as key as O'Connor's margin there, frankly.
So pretty much all of us on this thread realize that Franklin County will be key to any potential Dem upset in a traditionally or "Ancestral Republican" part of Ohio....
As my somewhat detailed breakdown of the Franklin County portion of CD-12 definitively shows, even in the precincts located within the City of Columbus typically do not vote heavily Democratic with a few recent exceptions....
Much of the CD-12 portion of Franklin County tends to be relatively Upper-Income / Upper Middle-Class Anglos, who tend to vote at much higher levels, even in off-year elections.
4.) Here's what I have pulled together regarding breakdown of voting by EV/ED for Franklin County from '12 > '16....
Let's start with the total PRES vote in '16 by Vote Type (ED/EV) for ALL precincts in Franklin County...
The reason for this is that HRC way outperformed the DEM for OH CD-12 even within the Franklin County Precincts part of CD-12, so it gives us a snapshot, since I can't roll the numbers by precinct/place for EV within OH CD-12 being Franklin County and all that....
()
Now, let's look at the % breakdown by Vote Type for all precincts in Franklin County for US PRES '16 by Party....
()
Ok--- Check, so what does this tell us???
A.) DEM PRES voters in Franklin County (All) voted absentee at a higher number than Republicans vs ED votes....
BUT, look at the EV-IVO numbers vs the EV-Paper numbers....
DEMS in Franklin in '16 were less likely to mail in their ballots than go to an early in person voting center....
So obviously we see that Early Voting in Franklin County favors Republicans in Mail-in-Ballots and Dems do better with "In-Person" Early Voting.
B.) Now let's take a peak at the 2016 breakdown by Vote Type within the CD-12 portions of Franklin County....
()
Now let's look at the chart to see the distribution of voter type (EV/ED) for the OH-CD-12 Franklin County votes as a %.
()
So what does this tell us?
A.) Overall Absentee voting was higher for the Congressional Election in '16 in the CD-12 portions of Franklin County than in other parts of the County.
Roughly 48% of Dem ballots were cast early vs 36% of Pub ballots cast early...
'Pubs actually improved on their ABS-PAPER ballots, but lost ground on their ABS-IVO numbers....
Also, interesting to note for anyone concerned about 3rd Party Ballots in this election in Franklin County, they tend to be much more prone to vote on Election Day (ED) rather than EV.
Now, let's take a look at how Franklin Co CD-12 Voters chose to cast their ballots in 2014 for the US House Race....
()
Let's take a peak at the % of vote-types by party candidate for CD-12...
()
Pulling up 2012 for OH-CD 12 Franklin Co....
()
Let's look at the % of Vote TYPE BY CD-12 and PARTY in 2012....
()
OK--- anybodies brain hurting yet? Mine is from trying to pull this all together, and we're only talking about Franklin County CD-12 precincts and "Voting Types"...
So to summarize:
1.) We really need to understand the current breakdown of absentee voters within Franklin County by ABS-PAPER vs ABS-IVO, at this current time and to the lead-up to E-Day before basing estimates solely upon ABS (EV) voters to date.
There appears to be a much stronger correlation between support for a Democratic Candidate with ABS-IVO voters than ABS-PAPER voters within Franklin County, and within the CD-12 precincts within Franklin County.
Anyone have these numbers available and is there a way to track this through E-Day?
2.) In "Off-Year" Elections, the total ABS voters % decreases dramatically compared to PRES election years within CD-12.
Many voters in off-year elections simply vote ED or VbM rather than EV'ing in person....
In fact the % of DEM/REP US-House voters was actually pretty close in '14 compared to '12 and '16, mainly because of a dramatic drop-off in DEM ABS-IVOs.
3.) As I have stated before in different ways, we really don't have any decent modelling of what a DEM victory would look like in CD-12 other than some County level benchmarks pundits have thrown out, and also this 60% EV number that keeps floating around Atlas, although I haven't yet seen any type of actual statistical data to support this other than some generalities regarding OH-ALL EV voting patterns in PRES election years....
The limited amount of data we do have thus far appears to indicate that Franklin County is looking pretty decent compared to historical voting patterns within CD-12.
Unfortunately, not being able to break down the '16 PRES numbers by CD-12 within Franklin County for EV/ED voters makes it much more difficult to assess, considering how DEM's traditionally lose House elections by big margins, even in a hypothetical massive swing portion of Franklin County ('12 > '16 PRES swings).
4.) It does appear that something is happening within the Franklin County precincts of CD-12, where we will likely see a massive amount of both Turnout, Raw Votes, and unprecedented DEM margins for a down-ballot election, but will it be enough????
Title: Re: NOVA GREEN's Election Analysis Thread
Post by: NOVA Green on July 29, 2018, 01:35:43 AM
Before I forget and move on to another County within CD-12, I thought it might be interesting to the run the numbers for US-PRES in the smaller places in Franklin County from 2004 to 2016.
I can't include Columbus, which accounts for roughly 50% of the Franklin County section of CD-12, because of precinct changes and all of that stuff... :(
Still, we can see how Dublin, Gahanna, Westerville, and Worthington voted from '04 > '16 at the Presidential Level....
Collectively these Cities account for roughly 40% of the CD-12 Franklin County Vote Share, and tend to be a bit more Republican even than the somewhat swingy with 'Pub lean portion of Columbus, Ohio located within the district.
()
()
1.) Dublin--- 2nd largest City in Franklin County (Pop 42k, 78% Anglo, 15% Asian, MHI $113.2k/Yr, 78% Degree > High School, heavily White-Collar Professional Occupations)
2.) Gahanna- (Pop 33.6k), 83% Anglo, 11% African-American, MHI $71.2k/Yr, 54% Degree > High School, Occupational sectors skew more Middle-Class
3.) Westerville- Pop 36.8k (3rd largest City in Franklin County), 85% Anglo, 8% African-American, 60% degree > High School Diploma, MHI $82.1k/Yr, Occupational Sectors mix of Upper Middle-Class and Middle-Class
4.) Worthington- Pop 13.5k, MHI $ 86.9k/Yr, 92% Anglo, 72% > HS Diploma Occupations skew a bit Upper Middle-Class....
Looks like maybe it might have some overlap with Professors and Administrators working at Ohio State University????
Regardless, this little chart shows how rapidly how the suburbs of North Franklin County are shifting away from the Republican Party at the Presidential Level....
We have yet to see them shift hard DEM for other down-ballot races, but if O'Conner pulls this out, it will likely be within these communities.
Title: Re: NOVA GREEN's Election Analysis Thread
Post by: NOVA Green on July 29, 2018, 01:36:37 AM
Ok--- Time to do an initial survey of Delaware County to see what the Tea Leaves might indicate for this upcoming Special Election....
Let's start with US Presidential Election results by place 2004 to 2016.
()
Now, let's take a look at this same data in a graphical format.
()
Time to look at a summarized chart of the Vote Share by Place '04 > '16
()
So what is the takeaway from these three data points?
1.) The vast majority of voters within Delaware County do not reside within Cities as their municipal jurisdiction.
Roughly 71% of the voters between '04 and '16 have Townships as their Primary Political Jurisdiction....
Although this might appear as a bit of semantics the reality is that in many parts of the Country this creates an additional level of removal from the "Cities" when it comes to everything from Taxation, Zoning, Policies and regulations that cover everything from waste disposal to how often you mow your lawn, etc.... almost like living in an HOA, except many of these policies are enforced by the Governmental Jurisdiction, rather than the Home Owners Association.....
2.) Within the Cities of Delaware County we are increasingly seeing movement towards the Democratic Party at the Presidential Level in terms of RAW VOTE margins....
For example the growing sliver of the City of Columbus within Franklin County has been increasingly moving Dem in raw vote Margins, and we are also observing a significant decrease of 'Pub raw vote numbers in Dublin and Westerville.
I'll need to take another look at Delaware City, since the '16 PRES numbers look a bit odd, and just validate that I didn't accidentally include Delaware Township precincts from '16 in with Delaware City Precincts....
It could just be that the Delaware City portion of the County grew in the form of a large new subdivision, which actually would make sense with the increased vote share from '12 > '16.
3.) It's pretty clear just looking at the raw vote numbers that a DEM candidate will need to keep Delaware County RAW VOTE numbers down to something more like a +8-10k R margin, even if the DEMS are banking serious margins in Franklin County.
OK... Let's roll a few % numbers....
Now here we have the % of Vote by Party for US PRES Elections '04 > '16 by Place.
()
Look carefully at these % numbers, especially the "OTHER" numbers that after all account for ~ 70% of the County Vote.
Delaware City looks even fishier here, and I'll go back and validate that and move the data and charts around if there was a filter error with potential inclusion of Delaware Twsp data....
Still the fundamentals stand... we are continuing to see a significant erosion of Republican support at the US-PRES level even in the most 'Pub portion of the County (Townships).
Let's look at this same data in a graphical format...
()
I'll post a swing map later by place, but really the key take-away here, is that it is entirely possible that the Democratic Candidate in CD-12 will win big in the "Cities" (30% of the County Vote Share), lose in the Townships, but keep Delaware County Close enough so that Franklin County can erase the Republican vote margins from the other Five Counties within CD-12.
Next Stop, I'll take a more detailed look at the Townships of Delaware County, since this appears to be potentially Ground Zero of overall Delaware County margins in the Special Election.
Title: Re: NOVA GREEN's Election Analysis Thread
Post by: NOVA Green on July 29, 2018, 01:37:34 AM
I have been slightly remiss in my responsibilities when it comes to covering the Cities of Delaware County....
Although previously we touched on the Columbus, OH Dublin, OH, Westerville Franklin County Side, and we have 12% of the Delaware County Vote Share from these same three Cities, we have a few new Cities not yet discussed.
Delaware City---- 17.1% of the 2016 PRES Vote Share in Delaware County.
()
MHI- $57.0k/Yr
Educational Attainment- 42.3% > HS Diploma, 50.1% HS Diploma
Race/Ethnicity: 91.3% Anglo-American, 3.2% African-American, 1.9% Latino-American
Occupations:
()
Politically this City is a bit surprising when looking at the 2016 Presidential Election results....
()
Here is a more graphical interface that looks at margins and swings....
()
IF anyone can explain what happened in Delaware Ohio (The CITY) and the home of Ohio Wesleyan University between '12 and '16 at the US PRES level, I would be most interested, since this City will be key to any potential Democratic victory in OH CD-12.....
Next stop I'll need to look at the City of Powell, Ohio before I start delving into the Townships, since although I didn't include it on my list of the Cities of Delaware County, it definitely fits the profile of a potential massive swing place even in a Special US-House Election
Title: Re: NOVA GREEN's Election Analysis Thread
Post by: NOVA Green on July 30, 2018, 09:18:00 PM
Yet one more important City in Delaware County in the upcoming CD-12 Special Election, which accounts for almost 7.0% of the entire County Vote Share.
Powell, Ohio---- Pop 11.8k, MHI $132.6k/Yr, 78% Degree > HS Diploma (!!!), 86.3% Anglo-American, 10.0% Asian-American.
()
Relative Occupations skew extremely Upper-Middle Class:
()
How did Powell, Ohio vote at the Presidential level from 2004 to 2016, and what trends have we observed over the past 12 Years of Presidential Elections?
()
So here we starting to see beginnings of the narrow sliver chance of a DEM upset win in OH CD-12, where even in areas that have been swinging and trending DEM at the PRES level (ESP by Ohio standards), have still tended to overwhelmingly support Republicans at the State and Federal down-ballot levels....
Math goes basically something like this, rack up huge margins within the Franklin County portion of the district especially within the City of Columbus Precincts, continue to expand DEM margins in Dublin, Westerville, Worthington, AND win by comfortable margins within the Cities of Delaware County that account collectively for ~ 35% of the County Vote Share (Columbus, Dublin, Powell, Westerville, and Delaware City)....
Now, there's obviously something missing in the math here, namely the high population Townships within Delaware County (Orange, Liberty, Genoa, and Concord) that account for an additional 42% of the County Vote Share.
Remember, Democrats don't need to WIN Delaware County to win CD-12, just keep 'PUB RAW VOTE margins down enough to allow FRANKLIN County to provide a solid enough buffer to overcome the PUB raw vote numbers from the other heavily TRUMP Counties within the District.
Title: Re: NOVA GREEN's Election Analysis Thread
Post by: NOVA Green on July 30, 2018, 09:19:18 PM
Let's now take a look some of the Townships within Delaware County....
1.) Orange Township---- 13.3% of Delaware County Vote Share
()
Basic US Census Stats as always----
Pop--- 26.9k, MHI $102.1k/Yr, 77.7% Anglo-American, 10.5% Asian-American, 6.4% African-American
Education: 67.0% Degree > HS Diploma
Let's take a look at relative occupations....
()
OK--- Fits the profile of a place in CD-12 where potentially the Republicans have not yet hit rock bottom, especially at the down-ballot level in the era of Trump.
How has Orange Township voted over the past Four Presidential Elections and are there any swings or trending that might play to a DEM advantage in this Special Election???
()
So, Orange Township definitely fits of the profile of a '16 PRES > '18 OH-CD-12 flip community, which if it happens would significantly increase the DEM candidates goal of keeping PUB margins low in Delaware County.
2.) Genoa Township---- 14.0% of the 2016 Delaware County Vote Share (!!!)
()
US CENSUS STATS:
Pop: 23.7k, MHI $116.6k/Yr, 89.0% Anglo-American, 4.0% African-American, 3.4% Asian-American
Education: 71.3% Degree > HS Diploma
Relative Occupations:
()
How did Genoa Township Ohio vote for US PRES '04 to '16???
()
So although there was only a +24% DEM PRES swing between '04 and '16 in Genoa Township compared to a +27% DEM PRES swing between '04 and '16 in Orange Township, there are more favorable ethnic/racial demographics in Orange than Genoa, and quite likely Anglo-American voters swung equally hard in both municipalities but with a much lower DEM baseline in Genoa than Orange.
Still, Trump captured slightly less than 55% of the Vote in '16 here, so even assuming it stays PUB in the Special Election, we still see which direction the wind is blowing in the Era of Trump....
OK--- we now have two additional Townships in Delaware County (Liberty and Concord) that collectively account for about 14.9% of the TOTAL DELAWARE COUNTY VOTE-SHARE.
These Townships are even more Republican than Orange and Genoa, and will likely be the places where the 'Pubs will try to maximize their RAW VOTE margins within Delaware County, assuming that this election is maybe somewhere in the order of +2-5% R once all the votes are counted.
Give me a few minutes to grab a Cig, make a few moves on the Chessboard, take a sip of Bourbon, and I'll take a look at those two Townships.... :)
Title: Re: NOVA GREEN's Election Analysis Thread
Post by: NOVA Green on July 30, 2018, 09:20:20 PM
Time to Move over to Liberty and Concord Townships....
Liberty Township--- 9.2% of Delaware County Vote Share.
Pop--- 26.8k
MHI: $123.8k/Yr
Race/Ethnicity: 88.0% Anglo-American, 7.6% Asian-American, 2.5% African-American
Education: 72.8% Degree > HS Diploma
Relative Occupations:
()
How did Liberty Township Vote for US PRES 2014 to 2016???
()
So here we see the Democratic Candidate starting from a lower base-line number, and although there was a +22.6% Dem PRES swing between '04 and '16, it was still a bit lower than in Orange and Genoa Townships....
Interestingly enough, this doesn't appear explainable simply upon the Social-Demographic comparative numbers that I pulled for the other two Townships.
Still, the relatively close comparative US-PRES swing margins, would appear to indicate that *IF* a DEM US-HOUSE Candidate were to increase margins in Orange and Genoa, that these swings might well be relatively comparable in Liberty Township.
CONCORD TOWNSHIP--- 5.7% of the DELAWARE COUNTY TOTAL VOTE SHARE
POP- 9.5k
MHI- $ 127.8k/Yr
Race/Ethnicity: 86.8% Anglo-American, 6.7% Asian-American, 3.5% African-American
Educational Attainment: 66.4% Degree > HS Diploma
Relative Occupations:
()
How did Concord Township Vote for US PRES 2004 to 2016???
()
Concord Township sort of stands out here, even compared to Liberty Township when looking at the Social-Demographic Data...
It only swung +15.5% D at the US-PRES level between '04 and '16 compared to much larger swings in the other key suburban/exurban Columbus Townships of Delaware County.
Unfortunately I can't explain the reasons, and I'll let some of the more knowledgeable Buckeyes or resident Ohio experts explain since other than Ancestral Republican History, there tons of variation between the Social-Demographics of these Four Townships (Other than Educational Attainment rates a bit lower in Concord Township than those of the other "Big Four" Townships of Delaware County.
Title: Re: NOVA GREEN's Election Analysis Thread
Post by: NOVA Green on July 30, 2018, 09:21:53 PM
Now, let's take a look at the overall Delaware County Vote Share in 2016:
()
I have covered 80% and we have 20% remaining, basically the Rural Townships and Villages for the most part.
Let's look at the 80% that is Metro Columbus with RAW vote numbers....
()
The rurals that are only 20% of the total County vote accounted for almost 50% of PUB margins in the '16 PRES election.
Here are the % numbers by Metro Delaware vs Rural...
()
So--- anyone who doubts that the DEM REP in CD-12 could hit 50% in the METRO portions of the County, hasn't been paying attention.
I haven't spent too much time playing with the Rural Townships, but there are definitely some Obama '12 > Trump '16 voters floating around, without even going back into the Weeds of the '04 General Election....
Still, swings are more likely to happen in the METRO PARTS of DELAWARE than RURAL, but one can certainly see how DEMs could keep PUB margins low in DELAWARE and steamroll over the remaining counties solely on the back of FRANKLIN County numbers.
()
I have covered 80% and we have 20% remaining, basically the Rural Townships and Villages for the most part.
Let's look at the 80% that is Metro Columbus with RAW vote numbers....
()
The rurals that are only 20% of the total County vote accounted for almost 50% of PUB margins in the '16 PRES election.
Here are the % numbers by Metro Delaware vs Rural...
()
So--- anyone who doubts that the DEM REP in CD-12 could hit 50% in the METRO portions of the County, hasn't been paying attention.
I haven't spent too much time playing with the Rural Townships, but there are definitely some Obama '12 > Trump '16 voters floating around, without even going back into the Weeds of the '04 General Election....
Still, swings are more likely to happen in the METRO PARTS of DELAWARE than RURAL, but one can certainly see how DEMs could keep PUB margins low in DELAWARE and steamroll over the remaining counties solely on the back of FRANKLIN County numbers.
Title: Re: NOVA GREEN's Election Analysis Thread
Post by: NOVA Green on August 05, 2018, 08:24:51 PM
Now that I've spent tons of time and thread space focusing on two major counties (Franklin and Delaware) that collectively account for 60% of the CD-12 Vote Share between '12 and '16, both of which are overwhelmingly dominated by the City, Suburbs, and Exurbs of Metro Columbus, it's time to pivot over to another County that accounts for ~20% of the Vote Share of CD-12, as part of the "Tale of Two Cities" or in this case "The Tale of Two Ohios"...
Licking County could well play a significant role not only in any potential Democratic upset in this particular CD, but perhaps more significantly as a representative of a fairly Republican County in Ohio, where Obama performed quite well in both 2008 and 2012.
()
I could also throw in a chart of what these actual % changes look like in terms of raw vote margins, but suffice to say that in a GE PRES election in 2012 Obama lost Licking by ~ 12k votes versus HRC losing by ~ 24k Votes, so even in a pretty solidly 'Pub County at the PRES level significant changes on the % margins make a HUGE deal, even in relatively low turnout OH-State and US-House elections.
Now let's look at the overall Licking County Votes for US-Senate between '04 and '16...
()
So right here, we can see that even Prior to Obama's performance as the DEM-PRES candidate in '08 and '12, we see Sherrod Brown almost tied with Mike Dewine in the '06 US-SEN battle.
Even in the 2014 race for OH- State Treasurer, we see the Dem capture 39% of the vote, in an extremely Republican Year within Ohio.
Ok---- let's take a brief look at Licking County Ohio... (I know most of y'all that post on here are seasoned vets, so apologize my running some Demographic numbers for the lurkers both within and outside of Atlas... ;) )
Licking County--- OHIO
Pop: 167.0k
Race/Ethnicity: 92.2% Anglo-American, 3.3% African-American.
MHI: $55.1k/Yr
Education: 30.0% > HS Diploma, 59.2% HS Diploma
Age: 14% > 65+ Yrs, 21% 50-64 Yrs, 20% 35-49/Yrs, 19% 18-34/Yrs
Educational Attainment Breakdown:
()
Relative Occupational Breakdown:
()
So--- anyone starting to see why Licking Counties and others like this in Ohio can be extremely swingy despite an inherent Republican lean?
Overall the County is relatively well educated in terms of post high-school degrees, including the much vaunted Working-Class ideal of getting a practical Vocational/Professional Two Year Degree that translates almost immediately into a decent job, and not being stuck in Mountains of student loan debt.
NOW: Where are the Voters located within the District in terms of comparative Vote-Share?
I'll start with just the largest City within Licking, County....
Newark, OH--- 22.8% of Licking County Vote Share 2016 PRES
Pop: 47.7k (29.0% of County Population)
Race/Ethnicity: 92.0% Anglo-American, 3.3% African-American
MHI: $38.3k/Yr
Education: 23.7% > HS Diploma, 62.5% HS Degree
Age: 14% > 65/Yrs, 12.5% 55-64/Yrs, 26% 35-54/Yrs, 24% 18-34/Yrs...
Newark, OH--- Relative Occupations---
()
Now, let's take a look a relative industries in Newark, considering that it's a bit odd that overall Demographic mirror the County numbers, with the exception of MHI and Education...
()
Maybe the Cities largest employers might explain that???
()
Ok--- now let's check out a few of the election numbers from Newark, Ohio for a few election races...
Newark, OH--- US PRES 2004 to 2016....
()
So here we see an interesting representation of the complexities of OH-PRES election politics in recent decades....
This is a City in Ohio that swung towards Obama between '08 and '12, who received a much larger % of the Dem Vote than Kerry in '04 (I have a full set of OH 2000 precinct numbers floating around somewhere and would be interesting to add them to the mix), AND these Democratic gains were essentially wiped out with an unpopular Democrat running against a less-unpopular Republican around here....
Just dipping my first toe into the waters of Licking County, but if you're going to find "Ancestral Dems" that swung harder Trump, Newark City would certainly be a place where I would be interested in examining after the CD-12 Special Election, and certainly in the 2018 GE to see if the winds are blowing back against the Republicans, and if so to what extent...
I'll try to pull a few more summaries of Licking County before the Weekend to summarize, and hopefully maybe another County before E-Day....
Didn't start pulling the precinct data until a few weeks back, and have a full-time job, family and all that, so haven't been able to get into as much detailed election results as I would normally like to do.
Title: Re: NOVA GREEN's Election Analysis Thread
Post by: NOVA Green on August 06, 2018, 08:35:36 PM
Yesterday I posted some data for Licking County as well as the largest City Newark to see what the numbers might indicate regarding the Obama '08 and Obama '12 voters who swung hard to Trump within the County in the upcoming Ohio US House CD-12 might do.
We saw that Obama narrowly lost Newark in '08, narrowly won it in '12, and it swung to Trump by +20% in 2016!
Now let's look at the overall Vote Share by place within Licking County.
()
What is chart tells us is that there are actually quite a decent percentage of the County population that resides in a relatively small number of Cities, and a few larger higher density townships.
Here's a Licking County Township city/map that has 62% of the County Vote Share bordered with a darker Black border.
Yesterday I posted some data for Licking County as well as the largest City Newark to see what the numbers might indicate regarding the Obama '08 and Obama '12 voters who swung hard to Trump within the County in the upcoming Ohio US House CD-12 might do.
What is chart tells us is that there are actually quite a decent percentage of the County population that resides in a relatively small number of Cities, and a few larger higher density townships.
These are clustered in two areas:
1.) SW-Licking which is fairly exurban Columbus
2.) The City of Newark and surrounding suburbs.
Here's a Licking County City/Township Map that illustrates this, with these two areas illustrated by a darker border...
()
Now let's look at the US-PRES 2004 to 2016 breakdown by "City" and "Rural" precincts within the County, and the Total Vote Margin.
()
Although we don't really have any recent history of "Ancestral Democratic" major strengths in Licking County, we do see that there are quite a few Obama '08 / Obama '12 / Trump '16 voters in both the "Cities" and "Rural" areas....
In the SW Licking & "Metro Newark" areas Obama was able to keep Republican raw vote margins extremely low in both '08 and '12, only +3.5- 4.6k Republican....
This would obviously the path for O'Connor to try to minimize over Republican margins in Licking County....
I doubt we'll see nearly as much movement in the rural parts of Licking County this coming Tuesday where there are simply a ton of Bush W. / McCain / Romney / Trump voters....
Here's a vote by City/Rural Graph as a % of US PRES by Party 2004 to 2016 to further illustrate the point:
()
Licking County RAW VOTE MARGINS matter, and former Kerry/Obama/Obama/Trump voters in the Cities/exurbs of the County might be a decent shake to keep down Balderson numbers in Licking and flip the District in a few days or November...
Title: Re: NOVA GREEN's Election Analysis Thread
Post by: NOVA Green on August 06, 2018, 08:38:57 PM
Great post as always, Nova. Let me offer some trivia, being familiar with the county, albeit not a resident.
Granville is the home of Dennison University, and not-coincidentally quite Democratic. It regularly appears as a (non-Atlas) blue splotch on an otherwise largely red election map.
Reynoldsburg in the SW is split. Democrats failed in 2015 in a major push to win the mayoral race and council majority, but it votes Democratic at the presidential and federal level. It's a city where Republicans years are numbered at the local level. However, the city is actually divided between Licking, Fairfield, and Franklin Counties, and the Licking County portion is IIRC at least somewhat more Republican than the City as a whole. I'm tempted to say O'Conner needs to win the district's portion of Reynoldsburg, or at least come real close, to win the race.
Between annexation and suburban growth, Pataskala has become the second largest city in the county after Newark. It's still reliably Republican, though not quite as overwhelmingly as before.
If O'Connor wins Reynoldsburg and Newark, even narrowly, he should be alright.
Badger--- Thks as always for your insightful analysis, as well as your contributions as one of Atlas resident Subject Matter Experts (SME) when it comes to the great state of Ohio.
Here are the US-PRES '04 to '16 numbers from Reynoldsburg.
()
The Licking County portions of the City are moving Democratic at a PRES level faster than a Hound Dog on a Fox Hunt in the Shires of the UK....
Here are the '04 to '16 US PRES numbers from Granville Village....
()
Crazy comparing and contrasting '04 vs '16....
Although my PC is overheating, so I'll need to shut-down and restart right now, it's pretty cool for the Dems that they are seeing these types of massive swings among College Educated and Suburban Anglos in Ohio, still even with these types of massive swings in certain parts of Licking County, we have seen even more massive swings between '12 > '16 in areas accounting for a much larger chunk of the Vote Share....
The key to a Democratic Hypothetical Victory in OH CD-12 runs through an extremely narrow pathway that combines both the massive shifts in relatively educated and upper-middle-class Anglo "Metro" voters combined with Obama Democrats in the Cities and smaller communities of "Downstate CD-12), for whom for many Ancestral Republicans he was one of the only Democrats they had ever voted for at a Presidential Level, as well as occasionally voting for DEMs on down-ballot races.
This is one of the tricky dynamics of this race that makes it perhaps a bit more like PA-18 than AZ-08....
Honestly it doesn't completely surprise me, having had the privilege and pleasure of having lived Four Years in the Buckeye State as a Young Man in the Mid '90s, somewhere roughly between Columbus, Dayton, && Cinci.
"Ancestral Democrats" in many of these places will be key--- regardless of 1992/1996 PRES Votes, we can still look at the '00 to '16 Votes....
If Trump shows up at Orange Township in Delware County, and his 'Pub loses the OH CD-12 SE that will be monumental....
Title: Re: NOVA GREEN's Election Analysis Thread
Post by: NOVA Green on August 06, 2018, 08:41:13 PM
Great post as always, Nova. Let me offer some trivia, being familiar with the county, albeit not a resident.
Granville is the home of Dennison University, and not-coincidentally quite Democratic. It regularly appears as a (non-Atlas) blue splotch on an otherwise largely red election map.
Reynoldsburg in the SW is split. Democrats failed in 2015 in a major push to win the mayoral race and council majority, but it votes Democratic at the presidential and federal level. It's a city where Republicans years are numbered at the local level. However, the city is actually divided between Licking, Fairfield, and Franklin Counties, and the Licking County portion is IIRC at least somewhat more Republican than the City as a whole. I'm tempted to say O'Conner needs to win the district's portion of Reynoldsburg, or at least come real close, to win the race.
Between annexation and suburban growth, Pataskala has become the second largest city in the county after Newark. It's still reliably Republican, though not quite as overwhelmingly as before.
If O'Connor wins Reynoldsburg and Newark, even narrowly, he should be alright.
Granville is the home of Dennison University, and not-coincidentally quite Democratic. It regularly appears as a (non-Atlas) blue splotch on an otherwise largely red election map.
Reynoldsburg in the SW is split. Democrats failed in 2015 in a major push to win the mayoral race and council majority, but it votes Democratic at the presidential and federal level. It's a city where Republicans years are numbered at the local level. However, the city is actually divided between Licking, Fairfield, and Franklin Counties, and the Licking County portion is IIRC at least somewhat more Republican than the City as a whole. I'm tempted to say O'Conner needs to win the district's portion of Reynoldsburg, or at least come real close, to win the race.
Between annexation and suburban growth, Pataskala has become the second largest city in the county after Newark. It's still reliably Republican, though not quite as overwhelmingly as before.
If O'Connor wins Reynoldsburg and Newark, even narrowly, he should be alright.
Let's take a look at the other Cities / Larger Townships within Licking County:
Granville Township:
Tends to skew a bit younger (College Students?) but still with a fairly high % of residents 35-54 Yrs. MHI = $ 92.8k / YR (Upper Middle-Class). Educated 67% with degree > HS. Occupations- 16% Education (!!!)
()
So this is very interesting... Obama actually did significantly worse here than Kerry or Clinton, and 'Pubs carried it by ~ +10% in '08 and '12 and it was basically virtually tied in '04 and '16.
I don't know what the % of the student vote was in the Township versus Granville City, but still one would imagine that the Township is a place where O'Connor might well break even.
Heath- Ohio--- Pop 10.4k--- 6% of County Vote Share
Skews Middle-Aged and Older. MHI $43.7k/Yr. 91% White. 27.1% Degree > HS, Occupations skew heavily working-class (Material Mvmt, Food Services, Transportation, Repair) as well as "pink collar" (Administrative).
()
So again we have a City in the district with a fairly decent proportion of Obama > Trump voters, as well as a decent % of Kerry '04 voters (40%).
The question remains to what extent O'Connor will be able to get close to the 40% Dem Vote here, to keep overall PUB margins low in the Cities of Licking County.
Now, let's look at the larger population centers of SW Licking County (I already previously covered Reynoldsburg precincts within Licking County).
Pataskala- Pop 15.0k- 9.0% of Licking County Vote Share
()
So as we can see from the satellite imagery, this City is actually basically the equivalent of an entire township, with a mixture of suburban neighborhoods in the SW corner of the "City", and more clustered population in the Eastern Central part of the "City", with some smaller developments dotted around along some of the main roads, some nice ritzy semi-rural Exurban homes scattered around, and even some farms mixed in around the "City".
Let's look at the age breakdown of Pataskala:
()
So interestingly enough we actually see a fairly decent cluster of the population clustered in that 25-54 Year Old range, and perhaps most significantly within the context of this election, a very high concentration in the 25-39 Yr age bracket (23%). These voters will likely be critical in determining the overall margins within the City this coming Tuesday.
MHI- $ 65.6k /Yr with 55% of the Households making > $60k/Yr.
Education: 34.1% > HS Degree
Occupations:
()
So interestingly enough the occupations are a bit all over the place--- one the one hand you have a pretty decent White Collar representation in generally high paying occupations (Business and Management), but you also have a decent representation of relatively decent paying Blue Collar Occupations (Transportation & Construction), and also a hefty chunk of "Pink Collar" occupations (Administrative & Social Services).
Enough of this---- how has Pataskala been voting in recent Presidential Elections?
()
So, once again we see a pretty decent contingent of Obama '08 / Obama '12 /Trump '16 voters within Pataskala. HRC pretty much destroyed all of the gains that Democrats had made since '04, significantly under-performing John Kerry. On the flip side, although Trump bagged 61% of the Vote in 2016, he still performed worse than George W. Bush in his re-election campaign in 2004.
If O'Connor can revive the Obama '08/'12 coalition in Pataskala of educated Upper-Income voters, and more traditionally working class occupations, he might be able to keep PUB margins down to +12-15% in the Special Election.
As an Exurban Columbus community, one might imagine this would be a place where we could see some major swings compared to the 2016 US PRES results.
Etna Township- Pop 16.3k- 5% of 2016 Vote Share
()
Those giant white buildings you see in the Center of the Township is a major Amazon Fulfillment Center, and having worked in an FC before for another company, I know how rigorous Warehouse Work can be with 7x24 Hour Operations running 10-12 Hour shifts frequently the industry norm.
Age: 10% 65+, 10% (55-64), 33% (35-54) (!!!), 19% (18-34), 28% (0-17).
Wow--- look at that concentration in the 0-17 Yrs and 35-54 Yrs!!!!
Race/Ethnicity: 78.6% White, 13.9% Black, 2.9% Latino, 2.3% Mixed, 2.0% Asian
Cool--- finally we get a place in Licking County where the Brothers and Sisters are properly represented! This trend will likely continue, considering that the African-American population is most heavily concentrated in both the younger age bracket (0-17 Yrs), as well as the Millennial and Middle-Aged demographic brackets.
Education: 39.1% with Degree > HS. Township is a bit more Educated than average.
MHI: $ 75.7k/Yr
Occupations:
()
Hmm interesting--- we see an extremely high level of White Collar highly compensated occupations, compared to what I was expecting.
We do have a decent range of Blue Collar occupations in Transportation and Repair, as well as a slightly higher proportion of occupations in Administrative and Sales than the norm.
How did Etna Township Vote in the 2004 to 2016 US-PRES elections?
()
So, interestingly enough Etna Township in *Theory* should be significantly more Democratic than Pataskala City, when looking at everything from MHI, Education, Occupations, and Race/Ethnicity.
This is obviously not the case.
To say that Etna Township is solidly Republican would likely be a significant understatement....
Obama only kept the PUBS down to 62% of the Total Presidential Vote in '08/'12. John Kerry only captured 1/3 votes and DJT even exceeded GHWB '04 PUB % in Etna Township.
I don't know why exactly this Township has been so consistently Republican, but it is pretty clear that White voters tend to vote overwhelmingly Republican at all age, income, and occupation levels, compared to most of the larger population centers of Licking County.
O'Connor will be lucky to keep the PUB margins here down to +20% R.
Harrison Township - Pop 7.6k- 6% of Licking County Vote Share.
()
Ok--- Looking at the satellite imagery, this Township is an interesting smorgasbord of decent sized Exurban Housing Developments around places like Beechwood Trails, as well as smaller sub-divisions along many of the local roads, throw in a quite a bit of what looks like farming areas (Although as a former OH resident, sometimes these farms are really a part-time gig for local farmers that have other day jobs and just make some extra bucks hiring a few people to run the agricultural tools during key parts of the season).
Age: Pop is extremely young 23% (0-17 Years), Millennials under-represented 14% (18-34 Yrs), 33% (35-54 Yrs),
Race/Ethnicity: 97.6% White
Much more lily White than most of the rest of Licking County, which has a pretty low rate of ethnic/racial diversity compared to many of the other medium-sized Counties within Ohio.
MHI: $ 77.2k/Yr
Not bad at all, and considerably higher than the Statewide Average.
Education: 38.9% > HS Diploma
Occupations:
()
So again, we see a pretty high share the work-force in relatively highly compensated White Collar Occupations (Legal, Mgmt, Business, Science, Computers/Math, etc)....
Interestingly enough we see the highest % of the work-force that are Firefighters of almost any place I've delved into in OH CD-12. We also see a higher rate of Educational Occupations than in many other places, so sounds like we have some Union Teachers floating around in Harrison Township (?).
How did Harrison Township Vote for PRES '04 > '16?
()
So.... if Etna Township is a tough nut to crack for O'Connor, Harrison Township is an even tougher nut.
On paper both Etna and Harrison Townships look like the types of places where we might expect to see significant Dem shifts within the context of the Trump era, but the reality is that voters in these two townships have not yet exhibited any tendency to indicate a large proportion of persuadable and swing voters that could dramatically change Republican margins.
Maybe Danny O'Connor could do it with the Irish family name:
Harrison Township: 16.1% Irish Ancestry
Etna Township: 17.9% Irish Ancestry
Pataskala City: 14.9% Irish Ancestry
Heath: 17.7% Irish Ancestry
Newark: 16.1% Irish Ancestry
Where I'm going with this is that within the context of Ohio and within Metro-Columbus, the Irish-Americans have faced systematic discrimination in terms of Housing, Employment, etc, and only in the 1960s and 1970s started to move into the Middle-Class without the stigma of Ethnicity and Religion (???) being a cudgel used to stop their advancement.
Although I tend not to dwell too much on Religious Affiliation (Plus the data is more obscure to pull down by a County/City level), the reality is that White Catholics (Especially "White Ethnics") have traditionally tended to be the major swing voters in Presidential Elections over the past xxx decades.
One must also wonder to what extent Danny O'Connor might be portrayed as part of the Franklin County Democratic machine in suburban/exurban Columbus Precincts.
Still, Irish-Americans tend to self-identify as overwhelmingly Catholic, and Pope Francis has moved the needle significantly to the Global Left on a wide variety of political issues, which is increasingly impacting the Catholic Community within the United States, when it comes to issues such as economic justice and inequality, environmental issues, immigration and social change within the wealthy nations of Europe and North America, etc...
Even Social Issues such as Reproductive Rights (Birth Control), Divorce, and LGBTQ Equality have been re-framed by the Vatican within the era of Pope Francis.
I have no idea to what extent if any this will have an impact in the OH CD-12 Special Election, but still I wonder to what extent Danny O'Connor will significantly over-perform in certain precincts and communities with a High % of traditional "White Ethnic Catholic Swing Voters" this coming Tuesday.
Title: Re: NOVA GREEN's Election Analysis Thread
Post by: NOVA Green on August 06, 2018, 08:42:35 PM
So, one item that I have neglected to discuss thus far are the rural portions of Licking County, which account for roughly 38% of the Total County Vote in US Presidential Elections, and vote overwhelmingly Republican at virtually all levels.
2004: (66-34 R) +32% R
2008: (63-35 R) +28% R (+4% D Swing)
2012: (62-36 R) +26% R (+2% D Swing)
2016: (71-25 R) +46% R (+20% R Swing)
One thing that I've been wondering is how the impact of Trump's Tariffs on China will play out in Farm Country over the next few election cycles.
Here is the overall Agricultural Profile of Licking County.
()
()
()
So here we see the significance of Soybean Crops to the local agricultural sector, as well as Corn and grazing land tied to pig feeding, which is a pretty typical pattern in much of Ohio, and that part of the Midwest.
Let's look at the % of the work-force employed directly in the Agricultural Industry by Township within Licking County.
()
So here we see that direct agricultural related industries are predominately clustered in the NW portion of the County, as well as a few Townships in the Northeastern corner of the County.
Although overall direct farming related employment isn't that high, which is not completely surprising considering that Corn and Soybeans tend to be capital or machine-intensive forms of Agriculture rather than labor-intensive forms of agriculture, it still creates a disproportionate local economic impact on these communities because of all of the indirect jobs tied to farming.
So let's take a look at a few of these Townships with a higher than average agricultural related employment...
Burlington Township:
2012: (61-36 R) +25% R
2016: (73-24 R) +49% R (+24% R Swing)
Eden/Fallsbury Township:
2012: (60-40 R) +20% R
2016: (76-20 R) +56% R (+36% R Swing)
Bennington Township:
2012: (68-30 R) +38% R
2016: (74-22 R) +52% R (+14% R Swing)
Monroe Township:
2012: (67-30 R) +37% R
2016: (69- 25 R) +44% R (+ 7% R Swing)
So interestingly enough, although more heavily agricultural based townships tend to be overwhelmingly Republican, you do see some potentially persuadable voters that might chose to express their discontent with Trump's Agricultural/Trade policies at the ballot box in upcoming elections.
Now Agricultural isn't the only game in town in Rural Licking County....
Manufacturing is a significant employer in a cluster of Rural Townships located within the SE portion of the County, and in Five of the Six Townships bordered in RED is higher than the overall County Average of 12% of the Workforce.
These Five Townships represent 6.4% of the Licking County total vote share.
()
What I suspect is that in many of these Townships, Manufacturing Workers are employed in the Industrial Parks of Newark, although it is possible that there might be a Poultry processing plant in a few places (Perry Township???) would is also technically coded as Manufacturing Employment rather than Agricultural Employment.
How did the heavily manufacturing sector rural Townships vote in previous US Presidential Elections?
()
So here we see how Democratic and Republican raw vote numbers were relatively stable at the Presidential level until 2016, where suddenly the raw Republican vote margins jumped from roughly 1.5k R to about 2.8k R.
It will be interesting to see if the Trump phenomenon was a fluke in places like this, or part of a broader shift away from Democratic national candidates.
Now let's look at it from a % level to see how extensive the collapse of the Democratic Presidential vote was in 2016 in these rural manufacturing employed townships.
()
Yikes--- the Dems were getting 33-36% of the Vote in '04/'08/'12 and it plummeted to 22% with HRC as the Candidate. Pub Pres vote % was 61-66% and it surged to 71% in 2016!!!
Clearly we have a pretty significant number of "Ancestral Presidential Democrats" floating around in these parts, despite these Townships still being heavily Republican.
How will they vote on Tuesday and this coming November?
Title: Re: NOVA GREEN's Election Analysis Thread
Post by: NOVA Green on August 10, 2018, 08:15:03 PM
OH CD-12 EV Numbers to Date Elsewhere within Franklin Co....
Worthington---- 6.6% of 2016 Vote Share.
()
EV numbers look atrocious for PUBS even in a City that just recently started voting DEM for PRES in larger numbers in 2012.
Westerville-
()
This is a City that went +10% Mitt Romney in '12 and DEM margins are +20%, not even including the other vote in Early Voting!!!
I could pull up similar insane numbers for Dublin, etc.... but really I would not be surprised to see final Franklin County SE numbers looking extremely lopsided for O'Connor considering such an extremely poor Republican EV performance in Franklin County, which I suspect is NOT a typical scenario, and also how even relatively historically PUB friendly municipalities are not turning out their voters.
Next I think I'll take a look at the EV numbers by place for Delaware County and match against historical election results, to give us another election weekend teaser....
THANKS AGAIN EBSY!!!!
@ Badger: I now accept my accolades :P
Hey man, when did I ever doubt you that Franklin County turnout was going to kick butt for O'Connor? ;)
You were pretty skeptical for a while that OConnor could win Dublin or Westerville :P
I deny any recollection. :P
New Albany, yes. I think that hesitancy disappeared when I learned that Hillary actually carried Dublin and Westerville.
Really no idea where this race is going to go. Nova and Buckeye nut both make excellent points even if they tend to contradict. :P
The best I can say is that if O'Connor wins, come November the races at least lean O'Connor. Not even tilt. If he pulls this off, I can't imagine a democratic incumbent being thrown out barring Scandal like circumstances considering what November is likely to look like.
Ok--- since both of you have been paging the Dublin City- 14% of 2016 GE PRES Vote Share!!! results (Franklin County Portion Only), here are the EV numbers as of Yesterday, courtesy of Ebsy's data-set. :)
()
Is this data bad news for the Democrat or Republican in this Special Election?
Honestly, I'm of slightly split minds on this one....
1.) If O'Connor ekes out a narrow win in CD-12, he will likely need to perform extremely well in Cities like Dublin, compared to any historical Democratic performance at either the Statewide or Presidential level.
2.) Although these EV numbers show the largest Democratic margins ever in Dublin in recent years for a Statewide/Federal Election, I'm still not convinced those numbers will hold up once the ED Vote comes in.
Still, playing Devil's Advocate with myself, we only know the DEM/REP/OTHER on the basis of last Primary Election that the voter participated in.... It's entirely possible that you have Republican voters who last voted in the 2016 GE for Kasich, switched to HRC in the GE, or people that voted PUB in the '18 Primary for Statewide elected offices, that are totally receptive to voting for Danny O'Connor for US-Congress from OH CD-12.
3.) Of course it is entirely possible that Danny O'Connor, who is charismatic and well-known Senior Franklin County elected official might perform quite well in a City called Dublin where 16% of the Population trace their Ancestry directly to Ireland.
Probably making too much of all that, but still it's worthy of some consideration, especially considering the historical nature of the "White Catholic Swing Vote", especially in places like the Upper MidWest.
Any thoughts on final margins in the Dublin City part of Franklin County? I'm thinking O'Connor needs to win it by something like +10% to jack up the margins as part of a buffer against PUB margins in Delaware (Especially considering that Dublin in some ways shares more in common with the Townships of SW Delaware County politically than it does with the Columbus City portions of Franklin County), as well as the inevitable PUB victories in the other Counties within CD-12.
Title: Re: NOVA GREEN's Election Analysis Thread
Post by: NOVA Green on August 10, 2018, 08:16:37 PM
More anecdotals: My mom is a registered Republican (voted Kasich in the 2016 primary) and my parents house (very wealthy part of Gahanna) has been visited five times by OConnors campaign, nothing from the Balderson folks. My aunt and uncle (independent and Republican, respectively) live in a particularly country clubby part of New Albany and have been visited three times by OConnors campaign, nothing from Baldersons campaign.
Do you want me to post the numbers from Gahanna and New Albany with EV numbers as of Yesterday (Courtesy of Ebsy.... :) ) ????
Although I lived in Ohio for Four Years 20+ Years ago in College, I was basically 20 Minutes from Dayton and 50 Minutes from both Columbus and Cinci, so don't pretend to have any of detailed knowledge of the State from a local perspective anymore, although I remember how excited the College Students on my campus were when Bill Clinton won Ohio in '92 (First time in '64???).
What I *suspect* we might be seeing in Metro Columbus (Based upon '08 > '16 PRES results) is a pattern that we observed for the first time in recent American Electoral History in some of the major Metro areas of the West Coast back in '88 (Seattle, Portland, Bay Area Suburbs) where suburban voters started to identify more with the residents of the "City" as opposed to the traditional City/Suburban political, social, and economic divide.
It's early on yet, but we are starting to see in the heavily Ancestral Republican suburbs of North Franklin County (Including the City of Columbus proper) move heavily Democratic at the Presidential Level.
We have yet to see these types of movements at other Federal Elections (With a few exceptions and a few Cities), let alone see the impact at down-ballot Statewide Races where the Republican Coalition still holds strong, and the Democratic Coalition is much more dependent upon large turnouts in the Cities, Ancestral White Union Democrats throughout, swing voters in the 'Burbs, and keeping margins down in the Rurals, especially in places like SE OH.
Still, at the end of the day a "New Democratic Winning Coalition" in Ohio will inherently involve both a mixture of rapidly swing DEM voters in places like the wealthier 'Burbs of Columbus, combined with high turnout in the Cities, AND regaining those WWC voters that were more than happy to vote for Barrack O'Bama in both '08 and '12 and swung hard Trump in '16....
Yeah, Gahanna and New Albany numbers would be great! Thanks :)
My laptop completely crashed on Election Eve, and just got back online....
Ask and ye shall receive:
Franklin Co- OH- Gahanna- 6.1% of 2016 Vote Share.
()
People can say what they want to say about the Early Vote in Franklin County, but Republicans at only 25% of the EV in Gahanna looks really weird, and suggests that Dem Franklin County percentages and margins might be extremely high, even outside of the City of Columbus where quite frankly the EV numbers by Party are starting to look more like Portland Oregon GE PRES numbers than would be expected for the wealthy neighborhoods of North Columbus.
Franklin Co- OH - New Albany- ~ 3% of Franklin County Vote Share 2016.
()
Once again we see EV numbers that are completely devastating, in Upper-Income Educated Communities where Republican leaning voters tend to vote extremely early, just like Democrats....
Honestly these EV numbers we are seeing from every Municipality in Franklin County are looking devastating for Republicans, regardless of the massive surge of Democratic voters within the Columbus City precincts of OH CD-12.
Will it be enough, I don't know, but honestly I wouldn't be surprised to see record levels of support for a Democratic Candidate running for Federal Office within most of Franklin County.
Title: Re: NOVA GREEN's Election Analysis Thread
Post by: NOVA Green on August 10, 2018, 08:17:28 PM
If I were part of the O'Connor campaign this is what I would be perhaps most worried about....
Licking County---- Newark, Ohio--- `25% of 2016 Licking County Vote Share.
()
Although on paper these margin improvements in the CD-12 EV look like really nice numbers, the reality is that this is nowhere near the numbers that O'Connor needs to perform in to keep Licking County margins low.
This is quite frankly home to a ton of Obama '08/'12 > Trump '16 voters, and I'm not seeing the numbers here to suggest thus far that O'Connor will keep PUB numbers low within one of the larger vote centers within the County....
Title: Re: NOVA GREEN's Election Analysis Thread
Post by: NOVA Green on August 10, 2018, 08:18:28 PM
Now that we have "provisional" election results by by precinct for Franklin County, time to take a look at the overall numbers....
Here is the Vote Share % by Place in Franklin County between the 2016 Presidential Total Vote and the 2018 OH CD-12 numbers (Excepting any still to be counted absentee and provisional ballots, which will likely occur in more heavily DEM precincts within the County).
()
So although it's slightly harder to discern from the Graph, it's pretty clear that the CD-12 Franklin County precincts in Columbus, actually accounted for a significantly lower share of the total vote share than in 2016....
It's not just the raw % numbers, but also that 3% of Franklin County jurisdictional ballots were classified as "Write-In" in 2016, as opposed to 2018. Meaning that if the City of Columbus represented roughly 50% of the Write-In ballots in 2016 (Assuming even City vs elsewhere in FrankCo split), we still have an additional 1.5% decrease of the total vote share for the City of Columbus precincts within CD-12.
Columbus was 47.6% of the Total Vote Share of CD-12 in 2016 and was 47.1% in 2018, even without subtracting an additional 1.5%, which would put it closer to 45.6% in '18 (Without absentee/provo votes).
Meanwhile you see more traditional Republican places in Franklin Co CD-12, see an increase in their overall Vote Share....
Dublin goes from 14.0% > 15.3% (+1.3% Increase)
Westerville: 11.4% > 13.2% (+1.8% Increase)
Now I haven't run the VAP numbers for Dublin and Westerville between Nov '16 and Aug '18 to account for population % change, but still these numbers appear to indicate an increase of PUB leaning TO in Franklin County receptive places, regardless of demographic change.
How did the places in Franklin County shift between '16 PRES GE and '18 CD-12 SE (Current #s only without the Provo Vote)????
()
Very interesting....
Not only did IN COLUMBUS we see the lowest swings between '16 and '18 of any place within Franklin County, but also the largest drop of the overall vote share....
This was supposed to be O'Connors "Dem surge" stronghold, but instead it was other parts of Franklin County that dramatically bumped the DEM's % AND raw vote margins.
Westerville: 11.4% Vote Share (2016) ---- > 13.2% Vote Share (2018) ---- +1.8% Vote Share Increase '16 GE > '18 CD-12 SE.
Swings: + 19 DEM ('16 GE to '18 SE)
Worthington: 6.6% Vote Share (2016) ----> 8.4% Vote Share (2018) ---- +1.8% Vote Share Increase '16 GE > '18 CD-12 SE.
Swings: + 13 % DEM ('16 GE to '18 SE).
Columbus:
Swings: +13% D
This would normally be reasonable, but decreased Columbus Vote Share wiped off a decent chunk of potential Columbus margins in a normal General Election... (Is there such a thing???).
New Albany:
Way under-performance on Dem swings.... Vote Share (???) not so sure, it's a pretty small community, but they tend to be reliable voters in just about any election in Franklin County.
I'll go into each of the cities in a bit more detail, now that I have an initial precinct data set for Franklin County, but initial results are actually quite interesting and perhaps even raise some questions about the CW of so many Media pundits on this election....
IDK, but just started looking into the numbers, and thought I would share some of the stuff that I've fulled up thus far.
Title: Re: NOVA GREEN's Election Analysis Thread
Post by: NOVA Green on August 11, 2018, 03:35:55 AM
Ok---- let's look through a few of the Cities in Franklin County in more detail now that we have at least the initial batch of unofficial numbers prior to any ABS or PROV votes....
Westerville--- 13.2% of Franklin County CD-12 Vote Share:
As I briefly mentioned sometime back in a brief profile of the CD-12 portion of Franklin County, Westerville is the 3rd largest City located in Franklin County (Pop 36.8k), although portions of the City extend into Delaware County (I'll get to that on the Delaware County post later).
Median Household Income ( $82.1k):
()
So Westerville skews relatively Upper-Middle Class by Household Income, but there is also a pretty decent chunk of Middle-Class Households in there as well.
Still, relatively Upper Middle-Class voters tend to vote more reliably, even in "off-year" elections, which likely helps explain a good chunk of the Cities increase in Vote Share between '16 GE and '18 SE....
Race/Ethnicity:
()
It's a few % points more Anglo than Ohio as a whole, and significantly less African-American than Ohio as a whole.
Age Demographics:
()
It skews slightly older and with fewer Millennial Gens (Which makes sense considering it's probably a somewhat more expensive place to buy or rent in than some other alternatives....
Educational Attainment:
Check standard box for major '16 US-PRES DEM swings..... 60% Post HS Diploma is pretty educated in most parts of the Country....
Relative Occupations:
()
So here it starts to get even more interesting....
As expected we see a significantly higher than average concentration of occupations in White Collar jobs, as well as a much lower concentration of occupations in Blue Collar jobs. Still, as someone who has been both MGMT and Rank-and-file, there were times where employees reporting to me were making significantly more money overall compared because of built in Overtime for skilled workers, while I was working 60 Hours a Week for the same Pay as I would have been making at 40 Hours/Week.
however the numbers for Computers/Math and Education stand out here.
So.... Westerville experienced the largest swings of any Municipality in Franklin County in CD-12 between the '16 GE versus the preliminary numbers for the 2018 CD-12 Special Election.
Let's look at the election results for the US Presidential Elections between 2004 and 2016 with swings, as well as the results from the 2018 CD-12 Special election.
()
What we see here is even in 2004, which was Four Years after Political Scientists first started to note not only a dramatic increase in the % of American Workers in the "Knowledge Sector", but also major swings towards the Democratic Party in 2000 among this demographic, George W. Bush still beat Kerry by ~ 20% points in 2004 in a tight election in Ohio!!!!
Even in 2008 and 2012 Westerville voted consistently for Republican PRES candidates by +10%.
In 2016 we first observed a Democrat winning Westerville, but even there HRC only garnered 50% of the Vote, with 3rd Parties sucking up the remaining 5.5% gap between the Major Parties.
In 2018, Westerville goes (57-32 D) +25% D for a US-House election, which seems to indicate that the "disease" is starting to really infect down-ballot PUB candidates.
Obviously one of the questions that I'm curious about, is to what extent will we see that manifest this November for Statewide Elections within Ohio....
OK--- Now let's take a slightly deeper dive into Westerville to see *WHERE* these swings took place in terms of the overall political Geography....
Let's Start with the Ward Map of Westerville, since there was one precinct added between '16 and '18 in Ward 3.
()
Now let's look at the Swings by Ward within Westerville from the '16 GE to the '18 SE....
()
OK--- We see 2/5 Wards significantly under-perform and 3/5 significantly over-perform for the Democrats....
Wards # 3 & 5 had only relatively minor swings towards the Dems in the Special Election and Wards # 1,2, & 4 had significant swings towards the Democrats....
Ok--- now let's look at the Vote Drop-Off % by Ward within the Westerville precincts of Franklin County....
()
We see almost a 70% voter drop-off in Ward # 3 and a 47% drop-off in Ward #5....
Meanwhile in Ward #2 and Ward #4 we see only about a 35% voter drop-off compared in the '16 GE!!!
OK--- fair enough.... what did the voting pool or voting share by Ward look like in Westerville in '16 and '18?
2018:
()
2016:
()
So---- Looks like Ward #2 has always been a major contender representing roughly 30% of the Vote Share in both the '16 GE and the '18 CD-12 SE and jumped up from 29% to 32% and is the Biggest kid on the block....
Ward #3 has always been the small kid on the block of the (5) Franklin County Wards of Westerville bagging 14% of the City Vote in '16 and plunging down to 11 % in the Special Election
Ward #5 has been wrestling with Ward #1 for the number Two biggest Ward on the City Blocks of Westerville, with both roughly representing about 20% of the City Each....
So Now one starts to wonder about why Wards #2 and Wards #4 swung so heavily Democrat, and why voter turnout dropped so dramatically in Wards # 3 and Wards #5????
Let's look a little more closely at the Demographics in Wards #3 & #5....
()
So, here we see a pretty decent sized African-American community concentrated heavily in the SW portion of Westerville representing roughly 20-40% of the population that heavily overlaps with precincts in Ward #3 and Ward #5.
Precinct 5-B in Westerville for example, saw a 74% of raw voter numbers between the 2016 General Election and the prelim numbers from the 2018 CD-12 GE, which was the highest in the entire Franklin County portions of the City....
Precincts 3-A and 3-C experienced a 66-72% drop in the Total Votes between '16 and the '18 SE.
Now Westerville added an additional precinct 3-E in 2018, so without having looked at the precinct line changes here between '16 and '18, it's slightly more difficult to see exactly where the Total Vote drop-off occured in Ward #3....
So these are the precinct swing numbers I'm looking at, along with drop-off voters from '16 GE > '18 SE...
()
NOW--- let's take a look at MHI by US Census Tract within the Franklin County portion of Westerville...
()
So, most of the wealthier parts of Westerville are actually over the Delaware County line, where MHI runs ~ $120k/Yr (Would be awesome wage in relatively low cost of living Metro Columbus), but still the darker shading on the Franklin County Census Tract still has an MHI of $102k+/Yr, which is obviously nothing to sneeze at in most parts of the US.
These precincts tend to heavily overlap with much of Ward #2, where you had relatively low voter drop-off and relatively large swings....
Ward #4 swings '16 > '18 appear to have been driven heavily by one individual precinct (Westerville 4-A that swung +22.7% D ('16 to '18) AND only saw a 28.8% TV drop-off....
That's really odd, but it appears to overlap with an overwhelmingly College Aged Census Tract...
()
Now, once I start looking at the data, we have Otterbein University that basically dominates the precinct....
()
So this precinct went: 2018- (58-41 D) +17% D from 2016 (45-50 R) +5% R---- +22% SWING.
In 2012: (40- 59 R) +19% R or a +14% swing between '12 and '16....
Not sure exactly what's going on here and why not only didn't student turnout drop in the Middle of Summer for a Special Election, but also why the hell this Republican voting University where Trump beat HRC by +5% swung hard towards O'Connor....
Regardless, it helps explain part of the swings in Ward 4....
There are a lot of things to look at in the details of the OH CD-12 Special Election, and I would strongly caution everyone to not totally get onto their "jump to conclusions mat" until we get a chance to mine through the details much more extensively....
Obviously now that I have seen some of the results from Westerville, I start to wonder to what extent Danny O'Connor under-performed in other African-American parts of Columbus?
To what extent did the Student Vote (Or lack thereof in most cases) contribute to margin shifts in certain parts of Licking County for example, or even the OSU overlap in parts of Columbus?
I suspect part of the reason many Pub's are quietly flipping out, is that they are seeing many of these swings in CD-12 occurring in some of their safest and most reliable high-turnout base areas.... I suspect that there might be a strong argument to be made that even in CD-12 with higher turnout in November these trends might be even more brutal....
Title: Re: NOVA GREEN's Election Analysis Thread
Post by: NOVA Green on August 11, 2018, 07:00:16 PM
Working through some more places in Franklin County---
Worthington- Pop 13.5k---- 8.4% of Franklin County CD-12 Vote Share (+ 1.8% from '16 GE).
()
Worthington had the 2nd largest swing towards O'Connor of any place in the Franklin County portions of CD-12 compared against the 2016 US PRES votes (+13% Dem Swing).
Let's take a peek at how it has voted for President starting in 2004 through the CD-12 Special Election of 2018.
()
So as we can see it was basically 50-50 in 2004, swung heavily towards Obama in '08, stayed constant in '12, swung +20% Dem in 2016, and +13% Dem in 2018.
The Pub raw % numbers only dropped 4% between '16 and '18, which indicates that a decent chunk of the 3rd Party PRES voters in '16 voted DEM in '18, combined with a reasonable but not huge % of Trump '16 > O'Connor '18 voters.
Again, the thing that really stands out for me is how rapidly Worthington is shifting into a heavily Democratic voting City at the Federal level, effectively becoming the 2nd most Democratic City within this portion of CD-12.
So, let's take a more detailed look at the Demographics of Worthington, before delving a bit into the ward/precinct turnout and results....
()
So here we see that Worthington is a bit older than the population of Ohio at large, slightly below on the 40-60 age category, a significant bump in the 30-40 category, and way lower population of 18-29 Years.
Race/Ethnicity:
()
Worthington is quite a bit Whiter than Ohio as a whole, and a much lower proportion of African-Americans.
Median Household Income (MHI):
()
33% of the Households make more than $ 125k /Yr
56% make more than $75k/Yr
This is pretty clearly an Upper-Middle-Class City, with a relatively high % of affluent folks.
Educational Attainment:
()
It is an extremely well educated City with 72% of the Pop over 25 having greater than a HS Diploma.
Relative Occupations:
()
As expected these skew heavily White Collar/Professional. Interestingly enough along with your usual Business/Mgmt/Computers/Science-Math occupations, you have a much higher % of people in other occupations such as Legal, Entertainment, and Education than would typically be the case for these types of communities.
Time to break down Worthington by Wards to see what happened in more detail:
Here is a Chart breakdown of the 2016 PRES and 2018 CD-12 SE:
()
Let's look at it in a graphical format:
()
So--- Ward #2 is the most Democratic Part of the City 2016: (70-24 D), 2018 (80-20 D).
Wards #1 and # 4 are the most Republican parts of the City, with a much lower swing in Ward #1 than elsewhere in Worthington between '16 and '18.
Now let's look at the Vote Drop Off by Ward between the '16 PRES election and the '18 Special Election:
()
So Ward #3 saw a 52% drop-off in Total Votes between '16 and '18, and Ward #1 (The most Republican and smallest margin swings) has the smallest TV drop-off....
Ward #2, the overwhelmingly Democratic Ward had a relatively small voter drop-off as well.
Now, since Worthington has rapidly become a heavily Democratic bastion, time to look at the results for the 2016 OH-SEN race and the 2016 CD-12 race by Ward to see what the numbers show.
()
So, Ward #2 was the only Ward that voted DEM for OH-SEN in 2016 and the only Ward that voted DEM for US-HOUSE CD-12 in 2016.
Again Wards #1 and #4 stand out as the most Republican Wards, and Ward #3 is basically a City bellweather with results tending to cluster close to the City average TV % for most races.
NOW---- Let's drill it down to more detailed demographic data by Ward to see what's going on here...
Here is a Map of MHI by Census Tract:
()
So---
Ward #1: is basically the wealthiest dark RED Census Tracts of $120k/$133k/$100k in the Western Part of the Map.
Ward #2: Basically the $78k/$85k areas on the Map
Ward #3: The Northwest Corner of the Map---- $103k
Ward #4: The Northeast Corner of the Map- $ 71k
Wow--- So the most PUB areas in Worthington are both the most affluent and also the most Middle-Class (And least affluent part of the City)!!!!
The Ward (#3) with the largest % drop of the votes is relatively upper Middle Class, and the DEM stronghold is solidly Middle Class, but basically only the 3rd wealthiest ward in terms of MHI....
OK---- so maybe Race/Ethnicity can explain some of the variances by Wards within Worthington?
Problem is that the City is so overwhelmingly Anglo, it really overall doesn't appear to be much of a factor even in a detailed breakdown.
We do have a significant Asian-American population clustered in one of three Census Tracts in Ward #1:
Map of Asian-American Population by Census Tract:
()
So in Ward #1 we see 14% Asian-American population around Precinct 1-B.... 2016: (66-31 D); 2018 (73-27 D). Roughly 50% of the Asia population is Chinese-American.
It's the most Democratic Precinct now in Ward #1, and also experienced the largest swings towards the DEM in the CD-12 SE....
We do also see a smaller Asian-American population of 5% in Two other Census Tracts in Ward #1, as well as a 7% population in the Northern part of Ward #3.
SO--- since I started looking at Race/Ethnicity as a potential variable, decided to pull numbers on Ancestry by Census Tract to see if that might explain anything....
Here is a Census Tract breakdown by Irish Ancestry for Worthington:
()
So---- Ward #2 roughly overlaps with the 24-27% Irish Ancestry corner of the map....
Ward #1 has a decent Irish-American Population in the more PUB leaning precincts, and only 15% in the most heavily Asian American precinct/Census Tract.
Ward # 4: Is only 16% Irish-American, but was the Trumpiest Ward in '16, and still swung O'Connor by AVG City margins.
Ward #3: 20% Irish-American, but place with highest vote drop-off from '16 PRES to '18 CD-12 SE, albeit with +15% O'Connor swings!!!
So, if there was a hidden Irish-American surge in Worthington, Ward #2 is the only place where this might be explainable, within the context of Metro Columbus European Ethnic political dynamics.
Now we need to control for AGE, since obviously there were some pretty huge AGE GAP margins in the 2016 Presidential Election???
It gets tricky with the US Census Map tool that I use to easily isolate age, but let's start here....
Here is a Census Tract Map of the % of the TOTAL POPULATION aged 30-39:
()
Now this appears to clearly indicate that there is a major concentration of Older Millennials concentrated in Ward #2....
Now let's look at the Census Tract Map of TOTAL POPULATION aged 18-39 as a % by Census Tract....
()
OK--- now we're getting somewhere.... Basically 33% of the entire population of Ward #2 is aged 18-39.... Once you add in the 25% of the population that are Children, you only have 42% of the population that over the age of 40!!!!
We also see how Ward #1 has the lowest % of total population aged 18-39 (Maybe somewhere around 17% ???) and maybe somewhere around 22% that are Children, meaning 61% of the population are 40+ Yrs old.
So, it looks like Millennials turned out in force in Ward #2 (Even although it is NOT a college precinct) AND Middle-aged / Older voters turned out in force in Ward #1 (My drop-off chart above).
Now let's look at where the older population is most heavily concentrated in Worthington by Census Tract:
()
Wait--- what the heck is that one Census Tract in the SW corner of the City where 40% of the Pop are over the age of 60???
Ahhh.... looks like that is Worthington precinct 1-C, one of the more 'Pub precincts in the City these days 2016 PRES: (55-39 D); 2018: (63-37 D).... Still it had a good 10% swing which although it was one of the worst in the City, still wasn't too shabby.
NOW---- What about precinct 4-C??? It swung +22% DEM between '16 and the '18 CD-12 SE, which was the largest swing anywhere within Worthington.
2016: (53-39 D) +14% D; 2018: (68-32 D) +36% D.
Precinct Map of Ward #4:
()
I'm a little confused why this precinct North of Schrock Road swung so heavily Democratic.... it doesn't help that I can't break down Census Tract data into enough detail... Sure we have some Census Block tracts with a younger age cohort within this Precinct, compared to much of the rest of Ward #4, but still...
At this point it's pretty clear that overall Worthington is moving into solidly Democratic Party voting patterns at all Federal Elections, and among most major demographics within the City.
The key question, is what will happen when the voters of places like Worthington go to the polls in November to vote for Statewide Elected offices....
Title: Re: NOVA GREEN's Election Analysis Thread
Post by: NOVA Green on September 23, 2018, 05:01:05 PM
Coos County, NH is the poorest County in NH with an MHI of $ 40.3k /Yr, 16.1% of the Population living in poverty, and the largest % of the population on Food Stamps, and the lowest % of employment of working-aged Males in the State (64.7%)
Of the single poorest County by State, it had the largest swing towards the Republican Presidential candidate between 2012 > 2016, with a whopping +27% R swing.
Here's a link to a thread that I started on how the poorest Counties in each state voted between '12 . '16
https://uselectionatlas.org/FORUM/index.php?topic=267947.msg5743056#msg5743056
One thing that obviously stands out here is the extremely large French / French-Canadian population (40% by Ancestry) and much lower proportions of English and Irish by Ancestry.
In general, poverty in the three Northern States of New England (VT,NH, and ME) were most pronounced within those counties and communities with high numbers of French / French-Canadians, as well as massive swings towards Trump in '16.
If we look at the age of the residents, we see approximately 22% of the entire population in Coos County was 65+, and 39% 55+, which makes it significantly older than most other Counties in NH.
The largest Industries are Health Care, Retail, and Hospitality, which combined account for 42% of the work-force, and with the exception of the former, tend to skew towards relatively low paid service sector jobs.
The educational profile of the County of those 25+/Yrs (28.3% Degree > HS Diploma, 59.6% HS Diploma, 12.1% No HS diploma) place it as having a much lower educational attainment rate than NH at large.
The economic challenges to the "North Country" part of NH are steep, as the once influential pulp and paper industries have collapsed in recent years leaving behind a much smaller pool of decent paying jobs.
https://stateimpact.npr.org/new-hampshire/tag/north-country/
https://www.berlinnh.gov/sites/berlinnh/files/uploads/economic_development.pdf
Given the citys long relationship with the wood and paper
processing industry, the closure of the Fraser Pulp Mill in Berlin and the subsequent
ripple through other sectors largely contributed to a loss of 1,120 private sector jobs,
including 970 goods producing and 150 service-related jobs, over ten years.
http://www.gorhamnh.org/Pages/GorhamNH_Selectmen/Chapters/8.pdf
So, to go back to your original question(s):
How would you characterize the people of Coös County? Are they liberal or more conservative. Why do the love Trump and Paul so much?
1.) I would characterize the people of Coos County as economically liberal, but protectionist at the same time. Socially a bit more conservative than NH as a whole (High Catholic population), fairly rural / small-town dominated, with significant outdoors activity tied to hunting and fishing, foreign policy fairly isolationist / non-interventionist.
2.) Trump's popularity has less to do with his character I suspect, and more to do with the fundamental economic conditions of the County, and his promises to crack down on unfair foreign trade competition. The themes and frequent references to the paper and pulp industry and Canadian competition strongly resonate in these types of communities, as they do in many communities in Oregon that have also seen a significant loss of jobs directly as a result of competition from Canada (Saw Mill jobs lost from significant growth in Canadian processed timber importation) and (pulp mill jobs lost from exportation and re-importation of paper products produced in China from raw logs exported out from Oregon).
Much of the reason for this was the Great Recession, which changed global trade patterns within the pulp/paper and processed timber sector, to the significant detriment of places like Coos County, NH.
I strongly suspect that Trump will fail to deliver on his promises to the Mill Workers in these communities, and we will likely see a correction back to support for the Democratic Party possibly in 2020, and if not then almost certainly in 2024.
Title: Re: NOVA GREEN's Election Analysis Thread
Post by: NOVA Green on September 23, 2018, 05:03:33 PM
Ugh, that's a very lengthy disquisition.
So basically you're saying, it is such a populist county due to its poorness and their remoteness that its inhabitants want to express their anti-mainstream attitude by giving their vote to "alternative" candidates?
Not exactly what I was saying at all, but still you're getting closer to where I was going with this:
1.) We have communities like this across the United States of America
2.) Systematic poverty is partially a result of massive economic dislocation caused as a direct result of the "Great Recession" in recent years, and even previously as a "peripheral" part of the US economic structure for decades under various political Administrations in both DC and within NH.
3.) The alienation that many locals feel is exacerbated by decades of systematic discrimination against French / French-Canadians in both New England and within Canada as well, partially as a result of religious affiliation, but more broadly as a result of WASP dominance of the political and economic structure of the region.
It's a complicated history in Canada, let alone a much less studied history in heavily French / French-Canadian regions of Northern New England.
https://www.amazon.com/Prelude-Quebecs-Quiet-Revolution-Neo-Nationalism/dp/0773504249
4.) The collapse of the Pulp and Paper industry in places such as Northern Maine (CD-02) and Coos County, NH created a massive need for solutions to deal with what was essentially a complete destruction of the largest traditional economic base of the region.
When the Frasier Mill closed down, it completely devastated an entire small rural community (Coos County), and most of the job losses were directly attributed to unfair trade competition from Canada.
5.) Trump rolls in and suddenly plays on the job losses in pulp and paper mills, as well as Timber imports from Canada, to appeal to workers in the Industry in Northern New England, Northern Midwest, and the Pacific Northwest....
6.) Where was HRC on this topic????
Essentially the Dem PRES nominee in '16 ceded ground to the Trumpistas on the "Trade War" topics in peripheral communities destroyed by decades of Neo-Liberal economics going back to Reagan > Bush Sr > Bill Clinton > Bush Jr > Obama (???) and now.....????
Title: Re: NOVA GREEN's Election Analysis Thread
Post by: NOVA Green on September 23, 2018, 05:06:53 PM
So, politicalmasta PM'd me a week or so back asking if I was interested in taking a look at TX CD-23....
Told him I would consider taking a look at it, but wasn't sure how well my usual style of analysis would translate into a low-turnout "off-year" election in Texas, let alone being able to look at detailed precinct level analysis overlapped with Demographics, etc....
However, what caught my attention is that this district was basically designed to be a "swing district" despite the TX 'Pub Gerrymandering of the Lone Star State way back in '10 > '13, and although there are quite possibly a few other Texas CDs that will likely flip before CD-23 in '18, based upon patterns we observed in '16, the reality it is still very much a flip district with an extremely large Latino VAP, despite traditionally low turnout levels among Texans in general, and Tejanos in particular....
Let's start with the vote share by County.... instead of doing my typical NOVA GREEN deal where I use PRES or GOV numbers, instead I decided to focus initially on votes for Congressional Representation, considering a general significant drop-off in support for down-ballot Democrats within this district.
Vote Share by County in CD-23:
2016:
()
2014:
()
2012:
()
Ok--- fun charts---- what does all this mean???
Obviously Bexar County represents roughly slightly under 50% of the County Vote Share in CD-23 from '12 > '16.
El Paso County runs from 6-9% of County Vote Share '12> '16
Medina and Val Verde counties are pretty much ~ 8% in the former and 6% in the latter....
Maverick County runs about 5-6%.
Cool--- now let's look at the vote share trends so we can see overall shifts from '12 > '16 for US House Elections.
()
So here we see that Bexar Counties vote share has been steadily increasing from '12 > '16....
It certainly makes sense considering the massive population growth in Metro SA (San Antonio) compared to most other parts of the district....
El Paso County part of the CD-23 is fascinating, since it appears that it represents a much higher % of the CD Vote share in Presidential Election Years (7.6% in 2012, 6.0% in 2014, and 9.0% in 2016 (!!!) )
Now, let's look at it from another perspective:
What are the RAW VOTE MARGINS by County for CD-23 Elections from '12 > '16????
()
So here we see how Republican the portions of Bexar County are and have historically been in CD-23 from '12 > '16.
Ok--- fine, let's take a look at '12 > '16 vote margins and swings in the largest Counties within TX- CD-23 at the Congressional Level.....
()
It's a pretty confusing chart/graph for anyone that hasn't been following my train of thought here, but bottom line we see a negative swing towards the DEM candidate for CD-23 in most the largest Counties in CD-23, with the exception of Bexar and El Paso Counties....
I'll be posting a lot more data as I shift through these numbers, going down to precinct level analysis, compare / contrast with PRES '12 / '16 numbers, US SEN '12, etc....
One of the questions that I was asked, was do I believe that Gina Ortiz-Jones might be able to mobilize enough support in certain parts of SouthTex considering her Sexual Orientation, despite her military background, and I strongly suspect that this is essentially a non-issue for the overwhelming majority of Latino and Anglo voters in CD-23....
Si se Puede....
()
Title: Re: NOVA GREEN's Election Analysis Thread
Post by: NOVA Green on September 23, 2018, 05:10:01 PM
Ok--- So started to delve a bit deeper into the Bexar County numbers, since after all it accounts for not only close to 50% of the Vote Share of the County (As well as an increasing chunk of vote share from '12/'14/'16, but also is essentially the "breadbasket" of Republican votes within TX CD-23 at the Congressional Level....
Let's take a slight walk and look at an historical compare/contrast between US-PRES vs US-REP results within Bexar County precincts located within CD-23 to see what the Tea Leaves show....
Here are the 2012 to 2016 Votes for US President by Political Party:
()
Now let's look at the US-PRES Vote '12 > '16 by Place as a % of Partisan Votes...
()
Very interesting...
We see an overall +11.4% D swing at the Presidential level ('12 >'16) within the precincts of CD-23 in Bexar County, with a +10.9% D Swing within the precincts of San Antonio and +14.2% in the smaller portion of CD-23 located elsewhere.
Romney won the SA portions of Bexar by +6 % R in '12 and Trump lost it by 5% in '16.
Romney won the "Non-SA" portions of Bexar by 26% in '12 and Trump only won them by 12% in '16.
Meanwhile we had a significant increase of "New Voters" between the '12 and '16 Presidential Elections in the CD-23 portions of Bexar County, and this is how they voted...
()
If we look at it from another perspective, we see the % changes when we take the entire vote change by place within CD-23 portions of Bexar County from these "New Voters", in the fastest growing VAP and Vote Share region of the Congressional District...
()
So, when we examine the largest chunk of voters in the CD-23 portion of Bexar County, we see the HRC capturing ~ 72% of the New Voters in San Antonio, and in Non-SA voters at 55-28 D...
Still, the largest swings between '12 > '16 for US-PRES happened in the CD-23 parts of Bexar County that are growing much faster in terms of overall population compared to San Antonio....
The 23% of "New Voters" supporting 3rd Party Candidates is astounding, SA (32% Other) even in the Non-SA areas of Bexar County, not to mention HRC bagging (55 D-29 R- 17 Other).
Something tells me many of these "new voters" in Bexar County that voted "other" are not inherently predisposed to vote Republican in November '18 at any level.
Now we need to take a look at US-PRES vs US-REP numbers in '12/'16 to do a slight compare/contrast model....
Here are the Raw Vote Comparison Numbers:
()
Here are the numbers looking the "Vote Gap" as a % of US PRES vs US REP numbers in '12 and '16...
()
Interestingly enough, we saw a dramatic collapse of support for the DEM candidate for TX CD-23 between '12 and '16, especially compared to US-PRES numbers, at a time where this portion of Bexar County was swinging "Hard DEM" at the PRES level....
The key question is how will many of these Republican leaning voters in precincts of Bexar County CD-23 swing in 2018???
Many of y'all might suspect that this was a "Latino Surge" vote gap in these precincts, but I looked at the raw Total Vote (TV) numbers, and it doesn't appear that voter drop-off was unusual at all when comparing Presidential Elections ('12 > '16) in terms of down-ballot drop-off.
What does appear to be the reality is that many voters that supported the DEM CD-23 candidate in '12 decided to switch sides and vote PUB CD-23 in '16 for whatever reason....
How will it play come November in Anglo suburban parts of Texas, where we are starting to see some interesting polling numbers come out, combined with a marquis election for US-SEN with a Beto vs Cruz wrestling match???
I suspect that Bexar County CD-23 '18 numbers might well be closer to '16/'14 numbers, and most significantly much of the benefit will accrue in favor of the Democratic Candidates for US-SEN and TX-CD 23.
Next Stop, more detailed look at political demographics and precincts of Bexar County, classic NOVA Green style....
Title: Re: NOVA GREEN's Election Analysis Thread
Post by: NOVA Green on September 23, 2018, 05:12:13 PM
Time to delve a little deeper into the CD-23 portions of Bexar County, but first a brief recap of the data already presented:
1.) Bexar County accounts for ~ 50% of the Vote Share in CD-23, and is a fast-growing part of the District in terms of overall % of Vote Share.
2.) It is the most consistently Republican population center of the district, and one of the only places where there was a net swing towards the DEM CD-23 Candidate between '14 and '16.
3.) At a Presidential Level, there were significant swings towards the Democratic Candidate between '12 and '16 (+11.4%).
4.) "New Voters" between '12 and '16 at the Presidential level voted overwhelmingly Democratic.
5.) There tends to be a significant "Vote Gap" between the performance of Democrats for US-House CD- '23 vs US Pres results (Most visible in 2016).
OK--- Now it's time to look at a few other items for Bexar County CD-23....
First, let's start by taking a deeper look at the Congressional Elections between '12 and '16.
()
So what this tells us is that even though there was a visible swing towards the Democratic Candidate for CD-23 between '14 and '16, it was much less than the swing towards the Republican Candidate between '12 and '14.
In a Non-Presidential Election Year, such as 2018 this is obviously significant...
Now let's look at this from another perspective:
What can we ascertain from the changes in total votes for Presidential/US Senate Races by Party, using the 2014 Congressional Election as a baseline "controlled variable"?
The goal here is to look at:
1.) Drop-Off in Total Votes by Party between '12/'14/'16 for CD-23.
2.) Drop-Off in Total Votes by Party compared to "Headline Elections" contrasted against US CD-23 House Elections.
()
What does this tell us?
1.) There were 40% fewer votes cast in CD-23 in 2014 than in 2012.
There were 50% fewer votes cast in CD-23 in 2014 than in 2016.
2.) Pubs tend to experience a lower drop-off in Total Votes for CD-23 in Bexar County, than Democrats do. The drop-off in DEM vs PUB US-REP votes in '16 compared to '14 was much lower than in '12, indicating a narrowing vote gap by Party, at least for Presidential Year Elections.
3.) Overall, there is a relatively small drop-off in Total votes from the "top-ticket" races (US-PRES '12/'16 and US-SEN '14) compared to US CD-23 races. Approximately 1% in 2014 and 1.5% in 2012 and 2016.
It doesn't appear that voters in off-year elections tend to vote only "top-ticket" and not down-ballot for US-REP to any significant extent compared to Presidential Election Years in Bexar County CD-23.
4.) It will be interesting to see if "Off-Year" election turnout increases in Bexar County in '18 compared to '14, considering the Texas US-SEN race is much more fiercely contested this Year.
5.) The Republican Candidate performance in Bexar CD-23 in '16 almost looks like an outlier, considering the Dem CD-23 Candidate out-performed the Dem "Top-Line" candidate in both '12 and '14.
How much of this was a result of HRC Anglo voters swinging hard DEM, but still wanting to keep a PUB in Congress as a "check on Trump" is unknown, but certainly something to consider as a potential wildcard in the 2018 TX GE, with US SEN race on the ballot, especially with the "surge" of new voters between '12 and '16, many of whom are likely inclined to vote for BETO this coming November....
Next stop, probably will be delve a bit further into the respective Party "Vote Banks" within Bexar County CD-23 and maybe some Socio-Demographic overlaps....
Fuel for thought.
Title: Re: NOVA GREEN's Election Analysis Thread
Post by: NOVA Green on November 19, 2018, 12:22:13 AM
Taking a deeper dive into the UT-CD-'04 numbers in '18 starting with the vote share by place in Salt Lake County 2016 to 2018...
()
Here is a visual representation...
()
As you can see virtually every City within Salt Lake County lost vote share between Nov '16 and Nov '18.
The exception was Millcreek, which gained a whopping +6.8% of the SLC CD '04 Vote share (from 5.3% to 12.1% making it the 3rd largest vote bank, only narrowly behind South Jordan and a few points behind West Jordan.
This is likely a direct result of incorporation from this area from an uninc CDP into a City in December of '16.
It also appears to be one of the main factors as to why this race is so close (we'll get back to that a little later).
Now, let's look at the Registered Voters by Place 2016 to 2018:
()
Now let's look at that same data in a graphical format:
()
So what we see here is a massive increase in total registered voters in the CD-04 portion of Salt Lake County, with roughly 26k new registered voters added between Nov '16 and Nov '18....
Almost 19k of these were in Millcreek alone (roughly 70% of new RVs)... South Jordan gained 2k and Herriman gained 3.2k.
Now let's look at the Turnout by Place between the 2016 Presidential Election and 2018 Congressional Election (Based on Friday's Salt Lake County Vote Numbers)...
()
Here is a graphical version of the same data:
()
What does this tell us?
Turnout was significantly lower in Bluffdale, Herriman, and South Jordan than the overall turnout gap between these two elections to date...
Turnout was only marginally down in Millcreek, Salt Lake City, West Jordan, and West Valley City.
Although this does not necessarily portend that remaining ballots will skew Republican, it is still noteworthy.
Now, let's look at the raw vote numbers by place and party in the 2016 PRES election vs the 2018 CD-04 election.
()
Here's a graphical representation:
()
Let's look a slightly more simplified graph that removes the total vote, in order to make it easier to see how the Democratic Candidate for CD-04 REP increased DEM vs REP raw vote totals just about everywhere, compared to the 2016 Presidential Election.
()
DEMs gained a net +43.3 votes over HRC, while the PUBs gained a net +22.2k votes over DJT.
Both DEMs and PUBs gained raw votes everywhere, except for Kearns, where the PUBs lost 43 votes between NOV 16 GE and NOV 18 GE.
In terms of NET DEM vs REP gains between '16 and '18, DEMs gained more votes in every municipality compared to PUBs with the exception of Herriman (+76 R).
The net gain numbers that stand for DEMs:
1.) Millcreek: +6k DEM
2.) West Jordan: +2.6k DEM
3.) Murray: + 2.3k DEM
4.) Taylorsville: + 2.0k DEM
5.) West Valley City: +1.8k DEM
ok... I could go on, but I suspect y'all get the picture.
What is most remarkable about these numbers, is that it appears in many places, the Democratic vote gains between 2016 PRES and 2018 CD-04 REP, appears to have occurred as a direct result of McMullin and Gary Johnson voters, voting DEM in 2018....
So now, we need to look at the % of Vote by Place between the Nov '16 PRES election and Nov '18 Congressional election....
()
Let's look at this in a graphical format, and a stacked chart probably works best here, especially considering the 3rd Party Vote in 2016 out in Salt Lake County...
()
Wow--- this helps provide a greater context in what appears to be a relative collapse of Republican Party strength, even among voters predisposed to vote for Liberal/Moderate Republicans in the era of Trump, especially among many communities with relatively large Mormon populations.
Something strange is going on here...
Now, in order to understand more fully the impact of the McMullin/ Johnson cross-over voters, as well as potential impacts of population growth within this part of Salt Lake County, we need to look at the % margins and swing by place...
()
Here is a graph that might perhaps more clearly indicate the numbers from the raw data chart....
()
So basically DEMs increased raw % share in every community except for Riverton, Herriman, and South Jordan.
DEM swings were most remarkable in Kearns (+21.5% D Swing '16 > '18), South Salt Lake (+ 16.8% DEM swing '16 > '18), Midvale (+16.1% DEM swing '16 > '18), West Valley City / Salt Lake City (+13.3% DEM swing '16 > '18).
Murray, Sandy, Taylorsville, and Other also saw +10% DEM swings from '16 to '18....
Interestingly enough Millcreek only saw a +5.8% DEM swing between '16 and '18, but the massive increase in new voters added some +6k DEM NET VOTE MARGIN between '16 and '18....
Although the 2018 CD-04 elections in Salt Lake County might well simply be an anomaly, it might also be the "Canary in the Coalmine" when it comes to the future of the Republican Party in Salt Lake County Utah, considering they were effectively slaughtered within the most Republican parts of the County, with a few exceptions.....
Thoughts anyone???
()
Here is a visual representation...
()
As you can see virtually every City within Salt Lake County lost vote share between Nov '16 and Nov '18.
The exception was Millcreek, which gained a whopping +6.8% of the SLC CD '04 Vote share (from 5.3% to 12.1% making it the 3rd largest vote bank, only narrowly behind South Jordan and a few points behind West Jordan.
This is likely a direct result of incorporation from this area from an uninc CDP into a City in December of '16.
It also appears to be one of the main factors as to why this race is so close (we'll get back to that a little later).
Now, let's look at the Registered Voters by Place 2016 to 2018:
()
Now let's look at that same data in a graphical format:
()
So what we see here is a massive increase in total registered voters in the CD-04 portion of Salt Lake County, with roughly 26k new registered voters added between Nov '16 and Nov '18....
Almost 19k of these were in Millcreek alone (roughly 70% of new RVs)... South Jordan gained 2k and Herriman gained 3.2k.
Now let's look at the Turnout by Place between the 2016 Presidential Election and 2018 Congressional Election (Based on Friday's Salt Lake County Vote Numbers)...
()
Here is a graphical version of the same data:
()
What does this tell us?
Turnout was significantly lower in Bluffdale, Herriman, and South Jordan than the overall turnout gap between these two elections to date...
Turnout was only marginally down in Millcreek, Salt Lake City, West Jordan, and West Valley City.
Although this does not necessarily portend that remaining ballots will skew Republican, it is still noteworthy.
Now, let's look at the raw vote numbers by place and party in the 2016 PRES election vs the 2018 CD-04 election.
()
Here's a graphical representation:
()
Let's look a slightly more simplified graph that removes the total vote, in order to make it easier to see how the Democratic Candidate for CD-04 REP increased DEM vs REP raw vote totals just about everywhere, compared to the 2016 Presidential Election.
()
DEMs gained a net +43.3 votes over HRC, while the PUBs gained a net +22.2k votes over DJT.
Both DEMs and PUBs gained raw votes everywhere, except for Kearns, where the PUBs lost 43 votes between NOV 16 GE and NOV 18 GE.
In terms of NET DEM vs REP gains between '16 and '18, DEMs gained more votes in every municipality compared to PUBs with the exception of Herriman (+76 R).
The net gain numbers that stand for DEMs:
1.) Millcreek: +6k DEM
2.) West Jordan: +2.6k DEM
3.) Murray: + 2.3k DEM
4.) Taylorsville: + 2.0k DEM
5.) West Valley City: +1.8k DEM
ok... I could go on, but I suspect y'all get the picture.
What is most remarkable about these numbers, is that it appears in many places, the Democratic vote gains between 2016 PRES and 2018 CD-04 REP, appears to have occurred as a direct result of McMullin and Gary Johnson voters, voting DEM in 2018....
So now, we need to look at the % of Vote by Place between the Nov '16 PRES election and Nov '18 Congressional election....
()
Let's look at this in a graphical format, and a stacked chart probably works best here, especially considering the 3rd Party Vote in 2016 out in Salt Lake County...
()
Wow--- this helps provide a greater context in what appears to be a relative collapse of Republican Party strength, even among voters predisposed to vote for Liberal/Moderate Republicans in the era of Trump, especially among many communities with relatively large Mormon populations.
Something strange is going on here...
Now, in order to understand more fully the impact of the McMullin/ Johnson cross-over voters, as well as potential impacts of population growth within this part of Salt Lake County, we need to look at the % margins and swing by place...
()
Here is a graph that might perhaps more clearly indicate the numbers from the raw data chart....
()
So basically DEMs increased raw % share in every community except for Riverton, Herriman, and South Jordan.
DEM swings were most remarkable in Kearns (+21.5% D Swing '16 > '18), South Salt Lake (+ 16.8% DEM swing '16 > '18), Midvale (+16.1% DEM swing '16 > '18), West Valley City / Salt Lake City (+13.3% DEM swing '16 > '18).
Murray, Sandy, Taylorsville, and Other also saw +10% DEM swings from '16 to '18....
Interestingly enough Millcreek only saw a +5.8% DEM swing between '16 and '18, but the massive increase in new voters added some +6k DEM NET VOTE MARGIN between '16 and '18....
Although the 2018 CD-04 elections in Salt Lake County might well simply be an anomaly, it might also be the "Canary in the Coalmine" when it comes to the future of the Republican Party in Salt Lake County Utah, considering they were effectively slaughtered within the most Republican parts of the County, with a few exceptions.....
Thoughts anyone???
Title: Re: NOVA GREEN's Election Analysis Thread
Post by: Bidenworth2020 on November 19, 2018, 01:03:41 AM
UT-04 is trending towards democrats, but McAdams was a very solid candidate.
Title: Re: NOVA GREEN's Election Analysis Thread
Post by: NOVA Green on November 20, 2018, 11:25:26 PM
So now that we have the final numbers in from Utah CD-04 Time to go back and review what happened in Salt Lake County CD-04.
Let's Start with Turnout by Place compared to the 2016 Presidential Election....
So here's the Table:
()
Here's the Graphical version:
()
So as expected overall voter turnout fell from 82% in the US-Presidential Election, and dropped down to a still impressive 79% for the CD-04 House Election.
We see the biggest Turnout drop in the heavily Republican communities of South Jordan, Herriman, Riverton, and Bluffdale.
The only place where voter turnout increased versus the 2016 Presidential Election is in the fast growing, and potentially a future Democratic Stronghold within Salt Lake County of Millcreek.
We also saw only minor drops in Turnout in the overwhelmingly Democratic precincts in Salt Lake City, and South Salt Lake City, which although they account for a relatively small chunk of the Vote Share within the District and County, do start to add up once you get heavily DEM margins.
Many of the other Cities where Trump lost to HRC by a plurality with a huge McMullin/Johnson 3rd Party Vote, such as Midvale, West Valley City, and Murray, saw a relatively minor drop-off in Turnout.
Holladay, which other than SLC and SSL, and Millcreek, was the only place where HRC gained over 50% of the Vote, had a relatively low drop in Turnout.
Now, let's look at something I mentioned a few days back, but most of you that were just skimming through wouldn't have necessarily caught it....
The fundamental composition of voters by Place within Salt Lake County CD-04 has changed dramatically since Millcreek went from an UNINC CDP to a CITY in DEC '16.
()
Basically what we see here is a City that came virtually out of nowhere, that virtually doubled it's vote share between '16 and '18, and additionally was already a 53-24 HRC City in '16, where RV surged, as well as DEM swings and Turnout.
This is likely something that caught PUBS in CD-04 unawares, regardless of whatever enthusiasm gap may have existed in Republican strongholds within the overall district.
Here's a 2016 to 2018 RV Graph I posted a few days back that more visually shows what population changes has been taking place in the Salt Lake County portion of the District....
()
Ok--- now let's take a look at the 2016 PRES vs 2018 CD-04 REP in an Excel Table for raw numbers:
()
What is fascinating here, is the only place where Republicans actually gained raw vote margins in CD-04 compared to the 2016 PRES election was, * drum roll* a dramatic + 92 NET PUB voters in Herriman....
Even in the heavily PUB communities of Bluffdale, Riverton, and South Jordan, DEMS managed to actually increase their Net Vote Totals....
What that means is likely some of the McMullen voters might have set out the election rather than vote DEM, compared to other parts of the Salt Lake County (IDK ??? I'll let some of my comrades and Mormon DEMs speak to that subject).
So let's look at the 2016 Presidential Results by Place to see where the 3rd Party Votes were most heavily concentrated with Salt Lake County CD-04:
()
Interesting, so the places with the highest 3rd Party Votes for US-PRES in '16 also had some of the lowest Turnout numbers (????)
I could post an updated swing stacked column graph by place to represent, the changed results from the final Salt Lake County vote dumps Yesterday and official numbers from today, and it will likely look much worse for Republicans....
Here is the chart I posted after the Friday 11/16 Update, and quite frankly will look less favorable to the PUBs once the final raw numbers from a traditionally heavily Republican district in South Salt Lake Suburban / Exurban start to kick in...
()
Gray is McMullen / Johnson/ Stein / Pink etc, but it does appear that in most of CD-04 in Salt Lake County 3rd Party voters swung overwhelmingly McAdams, while some voters that could not bring themselves to vote for a Democrat, sat out the CD-04 election (Haven't run over-vote under-vote by precinct and municipality yet).
For any of those out there, the only reason, I have spent so much time on Salt Lake County, is simply, that it is one of those Counties that posts detailed election results by precinct on a regular basis (This is what Democracy looks like folks), whereas I have virtually zero visibility on Utah County.... Still looking forward to pulling the precinct data from all of Utah here in a few short weeks, and looking at a few numbers.
I could do a grand finale... but I will allow the raw data to speak for itself, and "let everyone jump to their own conclusion map" (Office Space ref), but more interested in what observations those closer to the street in Metro SLC have about what is really an extraordinary event.
Title: Re: NOVA GREEN's Election Analysis Thread
Post by: NOVA Green on November 20, 2018, 11:30:21 PM
UT-04 is trending towards democrats, but McAdams was a very solid candidate.
Sure candidate quality counts 100% agreed....
Obviously one of the biggest questions in Utah Congressional Elections, were the results in CD-04 a fluke, or perhaps something that portends a larger and longer term shift, among educated and Middle-Class Voters in Metro SLC (Including Mormon Voters that used to be much more predisposed to Vote DEM back in the '70s, became overwhelming PUB starting in the '80s, and now you have a ton of young Mormon Millennials that don't see eye to eye with their parents on a variety of issues. (???).
2020 could be extremely interesting in Utah with Trump on the ballot....
Title: Re: NOVA GREEN's Election Analysis Thread
Post by: Bidenworth2020 on November 20, 2018, 11:45:24 PM
UT-04 is trending towards democrats, but McAdams was a very solid candidate.
Sure candidate quality counts 100% agreed....
Obviously one of the biggest questions in Utah Congressional Elections, were the results in CD-04 a fluke, or perhaps something that portends a larger and longer term shift, among educated and Middle-Class Voters in Metro SLC (Including Mormon Voters that used to be much more predisposed to Vote DEM back in the '70s, became overwhelming PUB starting in the '80s, and now you have a ton of young Mormon Millennials that don't see eye to eye with their parents on a variety of issues. (???).
2020 could be extremely interesting in Utah with Trump on the ballot....
As for Utah 2020, I suspect a result where Trump cracks 55%, democrats taking 30%, and various third parties taking the rest. Utah county, which, as preciously mentioned, has major growth compared to the rest of Utah, will be one to watch. Do democrats break 20%? are they going to make a dent into mormons? I am excited to see, and for your detailed analysis!
Title: Re: NOVA GREEN's Election Analysis Thread
Post by: smoltchanov on November 24, 2018, 01:08:24 PM
UT-04 is trending towards democrats, but McAdams was a very solid candidate.
Sure candidate quality counts 100% agreed....
Obviously one of the biggest questions in Utah Congressional Elections, were the results in CD-04 a fluke, or perhaps something that portends a larger and longer term shift, among educated and Middle-Class Voters in Metro SLC (Including Mormon Voters that used to be much more predisposed to Vote DEM back in the '70s, became overwhelming PUB starting in the '80s, and now you have a ton of young Mormon Millennials that don't see eye to eye with their parents on a variety of issues. (???).
2020 could be extremely interesting in Utah with Trump on the ballot....
As for Utah 2020, I suspect a result where Trump cracks 55%, democrats taking 30%, and various third parties taking the rest. Utah county, which, as preciously mentioned, has major growth compared to the rest of Utah, will be one to watch. Do democrats break 20%? are they going to make a dent into mormons? I am excited to see, and for your detailed analysis!
Well, it will be interesting to observe at least 2 (probably - more) countertendencies, which may go on in near future in Utah. Basic principles of Mormon religion tend to make most of them (mormon people, who are a majority of Utah population, and usually have large families, so it's more likely, then not, will be in a future too) a conservatives (i am well aware of many exceptions, but say that in statistical sense of this word). But, at the same time, Mormons value education a lot, and, generally, tend to be rather well-educated himself (those Mormons i met during my stay in US were good examples). And, as we know, the better educated public is - the more it tends to vote Democratic of late. Mormons value traditional families, and that pushes them to conservative camp again. But - they value families, and that makes a Trump-style womanizers unpopular among them. And Trump now is an unquestionable "face" of Republican party. And so on. Which factors will prevail in different parts of Utah - open question.
Title: Re: NOVA GREEN's Election Analysis Thread
Post by: NOVA Green on November 29, 2018, 11:03:50 PM
Now we are starting to see State Election offices officially certifying election results, so naturally in some States, this starts to give us opportunities to pull raw precinct level data for our Atlas pleasure, hobby, and past time of minutely dissecting election results in much more detailed level of analysis...
*** 11/29/18 EDIT: Now I will bookend updates at the First Page of the Thread and also in the last page, to make for an easier ability to link to the official State Election websites posting results, regardless for new visitors to the thread, or those that have been following (Although some folks have their Atlas preferences to show last posts at the top, especially in the Mobile App era). ****
I will also be deleting extraneous posting links and updates that I made between the bookends (Excepting links to County level Sites, which might contain precinct data not available on the Statewide Election Sites).
Currently we have the following States that have uploaded Precinct Level Data to their Election Websites....
()
2018 Precinct Results that are accessible from State Election Offices at present in a Centralized manner (Although ease of access varies from click a button to grab an entire precinct data set for a state to much more cumbersome methods....).
Alaska:
http://www.elections.alaska.gov/results/18GENR/
http://www.elections.alaska.gov/results/18GENR/data/resultsbyprecinct.txt
*** Need to scroll down to the bottom Statement of Votes Cast and pull precinct data by State district individually into a PDF format ****
*** Updated 11_25_18 to include link to Text based download as per Cynics comment...
"Alaska finally does have Excel-readable precinct data. You need to go to your link, RIGHT click on "Text by Precinct", and select save."
Arizona:
https://azsos.gov/precinct-level-results-county-2018-general-election
Colorado:
https://results.enr.clarityelections.com/CO/91808/Web02-state.222648/#/rpt
Delaware:
https://elections.delaware.gov/archive/elect18/elect18_general/html/index.shtml
Georgia:
https://results.enr.clarityelections.com/GA/91639/Web02-state.221451/#/access-to-races
*** Need to Download County by County ****
Hawaii:
https://elections.hawaii.gov/wp-content/results/precinct.pdf
Idaho:
https://sos.idaho.gov/elect/results/index.html
Minnesota:
https://electionresults.sos.state.mn.us/Select/Download/115
Nebraska:
https://electionresults.sos.ne.gov/resultsCTY.aspx?type=SW&rid=8862&osn=102&map=CTY
*** Click on the export precinct results to Excel for your selected Contest, and it will generate a really nice spreadsheet with tabs for each County in the State (Awesome!) ***
New Mexico:
http://electionresults.sos.state.nm.us/resultsCTY.aspx?type=FED&rid=4898&osn=180&map=CTY
North Carolina:
https://er.ncsbe.gov/index.html?election_dt=11/06/2018&county_id=9&office=ALL&contest=0
*** THANKS Sorenroy for sharing this on another thread regarding the 2018 NC-09 potential Republican voter fraud.... ;) ***
North Dakota:
https://results.sos.nd.gov/ResultsSW.aspx?text=All&type=SW&map=CTY
*** per cinyc... "(Click on Export --> Precinct for each race) ****
Oklahoma:
https://www.ok.gov/elections/Election_Info/2018_November_General_Election.html
South Carolina:
https://www.enr-scvotes.org/SC/92124/Web02-state.222648/#/cid/21500/c/Sumter
*** This one's virtually useless for the sake of exporting data, but you can pull up individual counties by race and see a map and raw precinct votes ***
South Dakota:
Updated to include Cinyc links...
http://electionresults.sd.gov/resultsSW.aspx?type=SWR&map=CTY (Statewide row races)
http://electionresults.sd.gov/resultsSW.aspx?type=BQ&map=CTY (Statewide Ballot Intiatives)
http://electionresults.sd.gov/ResultsExport.aspx? (By-county exports of all races in the county by precinct)
Virginia:
https://apps.elections.virginia.gov/SBE_CSV/ELECTIONS/ELECTIONRESULTS/
Wyoming:
https://soswy.state.wy.us/Elections/Docs/2018/2018GeneralResults.aspx
*** Have to download precinct results individually by County ***
Obviously we tons of County level precinct data that looks official floating out there, but if I want to go out and grab a County, I would rather just grab precinct data for an entire State whenever possible....
Am I missing any Statewide Precinct level official dumps on my map thus far?
Title: Re: NOVA GREEN's Election Analysis Thread
Post by: NOVA Green on December 02, 2018, 07:44:35 PM
So, before starting to delve into the wealth or Oregon Precinct results available for 2018, I decided it would be interesting to look briefly at the Oregon State House and State Senate elections and compare against the previous elections for those districts.
Firstly, the Democrats maintained a Super-majority in the State Senate, holding an 18-12 majority in the State Senate.
OR- Senate district #26 (Hood River County and Parts of fast growing Exurban SE PDX portions of Clackamas County was a near pickup with only ~ 200 Votes separating the two Candidates.
()
Secondly, Democrats gained (3) States in the State House, maintaining their super-majority going from a (35-25 D) majority to a (38-22 D) Majority.
Let's take a deeper look at the results....
1.) First let's look at the OR-State Senate Results in 2014 and 2018 and then the Swings between 2014 and 2018 for those races that were contested by both major political parties in both elections....
The numbers are broken down as DEM-REP for elections contested by both Parties, and for Elections not contested by one of the major parties a Dem-REP-Other number appears with a 0 representing the Major Party not contesting the Seat.
Additionally the color coding Socialist Red, means that DEMs won the Seat, and a European Conservative Blue represents PUBs won the seat.
2014--- Oregon Statewide Map--- (Not Metro PDX):
()
So looking at this map, obviously there are certain places that in a normal Mid-term election, might well have been targets of Republican pickups, especially with lower turnout among DEM base voters, and the Election being localized as more of a Statewide Election without Trump on the ticket.
SD #3: Medford / Ashland and Rural South JackCo might have looked interesting, considering that the DEM only won it 52-44 in 2016, and it was an open seat.
Still Medford, although it is the largest City in Oregon to vote for Trump, actually swung against the PUB PRES compared to 2012 support for Romney (This was heavily driven by major swings among more affluent and educated voters in East Medford).
Senate District #8: (Corvallis/Albany/ and heavily PUB parts of rural LinnCo) might have been a long-shot pickup, considering that Albany traditionally tends to vote PUB for both Fed and Statewide Elections, college students in Corvallis might have lower voter turnouts in a Non-PRES Year).
Senate District #11: (Heavily DEM precincts in NE Salem and heavily PUB precincts elsewhere) might have been competitive, especially considering that the most Democratic precincts in the district are heavily Latino parts of Salem, where turn-out in an non-pres year election according to Atlas CW, might be expected to be significantly low).
For the DEMs, the only real pickup opportunity in this map was OR- Senate District #26.
Now let's look at the results by State Senate District in "Downstate Oregon" in 2018:
()
So what do we see here?....
State Senate District #10: We see the PUB Senate Minority leader Jackie Winters almost voted out (46-54 R), despite running unopposed in 2014 by a DEM and bagging 87% of the Vote, and having a strong reputation as a Liberal Republican in a heavily Democratic part of Marion County.
https://en.wikipedia.org/wiki/Jackie_Winters
State Senate District #13: Looks a bit closer than expected, despite including the marginal Republican City of Keizer, and heavily PUB rurals, and slivers of Exurban PDX.
State Senate District #26: Almost falls, we'll get back to that later.
Now let's look at the swings between 2014 and 2018 for those OR-State Senate Districts contested by both major parties in both 2014 and 2018...
()
So, we see a relatively minor swing in OR State Senate District #3 (Ashland/Medford/So JackCo) towards the DEMS.
No swing in OR SSD # 6 (Heavily PUB rural LinnCo, fairly PUB rural LaneCo, but enough heavily DEM parts of Metro Eugene-Springfield to keep things inelastic.
Massive swing in OR SSD # 8 (Corvallis-Albany and rural PUB LinnCo)--- +19% DEM swing !!!
So the interesting thing here is that the Benton County portion of the district is heavily DEM, with Corvallis being one of more Democratic Cities in Oregon, and the next largest community being North Albany (Marginal PUB), the Linn County portion of Albany +10% Trump and overwhelmingly PUB rurals elsewhere within the district (Excepting Uninc East Corvallis portion of LinnCo).
Both Linn and Benton added about 5k votes for this election (SSD 8) between '14 and '18....
Benton went from (64-35 D) in '14 to (73-25 D) in '18. +19% D Swing
Linn went from (42-57 R) in '14 to (48.6% D- 48.7% R) in '18. +15% D Swing
It appears that Democrats convincingly won the City of Albany for a Statewide contest for the first time in (???), and most significantly the Linn County portion of Albany.....
SD #11: (NE Salem, Woodburn, and large sections of rural Marion County).
+ 12% DEM swing....
This will be an interesting race to look at once I get a chance to look at precinct level results, since there is pretty large Latino population within this District, and I'm curious about *where* the swings happened....
SD #12: (Hood River County, small # of voters in East MultCo, heavily Exurban PDX ClackCo) +13% DEM swing....
This District almost flipped, and interestingly enough it includes what used to be a heavily Republican Exurban part of Metro PDX (Happy Valley) not to mention Sunnyvale, etc, which used to be strongly PUB parts of ClackCo, but started to swing heavily against the PUBs in PRES elections between '12 > '16....
More to look at here, once I get a chance to check out precinct results.
METRO PDX:
2014 State Senate Results:
()
2018 State Senate Results:
()
2018 State Senate Metro PDX Swing Results:
()
Not much to see here, considering almost all of the districts did not face any Republican competition in either/or 2014/2018....
The +10% DEM swing in State Senate District #15....
This perhaps not particularly surprising considering that it is heavily based around the City of Hillsboro, although it does include more rural and Exurban areas such as Forest Grove and North Plains....
Hillsboro is a hidden story about the massive shifts in Democratic voting patterns in Washington County Oregon (Pop 100k+).
The Corp HQ of Intel is based in the City, and includes the best world class semi-conductor Fabs in Oregon, with perhaps the exception of B-2 or B-3 fabs in HP-Corvallis....
Hillsboro is only 59% Anglo, 11% Asian, and 23% Latino....
It will be extremely interesting to look at precinct level swings in Hillsboro in 2018.
Enough for OR-State Senate, next stop OR-State House....
Title: Re: NOVA GREEN's Election Analysis Thread
Post by: NOVA Green on December 02, 2018, 09:27:55 PM
Now time to look at the OR-State House Election Results from 2018, and contrast against performance in 2016....
Here are the results for OR State House Races in "Downstate OR (Excepting Metro Salem and Metro PDX).
2016:
()
The first thing that stands out on this Map is how many potential PUB flips there were in "Downstate Oregon:....
Obviously OR House District # 9, 11 & 14 obviously jump out as potential PUB pickups in "Downstate OR:....
Fine... let's look at the results in "Downstate Oregon" State House results in 2018:
()
Hmm, these numbers don't actually look that bad for DEMs in "Downstate Oregon"....
So fine what do the swings show between 2016 and 2018 by Downstate House Districts where both of the Two major Political Parties contested both elections?
()
This map is perhaps much more fascinating than the OR-SEN map, since we actually have a direct compare/contrast for every OR-State House district between '16 and '18 in a fairly high turnout election....
The first thing that stands out here are:
1.) The Significant swings towards DEM OR-House Candidates in the major population centers of the Rogue River Valley in Jackson/Josephine Counties....
LD #5 we can likely ascribe to high Democratic Turnout in an off-year election within Ashland.
LD #6 starts to become more problematic, considering that Medford was a +10% Trump town in '16, albeit slightly shore of a majority of the vote (??? Need to double-check numbers)...
If Medford starts to become a Democratic City, then Jackson County will become a LEAN DEM County, and let's put it this way, it's not too long before Curry and Josephine Counties start to become more like toss-up Counties...
Now, let's roll through some of the other State House Districts in Downstate OR...
OR HD #7: +19% DEM SWING..
I get that there are parts of rural Lane County that are LEAN DEM, and most of the Douglas County parts of the District that are Overwhelmingly PUB, but it's one of those instances where it appears that overwhelmingly small-town and rural Timber Country swung heavily DEM for a Statewide Candidate...
OR HD #9: +4% DEM Swings....
Includes an Ancestral DEM area of Coos Bay/ North Bend, Reedsport, and Florence, and some areas out in the hills between the Southern Oregon Coast and the Coast Range....
OR HD # 14: +18% DEM Swings....
(West Eugene and Junction City, and some Rurals)....
Outer West Eugene has historically been a fairly PUB part of Eugene, and Junction City is an historic Mill Town + RV MFG jobs.... Without looking at exact swings within precincts, it still is likely the case that these results are likely a mixture of increased DEM swings in West Eugene, combined with Obama '08 / Trump '16 WWC Voters coming home....
OR HD # 15: (Albany plus rural LinnCo).
One of the largest swings in the OR House between '16 and '18....
Part of it is likely the DEM hit a floor in '16, and there was a huge bounce back in '18.
Still, Albany, Oregon has long been on my radar as a place that will increasingly start to swing heavily Democratic, as Younger and Working-Class Families are forced to relocate to cheaper places to live as the cost of housing has exploded over the past Five Years within the Linn-Benton County economic community.
We see additional crazy DEM swings in House Elections in Downstate Oregon, from HD # 59 (Wasco and Jefferson Counties)... + 16% DEM
Roll down into HD # 53: (Rural Deschutes plus places like Black Butte, and the other elite retirement resort communities).... +22% DEM
There were a few bright spots for PUBs in the 2016 > 2018 State House Election swings in Downstate Oregon...
DEMs saw their losing margins decrease by 29% in Bend between 2016 and 2018....
This was an election in HD # 54 that should have been a DEM pickup in a wave year, but the DEM candidate basically caused a huge % of voters to vote 3rd Party, although the PUB only won with 54% in a District which logically should have flipped in 2018....
OR- HD-32 is something that deserves further examination, but it's really looking this might be one of the only parts of the State where Buehler was able to gain some action on down-ballot elections....
Now let's look at Metro-SALEM 2016-2018:
2016:
()
2018:
()
2016 to 2018 Metro Salem Swings:
()
So.... here we start to see more interesting data develop...
In every State House District in Metro Salem, we saw a ~ +10% DEM swing between 2016 and 2018, with the exception of House District #20....
Now let's take a look a Metro PDX House Districts:
2016:
https://uselectionatlas.org/FORUM/index.php?action=gallery;sa=view&id=21887
2018:
()
2016 > 2018 Election Swings:
()
So what do we see here???
The Republican Party is now eliminated from representing any OR-House Districts in Metro-PDX after this past election....
Their last House Districts in Metro PDX (HD # 26 and HD #37) were eliminated.
Additionally places like HD # 40 and #51 in precisely the types of Exurban State Senate Districts that PUBs need to be competitive in, and additionally when you see +19% D swings in HD # 30, +10% D swings in HD # 35, +14% in HD # 39, +13% in HD #33, it's no wonder that Knute Buehler likely suffered heavily as part of being associated with a Toxic Republican brand, where even the Exurbs of Metro PDX are starting to vote DEM on Downstate ballots, despite the relative popularity of their "Moderate PUB Represenatives..."...
Dominos have yet to fall for the Republican Party in Oregon, unless they start to grow a pair and effectively become an independent party from the National Republican Party, since it's pretty clear that the Emperor has no Clothes, and that Oregonians running under a Republican banner are schills for a much deeper and darker agenda....
Title: Re: NOVA GREEN's Election Analysis Thread
Post by: NOVA Green on December 27, 2018, 08:55:12 PM
Now that we are starting to see some precinct level results flowing in some Counties within this Congressional District, it is time to go back and take a look at these results in further detail....
Let's start with the Vote Share by County from 2012 to 2018 for the US-House Race to see what that tells us when it comes to the overall distribution of voters by Place....
()
Perhaps not surprisingly, especially in a Midterm Election Bexar County continued to expand their vote share, now accounting for 51.4% of Ballots Cast and Accepted for the CD-23 election....
The next largest Vote Bank within CD-23 (a sliver of El Paso County), has continued to oscillate when it comes to Presidential Election Years versus Midterm elections, but still finished +2.5% greater total CD-23 House Vote share compared to 2014.
Although El Paso County lost 0.5% of Vote Share compared to the 2016 GE House Vote, it's the only other County other than Baxter, which has actually gained Vote Share compared to 2012...
Medina County did narrowly gain vote share compared to 2016 GE Results, although still 0.8% lower than the 2014 Midterms.
Ok--- now let's look at the raw vote margins by County for CD-23 House Elections between '12 and '18....
()
So we see the Republican stronghold within CD-23 of Bexar County, have the best performance for a Democratic House Candidate since before 2012....
We see El Paso County precincts of CD-23 well out-perform the 2014 CD-23 election, and even 2012 Presidential Year Election US-House Election numbers within the District (!!!).
We see heavily Republican Medina County, come close to their 2016 CD-23 House Election margins (!!!).
We see Democratic Margins collapse in Val Verde County, which has been traditionally even in the 2014 Midterm Election, been a reliable DEM RAW VOTE MARGIN BANK....
This is extremely odd, especially if we contrast against 2014, but unfortunately I haven't been able to smoke out the precinct results yet for that County, but certainly something we all need to examine in much more detail....
Maverick County still performs much better than their 2014 CD-23 performance for a DEM candidate...
Uvalde County: Again something weird going on there (See Val Verde County above)....
Zavala County: Holds their own and DEM margins increase significantly compared to 2014.
Meanwhile, DEM RAW VOTE MARGINS take hits in many of the small rurals and "OTHER Counties" category (We'll get back to that later once I start going through County level detail).
Now let's look at the raw margin swing by County '16 to '18 for the US-House Race in TX-CD-23
()
What we see here are the types of swings the DEM Candidate needed to hit in the right places....
Those Bexar County swings are crazy....
I will be going back and taking a look at this in greater detail, starting with the precincts of Bexar County, but it's pretty clear the DEM had a major issue among a handful of overwhelmingly DEM Counties in the Rio Grande Valley, even after adjusting for lower voter turnout in some of these heavily Latino border Counties, although this pattern was not universal which raises the question as to why....
Title: Re: NOVA GREEN's Election Analysis Thread
Post by: NOVA Green on December 28, 2018, 01:12:42 AM
Let's go back to Bexar County precincts of TX-CD-23 and take a look at how the relatively affluent Anglos that dominate the voting population have historically voted (Although there are certainly plenty of Latino populations within the Bexar portion of the District)....
Although many of these voters are "Anglo Water Park Moms" that take their kids down to mingle with the heavily Tejano and 2nd and 3rd Generation Mexican-Americans all trying to beat the heat of the hot Central Texas sun, people retreat to their neighborhoods, and the temp cools off quicker in the Hills around SA, and plus Central AC helps out (Although it comes with a massive cost, especially the bigger the house).
I digress:
Here are how voters within TX CD-23 have voted for Federal Elections between 2012 and 2016 in a Chart Form:
()
ok--- that's a bit of a crap graph....
Let's look at it from another angle....
()
WOW---this is absolutely Crazy---- !!!
Blue is Democrat and Orange is Republican....
BETO won the Anglo 'Burbs of SA in CD-23....
Next stop delving further into the Weeds of this mystery, to see *** WHERE *** all of this occurred so maybe we can decipher the *** WHY ***
I do know that there are CD-23 precincts where Ortiz-Jones did better than BETO and the contrary, but regardless these are some pretty devastating numbers for PUBs in TX....
As I observed in the late '80s and early '90s in Oregon / Washington, once the 'Burbs start to flip and see themselves as a "Metro United" vs "Metro Divided", things start to shift....
We some something similar in NorCal in the early / Mid 1990s, and a bit later on in SoCal....
Still, not enough data points, but if DJT is the PUB PRES candidate, I suspect there is a good chance his numbers will collapse further in out here, and a decent chance he will drag down Hurd with him....
Title: Re: NOVA GREEN's Election Analysis Thread
Post by: NOVA Green on December 28, 2018, 03:28:56 PM
Time to shift gears a little bit and start to break down Bexar County CD-23 into slightly greater detail....
Let's start with looking at the most Republican part of the County, the Northeastern Part of the District....
It consists predominately of precincts located within the City of San Antonio, as well as some Unincorporated areas, that are effectively suburban in nature.
()
These precincts collectively accounted for 33.0% of the US REP '16 CD-23 part of Bexar County, and 39% of the US REP '14 CD-23 part of Bexar County....
Let's take a peak at how they voted in recent elections....
()
So we see that at the Congressional Level, this part of the District tends to vote 2:1 Republican, but that there was a huge 17% gap between 2016 PRES results vs 2014/2016 US-REP results....
Although Trump still won here convincingly, there was a +19% D Swing at the Presidential Level between 2012 and 2016....
If the ~ +20% Dem Pres swing number doesn't ring a bell with anyone, the Atlas Collective can provide a comprehensive list of places where these types of swings occurred.
Now, what is interesting here is that we didn't really see any impact between '14 and '16 at the US-House level....
One of the key questions that surely occurs to many of us, are the midterm polling and special election results we are seeing simply a lagging indicator in many districts where among certain populations there was a massive swing at the Presidential Level, but no real movement at the Congressional Level?
Will voters in TX CD-23 NE Bexar County vote Democratic for their local Representative at the same levels they did for US President in 2016?
If so, that could obviously make the difference, even in a Non-Presidential Election Year.
Social-Demographics of the Republican Strongholds of CD-23 Bexar County Northeast....
This gets tricky, because of the heavily distorted Pub Gerrymandered map makes it difficult to align Census Tract data with Precinct data, without spending hours and hours of time....
Let's start with the canary in the coalmine...
Here is a map of "White Non-Latino Population" by Census Tract...
The oval black outline roughly corresponds to the Anglo Population within Bexar County CD-23 NE.
()
So, here we see one of the more heavily Anglo portions of Bexar County... I could pull a graphic of the Latino % of total population, African-American, Asian-American, etc, but without really delving into the details of individual precincts, I'm not sure the labor-hours invested would be worth the ROI.
Still, it is important to remind folks out there that Latino % of Total Population does not equal Latino % of VAP.... This is a result of multiple factors, but one of the biggest is simply that the Latino population tends to be lower in age than other communities, including many under the age of 18.
Let's look at the big picture when it comes to MHI within this portion of the District...
()
So what we see here is that "generally" these places tend to have a much higher Median Household Income than most other places within Bexar County....
Now, I could post multiple maps of Educational Attainment (Would have to be multiple since the source I use splits the Census Maps by levels of Attainment).... but once again, you will see that same correlation....
So.... Will the most Republican Voters in TX CD-23 (Outside of smaller rurals---) pull a ballot for Ortiz-Jones (D) vs. Hurd (R-Incumbent)? It doesn't take a massive swing, basically these types of folks voting US-House closer to how they voted for US-PRES, to flip this seat.
Now that we have the precinct results available for Bexar County, I went back and reviewed the 2018 numbers for US House CD-23 and US-SEN-TX for this part of the district.
Let's go back to the Vote Share for US-REP from these NE Precincts...
2018: 33.5% of Bexar County CD-23
2016: 33.0% of Bexar County CD-23
2014: 39.0% of Bexar County CD-23
Essentially what this tells us here is that these precincts reverted to more of a typical vote share of a Presidential Election Year in 2018, rather than a Midterm Election Year (As the abysmal Turnout in 2014).
Now what do the Raw Votes tell us for Federal Elections between 2012 and 2018?
()
So here we see the total vote looking like the following:
2012: 33.5k to 34.0k (US-House to PRES)
2014: 22.0k (US-House)
2016: 38.0k to 38.5k (US-House to PRES)
2018: 36.1k to 36.5k (US-House to US-SEN)
Pretty impressive Turnout in 2018, considering that it was roughly 95% of the 2016 PRES numbers, and 7% higher than the 2012 PRES numbers, even if we account for some population growth here.
If we look at the Raw Vote by Party, we see BETO hit 15k raw Votes, for a +1.4k gain over HRC in 2016, and essentially created a new record performance for a DEM in this part of the District.
We see the DEM candidate for CD-23 gain a raw +1.7k Votes compared to the performance in 2016, which was the next highest raw DEM vote here.
On the PUB side, we see Cruz lose 2k votes compared to 2012, while BETO gained 6k votes compared to the DEM in 2012.
The PUB candidate for US REP lost 2.7k votes compared to 2016, but still well out-performed Cruz, and even beat Trump's 2016 Votes, still while losing a significant number of votes!
PUBs will typically bag a net +12k to +14k raw vote lead over their DEM challengers alone from these precincts, so a +6k to +10k lead is less than impressive regardless.
Now, let's look at that same data as a % of support for Federal Candidates 2012 to 2018 by Party:
()
So here we see that Republicans typically grab 67% to 70% of the vote, while Democrats have struggled to hit 30%.
Something changed for the 2016 Presidential Race, however as Republican support plummeted to 58.8%, and HRC garnered 35.4% of the Vote (With 5.8% going to 3rd Party Candidates).
For the US-SEN race in 2018, the DEM managed to capture 41.2% of the Vote, and Cruz numbers dropped to 58.0%.
For the CD-23 House race, the DEM came just slightly under HRCs numbers with 35.3% support, and the PUB sank to 63.2%.
One interesting item to look at here, is that appears that BETO benefited from 3rd Party voters (Combined with winning some Trump '16 Voters), but for the US-House race, that does not appear to have been as much the case.
Let's close with looking at the Swings compared to some previous elections...
()
If we look at the 2018 Senate Race we see a +25% DEM swing compared both the 2012 PRES race and the 2012 TX-SEN race!
If we compare the 2018 SEN race against the 2016 PRES race we see a +6.6% DEM Swing.
If we compare the 2018 CD-23 race against the 2016 PRES race, we see a +4.5% PUB swing.
If we compare the 2018 CD-23 race against the 2016 CD-23 race, we see a + 9.8% DEM swing.
So in closing, although BETOs performance we impressive, it's pretty clear the collapse of PUB support at the Federal level started at the Presidential Election of 2016, and that the 2018 TX-SEN race was simply a continuation of that trend.
If we look at the DEMs performance for CD-23, although PUB support was still higher than Trump's support, there was a significantly larger swing towards the DEMs contrasted against the Senate Race. As I suggested prior to the 2018 election, the US-House race was likely going to be a lagging indicator of a process that started for PUBs in these parts at the time of '16 PRES election.
It would not be surprising to see these trends continue in 2020 if Trump is still the de facto leader of the Republican Party.
Title: Re: NOVA GREEN's Election Analysis Thread
Post by: NOVA Green on December 28, 2018, 10:56:51 PM
Time to take a trip down to the "Democratic Heartlands" of Bexar County CD-23, down to Southeast, South, and Southwest San Antonio....
()
Now some of you might say, wait why was this precinct in SE or South SA not included, but reality was that I was trying to focus on more heavy population dense precincts, since there are some additional precincts, not included in my outline that are technically part of the City, but don't appear to have high pop density....
Let's start with the SE Portion of San Antonio located within the CD-23 portions of Bexar County....
()
County Vote Share: 2016 US-House 4.9% of Bexar Co CD-23, 2014 US-House 4.9%, 2012 9.6% of US-REP vote Share....
So right there we have multiple questions:
1.) Why did the Vote Share of these precincts drop 50% between 2012 and 2014/2016?
A.) The obvious answer is that other parts of Bexar County CD-23 are growing more rapidly in
population, especially since the variance between '12/'16 US-REP numbers can't be
explained by a low turnout '14 US-REP election.
B.) An alternative hypothesis might be that for whatever reason, VAP population growth increased here between '12 and '16 roughly equivalent to elsewhere within the Bexar County CD-23 SE San Antonio precincts, but voters were less motivated than in other parts of the District within the County.
2.) Why was 2014 such a hot year for a Democratic House Candidate in the District compared to 2012 and 2016 (Which should be contrary to conventional political wisdom)?
3.) Why was there a +15.9% swing towards Trump in an overwhelmingly Democratic Neighborhood(s) of San Antonio?
A.) 3rd Party Voting does not appear to be the primary reason at the Presidential Level,
considering Dems lost 9.2% between '12 and '16 and Trump gained 6.7%.
B.) Drop-Off of Down-Ballot Voters did play a factor in the margins between the 2014 and 2016 in
the US House Race, but even there only account for maybe 30% of the -15% Dem numbers
for that race and the +10% Rep numbers for that race when we compare 2014 to 2016.
Ok--- Let's take a look at the Demographics of Bexar CD-23 SE:
Let's start with the % of population that is African-American for the three Census Tracts overlapping these precincts.
()
Note that the African-American population is even higher for the 0-17% age range than the overall population of these Census Tracts...
Now what about the Latino population for these three Census Tracts?
()
And of course we need to look at the Anglo population by Census Tract:
()
Ok a few more data points:
Census Tract: 131200 (Far West Tract)-
MHI: $30.4k /Yr
ED Level: 7.6% > HS Diploma, 58.8% HS Diploma, 33.6% No HS Diploma
Relative Occupations: Construction (11.0%), Transportation (10.5%), Food Service (9.4%)
Relative Industries: Health Care (22.7%), Construction (14.3%)
Census Tract: 131300 (Middle Tract)-
MHI: $36.0k/Yr
ED Level: 27.4% > HS Diploma, 17.9% No HS Diploma
Rel Occupations: Administrative (25%)
Rel Industries: Retail / Construction
Census Tract: 131401 (Eastern Tract)-
MHI: $ 65.5k/Yr
ED Level: 31.8% > HS Diploma, 51.8% HS Diploma, 16.4% No HS Diploma
Rel Occupations: Administrative (16.9%), Repair (11.1%), Construction (10%)
Rel Industries: Health Care (14.5%), Hospitality (11.4%), Education (11.0%).
Whew--- Ok so basically the far Western area has an extremely large working-class African-American and Latino population, with the same rough pattern in the Central Area, and the Eastern Area is much more Middle-Class Latino...
So what does this tell us about the results of recent elections within the district?
In order to try to more closely overlap the Census Tract data with the precinct data, I needed to consolidate the precincts on the Western Part of the Loop 410 from the Eastern Part...
Let's look at the total Vote by Region by Party by Election from 2012 to 2016:
()
What are some key takeaways here?
1.) There was an increase in approximately 700 voters between the 2012 and 2016 Pres Election.
This growth was entirely concentrated in the Eastern portion.
2.) The Eastern portion, although it is still heavily Democratic, is much less so than the Western Portion, which accounted for the bulk of the total margin swings here between '12 and '16.
3.) In the more heavily African-American precincts of Western SE Bexar CD-23, there was no visible drop-off in support at the Presidential level between '12 and '16 for the Democratic Candidate (Obama 1,943 Votes 2012 and HRC 1,942 Votes 2012). Conversely on the Republican side (Romney 614 Votes and Trump 615 Votes) !!!
4.) The Republican Candidate for CD-23 gained an additional 120 votes between '12 and '16, which appear to have pretty much all come from DEM CD-23 Voters....
It could well be that Will Hurd is performing significantly better among African-American voters within the District than Republicans typically tend to perform.
5.) It will be interesting to see what turnout will look like here in Nov '18 with marquis elections for TX-SEN and TX-GOV attracting attention, compared to 2014....
6.) The Eastern portion of Bexar County CD-23 is where the growth is at, and Trump gained +224 Votes over Romney, whereas HRC gained only + 296 Votes over Obama. 3rd Party Candidates garnered 114 Votes.
7.) If we look at the '12 to '16 results in the Eastern Precincts for US-REP-CD 23, we see the PUB gain + 360 votes and the DEM gain + 101 votes.
Although I haven't looked at Population growth rates within this Census Tract, it's pretty clear there were a significant number of HRC > Hurd Voters in the Middle-Class and more heavily Latino precincts of the Eastern portion of this part of the District.
How will Middle-Class Latinos vote in November 2018 for TX-SEN and US-House- TX- CD 23?
()
Now some of you might say, wait why was this precinct in SE or South SA not included, but reality was that I was trying to focus on more heavy population dense precincts, since there are some additional precincts, not included in my outline that are technically part of the City, but don't appear to have high pop density....
Let's start with the SE Portion of San Antonio located within the CD-23 portions of Bexar County....
()
County Vote Share: 2016 US-House 4.9% of Bexar Co CD-23, 2014 US-House 4.9%, 2012 9.6% of US-REP vote Share....
So right there we have multiple questions:
1.) Why did the Vote Share of these precincts drop 50% between 2012 and 2014/2016?
A.) The obvious answer is that other parts of Bexar County CD-23 are growing more rapidly in
population, especially since the variance between '12/'16 US-REP numbers can't be
explained by a low turnout '14 US-REP election.
B.) An alternative hypothesis might be that for whatever reason, VAP population growth increased here between '12 and '16 roughly equivalent to elsewhere within the Bexar County CD-23 SE San Antonio precincts, but voters were less motivated than in other parts of the District within the County.
2.) Why was 2014 such a hot year for a Democratic House Candidate in the District compared to 2012 and 2016 (Which should be contrary to conventional political wisdom)?
3.) Why was there a +15.9% swing towards Trump in an overwhelmingly Democratic Neighborhood(s) of San Antonio?
A.) 3rd Party Voting does not appear to be the primary reason at the Presidential Level,
considering Dems lost 9.2% between '12 and '16 and Trump gained 6.7%.
B.) Drop-Off of Down-Ballot Voters did play a factor in the margins between the 2014 and 2016 in
the US House Race, but even there only account for maybe 30% of the -15% Dem numbers
for that race and the +10% Rep numbers for that race when we compare 2014 to 2016.
Ok--- Let's take a look at the Demographics of Bexar CD-23 SE:
Let's start with the % of population that is African-American for the three Census Tracts overlapping these precincts.
()
Note that the African-American population is even higher for the 0-17% age range than the overall population of these Census Tracts...
Now what about the Latino population for these three Census Tracts?
()
And of course we need to look at the Anglo population by Census Tract:
()
Ok a few more data points:
Census Tract: 131200 (Far West Tract)-
MHI: $30.4k /Yr
ED Level: 7.6% > HS Diploma, 58.8% HS Diploma, 33.6% No HS Diploma
Relative Occupations: Construction (11.0%), Transportation (10.5%), Food Service (9.4%)
Relative Industries: Health Care (22.7%), Construction (14.3%)
Census Tract: 131300 (Middle Tract)-
MHI: $36.0k/Yr
ED Level: 27.4% > HS Diploma, 17.9% No HS Diploma
Rel Occupations: Administrative (25%)
Rel Industries: Retail / Construction
Census Tract: 131401 (Eastern Tract)-
MHI: $ 65.5k/Yr
ED Level: 31.8% > HS Diploma, 51.8% HS Diploma, 16.4% No HS Diploma
Rel Occupations: Administrative (16.9%), Repair (11.1%), Construction (10%)
Rel Industries: Health Care (14.5%), Hospitality (11.4%), Education (11.0%).
Whew--- Ok so basically the far Western area has an extremely large working-class African-American and Latino population, with the same rough pattern in the Central Area, and the Eastern Area is much more Middle-Class Latino...
So what does this tell us about the results of recent elections within the district?
In order to try to more closely overlap the Census Tract data with the precinct data, I needed to consolidate the precincts on the Western Part of the Loop 410 from the Eastern Part...
Let's look at the total Vote by Region by Party by Election from 2012 to 2016:
()
What are some key takeaways here?
1.) There was an increase in approximately 700 voters between the 2012 and 2016 Pres Election.
This growth was entirely concentrated in the Eastern portion.
2.) The Eastern portion, although it is still heavily Democratic, is much less so than the Western Portion, which accounted for the bulk of the total margin swings here between '12 and '16.
3.) In the more heavily African-American precincts of Western SE Bexar CD-23, there was no visible drop-off in support at the Presidential level between '12 and '16 for the Democratic Candidate (Obama 1,943 Votes 2012 and HRC 1,942 Votes 2012). Conversely on the Republican side (Romney 614 Votes and Trump 615 Votes) !!!
4.) The Republican Candidate for CD-23 gained an additional 120 votes between '12 and '16, which appear to have pretty much all come from DEM CD-23 Voters....
It could well be that Will Hurd is performing significantly better among African-American voters within the District than Republicans typically tend to perform.
5.) It will be interesting to see what turnout will look like here in Nov '18 with marquis elections for TX-SEN and TX-GOV attracting attention, compared to 2014....
6.) The Eastern portion of Bexar County CD-23 is where the growth is at, and Trump gained +224 Votes over Romney, whereas HRC gained only + 296 Votes over Obama. 3rd Party Candidates garnered 114 Votes.
7.) If we look at the '12 to '16 results in the Eastern Precincts for US-REP-CD 23, we see the PUB gain + 360 votes and the DEM gain + 101 votes.
Although I haven't looked at Population growth rates within this Census Tract, it's pretty clear there were a significant number of HRC > Hurd Voters in the Middle-Class and more heavily Latino precincts of the Eastern portion of this part of the District.
How will Middle-Class Latinos vote in November 2018 for TX-SEN and US-House- TX- CD 23?
Now time to take a look at a small handful of Precincts in South-East San Antonio that account for one of the largest concentrations of African-American Voters within CD-23.
This small neighborhood is basically on the edge of a relatively large historically Black Community in Eastern San Antonio, where Racist "Red-Line" real estate policies dictated who could live where as part of systematic policies practiced from the Northern States to the Deep South....
With the end of Racist Housing policies in the '60s, like many other Metro Areas in the Country, gradually Younger Residents relocated elsewhere, while older Residents stayed behind.
With the dramatic increase in Mexican Migration to America, many of these historically Black neighborhoods in Texas started to take on a more varied population, as newer immigrant populations created businesses and homes in small family neighborhoods.
TX CD-23 is not a major Black Community, if we look at it within the traditional context of the African-American experience, but yet within the Latino-American experience it is not unusual at all to have Black-Latinos from South America and the Islands living among Mexican and Central-American communities (As I experienced first hand with friends and co-workers in Houston Texas).
So, let's take a look at how this neighborhood has voted in Federal Elections from 2012 to 2018...
()
TOTAL VOTES:
1.) Obviously a significant decrease from '16 > '18
2012: Total Votes ran from 4.8k to 4.9k
2014: Total Votes--- 2.7k
2016: Total Votes--- 5.5k to 5.6k (US-HOUSE to US-PRES)
2018: Total Votes--- 4.9k to 5.0k (US-HOUSE to US-SEN)
DEMS in '18 held steady at their 2012 numbers of +2.3k DEM > +2.6k DEM numbers in the TX-SEN race ( + 2.3k DEM) close to the +2.4k DEM numbers in the PRES race in '16.
DEM raw vote numbers in CD-23 dropped to +2.0k DEM, which matched the '16 HOUSE numbers, despite a much lower Turnout than in a PRES Election Year...
Still a pretty impressive performance compared to the 2012 GE overall, and certainly nothing to sneeze at in the TX-SEN and CD-23 Raw Vote Margins....
Now let's look at the % by Party for FED races 2012 to 2018:
()
William Hurd actually captured the highest % of a FED PUB in these precincts since before 2012, with 28.4% of the Vote (!!!).
Although these numbers might not sound impressive, he only won 27.7% in 2016, and the PUB only got 26.1% in 2014, and 21.3% in 2012. (!!!).
Although these aren't tons of votes, Turnout and Margins matter in close elections....
Meanwhile BETO captured 72.5% of the Vote, which although respectable, was still below Obama's 73.2% Vote in 2012, and the DEM HOUSE REP's 74.0% in that same Year....
We could blame it all on a Midterm Turnout deal, but in fact Ortiz-Jones actually lost 6% compared to the 2014 Mid-Term election.
Although the DEM margins of victory overall have relatively minor shifts for most of these elections, it is interesting that DEMs were winning with + 46-53% Margins in 2012 and 2014, and now only BETO hits the +46% Margin number....
Still relatively small chunk of the vote in Bexar, but important nonetheless, especially considering swings in some of the Anglo Neighborhoods within the CD in Bexar.
Next Stop South SA (San Antonio for those of you not familiar with Texas).
Title: Re: NOVA GREEN's Election Analysis Thread
Post by: NOVA Green on December 29, 2018, 09:58:35 PM
Now it's time to take a look at a part of Bexar County CD-23 that I wasn't able to hit prior to the 2018 Midterm Elections: WEST SAN ANTONIO:
The precinct map outline looks slightly different than my first go-around for this part of the district, since after reviewing the Demographics, it made sense to lump these heavily Latino Precincts into one basket....
Let's start with a Map of the Precincts included in this exercise....
()
If we look at the overall Census Tract Data we see something like the following....
Anglo Population by % of Census Block Groups:
()
So basically Anglos run between 14% and 20% of the total Population....
Latino Population by % of Census Block Groups:
()
The Latino population runs between 62% and 74% depending upon which Block Group you are looking at...
Now, let's take a look at the Black Population of West SA living within these precincts by Census Block Tracts...
()
Time to take a look at the Median Household Income by Census Block Tract....
()
I could go into Educational Attainment, Occupations, and other such items, but unfortunately these take quite a bit of time to pull at a Micro level, but roughly it looks like 13% of the Pop has a Bachelor's Degree, and 25% has a Post-Secondary Degree, with these numbers higher in the Western Portion of the "Neighborhood".
So, I think this gives us something to work off of Demographic wise....
Now let's take a look at Election Results !!!!
First Let's start with the Bexar County Vote share of this part of CD-23 for US-House Elections between 2012 and 2018....
2012: 15.1 % of Bexar County CD-23 Vote Share
2014: 13.5 % of Bexar County CD-23 Vote Share
2016: 17.2 % of Bexar County CD-23 Vote Share
2018: 16.8 % of Bexar County CD-23 Vote Share
So apparently it's not just some of the Anglo 'Burbs that are increasing in vote share, with these precincts now accounting for roughly 17% of the County Vote in both '16 and '18 (I would not be surprised to see it higher in 2020)...
Here are the raw votes between 2012 and 2018 for Federal Elections in Bexar County--- West San Antonio Precincts....
()
So.... what does this tell us???
TOTAL VOTES:
1.) There was a massive surge in new voters between '12/'14 and '16 /'18 in this part of CD-23.
This may well have been driven by a multiplicity of factors:
A.) Expansion of Housing in a Fast Growing Metro Area with close proximity to the Freeways.
B.) Increase in voters coming of voting age (In this area more likely to be Latino).
C.) Dramatic increase in voter Registration and Turnout starting in 2016 compared to previous Elections in the notoriously low-turnout State of Tejas.
2.) Although without much more Political Electoral Forensics, we can't speak to the exact reason for the growth in total voting numbers, the outcome of voting in Federal elections is apparent.
A.) There has been a significant increase in Democratic Vote margins associated with these trends...
DEMs are now banking +5k Raw Vote Margins from this part of Bexar County....
HRC beat DJT by + 5.9k here in 2016....
BETO bear Cruz here by + 6.8k in the 2018 TX-SEN Election
B.) If we look at the CD-23 Race:
2012: + 4.4k DEM
2014: + 1.6k DEM
2016: + 3.9k DEM
2018: + 5.8k DEM
So, Gina Ortiz-Jones adds another +1.7k Votes into her bag in Bexar County...
Now let's look at the % support for Federal Candidates between '12 and '18 out here...
()
1.) Democrats hit record levels of support in 2018---
US-SEN: 67.9% DEM
US-HOUSE: 64.5% DEM
Republican numbers were 32% for US-PRES in '16 and only between 31-33% for (TX-SEN and CD-23) in '18....
Now let's look at the swings for selected races:
()
Quite a bit to digest with all of this, but again looking at the Bexar County CD-23 numbers, it's starting to look increasingly clear that at least in the 2018 US-SEN and CD-23 elections, Democrats performed quite well in a variety of different parts of the County.
Title: Re: NOVA GREEN's Election Analysis Thread
Post by: NOVA Green on December 31, 2018, 08:29:33 PM
Now let's take a look at "Far South" San Antonio areas, basically most of the precincts in the district South of the 410 Loop.
It is a heavily Latino and predominately working-class part of the district with a population of roughly 35,000, albeit with a much much lower number of voters.
Here is a Precinct Map with some Census data thrown in:
So for example a 20/75 would indicate that it is 20% Anglo and 75% Latino.
The $ number indicates the Median Household income of the precinct.
Granted it is not 100% precise simply because Census tracts do not always cleanly align with precinct boundaries, and also MHI data isn't always able to be broken down by Census tracts.
()
Now let's take a look at these precincts vote share from 2012 to 2018 for US-REP CD-23 within the Bexar County portion of the district.
2012: 5.9%
2014: 5.4%
2016: 6.0%
2018: 6.0%
The vote share within these precincts has been remarkably consistent with the exception of the 2014 US-House race, which suggests that population growth / new voter registration is holding steady with the CD-23 portions of Bexar County at large.
Now let's look at the raw votes in these precincts between 2012 and 2018 for Federal Elections:
()
So, lot's to observe here... let's start with the Total Vote.
1.) The Total Vote appears remarkably low considering the number of people living within these precincts. Granted, likely over 30% of the Population is under the age of 18, roughly based upon the San Antonio South Bexar "neighborhood" Census data available. Roughly 75% of the population under the age of 18 are Latino, and these numbers drop to roughly 66% for the 18-44 age cohort, down to 57% for the 45-54, and 51% for the 55-74 group.
2.) These numbers would suggest that the Anglo proportion of voters is significantly higher than the Demographic data would indicate if we were to simply look at the overall Latino % of the population by precinct.
3.) If we look at the Total Votes between 2012 and 2018, we have roughly 1.5k more voters here in 2018 than in 2012.
One of the obvious questions would be how much of this increase in voters came from innate population growth of younger Latino voters coming of voting age, how much came from people moving into the area, where at least looking at the map, there's some pretty decent room for population growth, and easy access to freeways.
The 2018 US-SEN numbers were only (150) votes fewer than the 2016-US-PRES numbers, which would suggest either a significant increase in population between '16 > '18 and/or unusually high voter turnout numbers in a Midterm.
4.) The increase in Total Votes worked significantly to Democratic advantage in 2018, with Dems taking a record raw vote margin for US-SEN of 1,074 votes, with exceed Pete Gallego (D) margins of 1,036 in 2012.
Ortiz-Jones managed to squeeze a 790 vote margin out of these precincts in 2018, adding 352 votes to the DEM margins here in 2016, which exceeded HRCs 728 vote margin for US-PRES.
5.) That being said, Republicans also hit record raw vote numbers in these precincts in 2016 (~2.9k Votes) and 2018 (2.75k Votes), which suggests opportunities for Republicans in low election turnout years.
Now let's look at the % of Support for DEM and PUB Federal Candidates between 2012 and 2018.
()
Interesting:
1.) For an overwhelmingly Latino part of Bexar County, these are not impressive Democratic margins...
Democrats will typically take 53-55% of the vote, versus Republicans 42-43% in most elections.
2.) The outliers where DEMs performed better was 2018-SEN (57.5%) a record, and 2012-REP (56.2%).
The outlier where PUBs performed better was 2012-PRES (43.5% Romney).
3.) The DEM % Margins typically float in the 10-12% range, with 2012-House standing out, partially as a result of strong 3rd Party voting ( + 19.4% DEM), and 2018-SEN ( + 16.1% DEM), and on the flip side 2016-HOUSE ( + 6.6% DEM), with a high amount of 3rd Party Voting.
To what extent are these disappointing Democratic % numbers a result of low voter registration among a heavily Working-Class Mexican American population?
92% of the Population are US Citizens, and as I mentioned previously ~ 30% of the population is under voting age (75% Latino), but still it's pretty clear there are a large number of eligible voters that are not registered to vote.
Now to examine this a bit further, I thought it might be interesting to look again at the precinct map by Demographics to see what voter turnout numbers looked like 2018 and decrease of voter turnout between 2016 and 2018, to see if there appeared to be a significant drop-off of working-class Latinos between these two elections.
I skipped some of the extremely small precincts, with relatively small numbers of voters, but this should at least help convey the results.
()
What if anything does this tell us?
1.) Voter Turnout was highest in the relatively Middle-Class precincts of 4073 and 1089.
2.) It was also high in precinct 1123, where MHI data is difficult to obtain because of how it is split over multiple Census Tracts....
3.) Voter Turnout appears to have dropped the lowest between 2016 and 2018 in the most heavily Latino Precincts and Working-Class 1056 and 1124
4.) Voter Turnout appears to have dropped the most between '16 and '18 in Precincts with the highest % of Anglos. (Precincts 4073, 1058, and 1063).
Although we don't know which voters in these precincts didn't show up between '16 and '18, we do have some Precinct Election Results available:
1.) Precinct 4073 (42% Anglo, 55 % Latino, MHI $ 63.9k /YR)
2012 PRES--- (42.8% Obama--- 54.9 % Romney) + 12.1% REP
2016 PRES--- (47.2% HRC--- 47.2% Trump) + 0 % ( +12.1% DEM SWINGS '12 > '16)
2016 CD-23--- (40.8% DEM- 50.4% REP) + 9.6% REP
2018 TX-SEN-- (47.7% DEM- 50.8% REP) +3.1% REP (+3.1 REP SWINGS PRES '16)
2018 CD-23--- (44.7% DEM- 51.3% REP) +6.6% REP (+3.0% DEM SWINGS '16 > '18)
So it looks like drop-off in Turnout here likely impacted BETO and ORTIZ-JONES more than the PUBs.
2.) Precinct 1089 (17% Anglo, 77% Latino, MHI $ 74.9k/Yr)
2012 PRES: (54.9% DEM- 43.2% PUB) +11.7% DEM
2016 PRES: (51.6% DEM- 42.7% PUB) + 8.9% DEM (+2.8% PUB SWINGS '12 > '16)
2016 CD-23: (45.9% DEM- 45.9% PUB) + 0 %
2018 TX-SEN: (59.0% DEM- 40.6% PUB) +18.4% DEM (+9.5% DEM SWINGS '16 > '18)
2018 CD-23: (54.5% DEM- 42.0% PUB) +12.5% DEM (+12.5% DEM SWINGS '16>'18)
3.) Precinct 1056 (13% Anglo, 81% Latino, MHI $ 45.2k/Yr)
2012 PRES: (69.4% DEM- 29.0% PUB) +40.4% DEM
2016 PRES: (63.6% DEM- 31.6% PUB) + 32.0% DEM (+8.4% PUB SWINGS '12 > '16)
2016 CD-23: (60.0% DEM- 32.7% PUB) + 27.3% DEM
2018 TX-SEN: (67.6% DEM- 30.6% PUB) +37.0% DEM (+5.0% DEM SWINGS '16 > '18)
2018 CD-23: (64.5% DEM- 32.2% PUB) +32.3% DEM (+5.0% DEM SWINGS '16>'18)
4.) Precinct 1124 (8% Anglo, 83% Latino, MHI $ 45.2k/Yr
2012 PRES: (65.9% DEM- 32.4% PUB) +33.5% DEM
2016 PRES: (61.2% DEM- 33.9% PUB) + 27.3% DEM (+6.2% PUB SWINGS '12 > '16)
2016 CD-23: (57.4% DEM- 32.8% PUB) + 24.6% DEM
2018 TX-SEN: (65.0% DEM- 33.3% PUB) +31.7% DEM (+4.4% DEM SWINGS '16 > '18)
2018 CD-23: (62.8% DEM- 34.1% PUB) +28.7% DEM (+4.1% DEM SWINGS '16>'18)
So, I can keep rolling through the numbers, but appears that in many of the heavily Latino precincts in this part of Bexar, there was actually a swing towards Trump between 2012 and 2016 at the Presidential Level.
As I posted elsewhere quite a few years back, I suspect that part of the reason was there was a backlash against Obama (and by association against HRC in '16) because of the mass deportation policies that most directly impacted Working-Class Mexican-American populations.
What appears initially to be the case is that BETO was able to regain many of those Obama '12 Voters that sat out or voted 3rd Party for PRES in '16, as well as making inroads into Anglo Middle and Upper-Middle Class Texans.
What also appears to be the case, is that Ortiz-Jones was able to add enough support from Working-Class Latinos in Metro Bexar County, to be able to eat away at Will Hurd's margins, despite his relative popularity among the Community, likely caused by distancing himself from some of the more unpopular policies of Trump....
I could roll through the rest of the precincts, but for now I think we're starting to see a clearer picture of what happened in Bexar County within CD-23 precincts, especially with only focusing on Federal Level Elections....
Title: Re: NOVA GREEN's Election Analysis Thread
Post by: NOVA Green on January 02, 2019, 07:35:15 PM
Now to wrap up the remainder of Bexar County CD-23 precinct data, it's a bit of a smorgasbord, but still accounts for 16.5% of the CD-23 House Vote in 2018 within Bexar County.
It basically includes some fast growing heavily Anglo Upper Middle-Class Precincts in the NW, and some more heavily Latino and more Middle-Class precincts to the West and SW of San Antonio.
Let's look at the raw votes of these precincts.
()
So, several observations:
1.) The Total Vote has been increasing dramatically since '12 / '14, and the '18 numbers even surpassed '16 GE numbers.
There were +1.5k more votes in the 2018 TX-SEN race than there were in the 2016 PRES race, and (800) more votes for TX-CD-23 than in 2016.
2.) The Democratic candidate for TX-SEN received 2k more votes than HRC, and the candidate for CD-23 (500) more votes than HRC.
3.) The DEM candidate for CD-23 in '18 received 1.5k more votes, than the DEM in '16, while Hurd lost (40) votes.
4.) BETO actually won these precincts by (200) votes, contrasted against 1.2k DEM losses in the '12 CD-23, '16 PRES, and '18 CD-23 races, and ~ 2k DEM losses for '12 TX-SEN and '12 PRES, and 2.9k for '16 CD-23 REP.
Now let's look at this same data from a % of support for Federal Candidates 2012 to 2018:
()
So, what stands out here?
1.) We see Democratic support stuck at barely 40% in '12/'14 and even below that for CD-23 races in '14 and '16.
2.) We see Republican support ranging from 55-60% in 2012/2014, and even 2016 for CD-23. The only exception was 2012.
3.) Something changed at the 2016 PRES race, where the Republican Candidate only captured 50.6% of the Vote, and HRC garnered a record 43.6%.
4.) As mentioned before BETO actually won by 1% in the 2018 TX-SEN race, and Ortiz-Jones captured a record 45.2% for Rep from CD-23.
5.) If we look at this from the margins perspective, PUBs only won the '16 PRES and '18 CD-23 vote here by 7%, where typically they could bag 17% margins in a Presidential Election Year (2012) and the CD-23 election in (2016).
Let's look at a few selection margin swings to see how this worked out:
()
1.) Almost +10% DEM swings CD-23 REP 2016 to 2018.
2.) About +17-18% DEM swings TX-SEN '18 vs 2012 PRES and 2012 TX-SEN
3.) About +8% DEM swings TX SEN '18 vs '16 PRES
4.) Slight PUB swings CD-23 '18 vs '16 PRES
So, if these numbers look familiar they should, since it tends to mirror those in more Upper-Middle Class Anglo, and more Middle-Class suburban parts of Bexar County over the past 6 Years.
Now, the key question is since we have a fairly decent chunk of the Bexar County vote share here, can we narrow it down a bit more?
So, I'll roll through a few of the different areas and we'll do a quick peak of what's going on...
Let's start with a few of the NW Bexar County precincts not previously covered:
1.) Far NW (Precincts 3012 and 3126)
Here is a Census Tract map of the Anglo % of the population in these two precincts....
The non-shaded (White colored) areas on the map are likely nature preserves, or privately owned ranches up in the hill country part of NW S.A.
Best guess is these precincts are roughly 62% Anglo and 33% Latino, but much of the Latino population is under the age of 30, so Anglos represent a much higher share of the voting population.
MHI is $ 118k /Yr....
2012 PRES: (918) Total Votes (24.7% DEM)--- (73.9% PUB) + 49.2% PUB
2012 CD-23: (26.6% DEM)--- (69.2% PUB) + 42.6% PUB
2016 PRES: (1487 Total Votes) (33.3% DEM)--- (61.1% PUB) + 27.8% PUB (+21.4% DEM SWING)
2016 CD-23: (27.2% DEM)--- (68.0% PUB) + 40.8% PUB
2018 TX-SEN (1696 Votes) (39.0% DEM)--- (60.7% PUB) + 21.7% PUB
2018 CD-23: (33.9% DEM)--- (65.2% PUB) + 31.3% PUB
Now let's take a brief look at some additional precincts in NW and Far Western Bexar County in CD-23:
()
These account for roughly 8.7% of the Bexar County portion of CD-23.
The Northern precincts are heavily Anglo Upper Middle-Class (53-38) with an MHI of $119k/Yr (At least the Census Block Group obviously overlapping with these precincts).
()
The Southern precincts still have a decent Anglo population, but are plurality Latino with a relatively large Black Population (9.2%), compared to many other parts of Metro San Antonio.
The MHI is $95.5k / Yr making this a solidly Upper Middle-Class part of Metro S.A.
()
Since, I'm trying to wrap up the Bexar County portion of CD-23, I'm not going to go as far into the Weeds and Seeds as I normally do, but instead consolidate the numbers from North and South Far West precincts....
Here are the raw votes from Far West Bexar:
()
So we see +3.3k votes added between the '12 and '16 Presidential election, and an additional (800) votes between the '18 TX-SEN and '16 PRES elections.... (Obviously a pretty fast growing part of Bexar).
DEM's flip the raw vote from + 900 Trump to + 35 BETO...
DEM's shave 1.1k vote margins off Hurd between '16 and '18 for CD-23.
Now let's look at the raw percentages....
()
We see a +24% Romney '12 area go to +10% for PRES in '16 and +22% for CD-23 turn around.
There was roughly a 10.4% swing towards BETO compared to HRC in '16, and +14.1% DEM swing from '16 to '18 for CD-23....
Apologies for the brief synopsis here, but would like to wrap up Bexar and then jump over to El Paso and maybe a few of the Rio Grande Counties, since there are other projects on the horizon... :)
Title: Re: NOVA GREEN's Election Analysis Thread
Post by: NOVA Green on January 14, 2019, 10:39:08 PM
I'm going to cross-post this from my 2018 General Election Precinct Level Results Posted by Government Sites thread, mainly because there are some folks that follow some of my posts on Atlas that aren't regular Forum users, or in many cases not even members of the Forum...
Here's a link to the thread for those of y'all out there to look at links to my State Posts with links to County Election Offices if you want to go grab data from some of those States with a more decentralized "County Level" precinct reporting mechanism....
https://uselectionatlas.org/FORUM/index.php?topic=307483.msg6626000#msg6626000
I'll be periodically replacing this post as new Precinct level sources emerges....
2018 GE Precinct Results Posted by State and County Websites--- 1/14/19 Update:
Updated to include the following:
1.) Vermont now added for comprehensive Precinct Results from a Single Statewide Election Agency
(See below for list of States with a Centralized State Reporting Location). (14/14 Counties Reporting).
2.) Updated National Map for States, where I have official Precinct results from County offices, but not currently posted on County Websites. This includes (4) Counties in Oregon and (9) in Utah. PM me if interested in these precinct results....
3.) Updated California post to include Kings County (54/58 Counties Reporting).
4.) Updated Utah post and state numbers to include Morgan and Wayne Counties (29/29 Reporting--- (20 Officially on County Websites and 9 via alternative reliable sourcing).
5.) Updated Kansas to include Leavenworth County (41/105 Counties Reporting Precincts).
YES--- another decent sized Pop center and fairly Middle Class KC 'Burbs (!!!)
6.) Updated Michigan Post to include Missaukee County links... (77/83 Counties Reporting Precincts).
7.) Updated Kentucky Post to include Wayne County available via State Election Reporting Site (107/120 Counties Reporting Precincts).
8.) Updated Indiana post to include Tipton, Fountain, and Vanderburgh County links (55/92 Counties reporting precinct results).
Vanderburgh was a nice score as a County of 182,000 folks and critical battleground in the 2018 IN-SEN race (!!!)
9.) Updated Florida post to include Sumter and St Lucie County links. (65/67 Counties Reporting Precincts).
St. Lucie was a nice score as a County of 280,000, but I could only get it to work in Internet Explorer....
10.) Updated Pennsylvania post to include Armstrong and Juniata County Links (61/67 Counties Reporting Precincts).
My major issue with PA at this point is Delaware County (Pop 562,000). You can get results by Township and Municipality, but not by Ward / Borough which is going to be the closest thing to a "precinct" in PA....
11.) I did not go through County by County for Kansas, Texas, and Missouri yet to see if there are updates not already available on my State posts that link to County Election precinct data.
Here is the current state of the Map:
These are the Color Conventions Used (Although I'm testing out a different Map using 3-D Paint)
DARK GRAY = States where Precinct level Results are available from one Statewide Reporting Agency
DARK BLUE= States where Precinct level Results will likely be fully or partially available from a Statewide Reporting Agency.
CYAN / SKY BLUE = States without Precinct level results available from a Statewide Reporting Agency, so we have to turn to the Counties for relief.
LAVENDER = States where we have no precinct level results from State or County Reporting agencies, nor should we expect that to be the case.
NUMBERS by STATE= Number of Counties with precinct results available on either State or County links posted below or in independent posts on this thread.
()
Links to State Centralized Election Reporting Surfaces for Precinct Results:
Alabama:
https://www.sos.alabama.gov/alabama-votes/voter/election-data
*** This one is SWEET and truly representative of Southern Hospitality.... simply click on the "Download Link" to the right by the election you want, and then you get a Zip file, which you then extract. Now you have a folder in Excel for each individual county, where you can open and view the precinct results.... ***
Alaska:
http://www.elections.alaska.gov/results/18GENR/
http://www.elections.alaska.gov/results/18GENR/data/resultsbyprecinct.txt
*** Need to scroll down to the bottom Statement of Votes Cast and pull precinct data by State district individually into a PDF format ****
*** Updated 11_25_18 to include link to Text based download as per Cynics comment.. :
"Alaska finally does have Excel-readable precinct data. You need to go to your link, RIGHT click on "Text by Precinct", and select save."
Arizona:
https://azsos.gov/precinct-level-results-county-2018-general-election
Arkansas:
https://results.enr.clarityelections.com/AR/92174/Web02-state.216038/#/access-to-races
*** See Arkansas Post on how to pull up precinct level results ***
Colorado:
https://results.enr.clarityelections.com/CO/91808/Web02-state.222648/#/rpt
Delaware:
https://elections.delaware.gov/archive/elect18/elect18_general/html/index.shtml
Georgia:
https://results.enr.clarityelections.com/GA/91639/Web02-state.221451/#/access-to-races
*** Need to Download County by County ****
Hawaii:
https://elections.hawaii.gov/wp-content/results/precinct.pdf
Idaho:
https://sos.idaho.gov/elect/results/index.html
Illinois:
https://www.elections.il.gov/ElectionResults.aspx?ID=jwAfLjnmELI%3d
Iowa:
https://sos.iowa.gov/elections/results/precinctvotetotals2018general.html
***Select your County and download into Excel.... it's a bit annoying to have to do this County by County, but I'll take it ***
Kentucky:
https://results.enr.clarityelections.com/KY/91996/220209/Web01/en/summary.html
*** See Kentucky Post on how to pull up precinct results.... ***
Louisiana:
https://voterportal.sos.la.gov/Graphical
*** Then select election date, then select your election type, then click on Parish, and then precinct results (Any questions go up-thread and see my screenshots for LA on the Louisiana Post) ***
Maryland:
https://elections.maryland.gov/elections/2018/election_data/index.html
*** This is a comprehensive result so ignore the name when you click on the GOV Election by Precinct... will add a post regarding how to d/l the data if there are any questions ***
Massachusetts:
http://electionstats.state.ma.us/
*** See my MASS post for detailed instructions on how to pull up precinct data ***
Minnesota:
[/b]
https://electionresults.sos.state.mn.us/Select/Download/115
Mississippi:
http://www.sos.ms.gov/Elections-Voting/Pages/2018-General-Election.aspx
*** Click on the Official County Recapitulation Sheet you are looking for ***
Montana:
http://mtelectionresults.gov/
*** Updated 2018 Precinct Level Results--- Select FED/STATE/Etc and then scroll over the right and then select the Export button, and then select "By Precinct".
Nebraska:
https://electionresults.sos.ne.gov/resultsCTY.aspx?type=SW&rid=8862&osn=102&map=CTY
*** Click on the export precinct results to Excel for your selected Contest, and it will generate a really nice spreadsheet with tabs for each County in the State (Awesome!) ***
Nevada:
https://www.nvsos.gov/sos/elections/election-information/precinct-level-results
*** Click on the now activated buttons to the top right "2018 GE... under the Statewide--- General Excel.zip or csv.zip ***
New Hampshire:
http://sos.nh.gov/18GenResults.aspx
*** Credit to Nyvin ***
New Mexico:
http://electionresults.sos.state.nm.us/resultsCTY.aspx?type=FED&rid=4898&osn=180&map=CTY
North Carolina:
https://er.ncsbe.gov/index.html?election_dt=11/06/2018&county_id=9&office=ALL&contest=0
*** THANKS Sorenroy for sharing this on another thread regarding the 2018 NC-09 potential Republican voter fraud.... Wink ***
North Dakota:
https://results.sos.nd.gov/ResultsSW.aspx?text=All&type=SW&map=CTY
*** per cinyc... "(Click on Export --> Precinct for each race) ****
Ohio:
https://www.sos.state.oh.us/elections/election-results-and-data/2018-official-elections-results/
*** Thanks Trajan for letting us know this is publish and providing the 2018 link ***
Oklahoma:
https://www.ok.gov/elections/Election_Info/2018_November_General_Election.html
Rhode Island:
https://www.ri.gov/election/results/2018/general_election/west_warwick/3801/
*** See my detailed post on how to locate RI precinct Results ***
South Carolina:
https://www.enr-scvotes.org/SC/92124/Web02-state.222648/#/cid/21500/c/Sumter
*** This one's virtually useless for the sake of exporting data, but you can pull up individual counties by race and see a map and raw precinct votes ***
South Dakota:
Updated to include Cinyc links...
http://electionresults.sd.gov/resultsSW.aspx?type=SWR&map=CTY (Statewide row races)
http://electionresults.sd.gov/resultsSW.aspx?type=BQ&map=CTY (Statewide Ballot Intiatives)
http://electionresults.sd.gov/ResultsExport.aspx? (By-county exports of all races in the county by precinct)
Tennessee:
https://sos-tn-gov-files.tnsosfiles.com/Nov%202018%20General%20by%20Precinct.pdf
Vermont:
https://vtelectionresults.sec.state.vt.us/Index.html#/federal
*** basically it looks like you click on Contest Details and can export to Excel by race and see for example how the two precincts in Bennington Vermont voted for US-SEN in 2018 ***
Virginia:
https://apps.elections.virginia.gov/SBE_CSV/ELECTIONS/ELECTIONRESULTS/
Washington:
(This link includes precinct detail for every County in Washington State, excepting King County on one giant spreadsheet)
http://results.vote.wa.gov/results/current/Export.html
Now, wait we're missing the most populous county? Simple solution, go to the King County election site and grab your precinct data from here:
https://kingcounty.gov/depts/elections/results/2018/201811.aspx
*** Scroll down to the bottom to the "Final Precinct Level Election Results" and click on the comma delimited file, and next thing you know you'll have a file you can easily convert in Excel and do all the great stuff Excel can do to help sort and organize your data ***
West Virginia:
https://results.enr.clarityelections.com/WV/92360/Web02-state.222648/#/access-to-races
*** ENR Engine... Scroll Down and click on County name, head over to right and download results for all races in the County by preferred file format (Including Excel--- YES!!!!). I could post some screens caps here, but most of y'all should be somewhat familiar by this now, if you've spent much time looking up precinct results and followed previous instructions from other State / County Precinct Reporting agencies ***
Wisconsin:
https://elections.wi.gov/elections-voting/results
*** NOTE- Scroll Down to the Bottom and select the "Ward by Ward" Excel Spreadsheet for either US-SEN, US-HOUSE, State Sen, or GEN ASSEMBLY---- Thanks Gass for the source! ***
Wyoming:
https://soswy.state.wy.us/Elections/Docs/2018/2018GeneralResults.aspx
*** Have to download precinct results individually by County ***
There are a few States where in theory we will see Centralized Election Precinct Reporting at some point.... I'll believe it when I see, and will keep checking, but I don't like waiting for my precinct data when I'm researching a project....
Florida:
https://dos.myflorida.com/elections/data-statistics/elections-data/precinct-level-election-results/
*** Tick Tock, Still waiting for FL, go to my Florida Post for links to County Level Precinct Results. NOTE: I cannot guarantee these links include recount numbers ****
Kansas:
http://www.kssos.org/elections/elections_statistics.html
*** This one is weird--- it appears that they only post precinct data for non Presidential Year elections??? (Precinct Data for 2010 and 2014 for example). Still check out my Kansas Post for detailed links to County Level Official Precinct Results ***
Michigan:
https://miboecfr.nictusa.com/cgi-bin/cfr/precinct_srch.cgi
*** Go to my Michigan Post for links to County available precinct results ***
Oregon:
https://sos.oregon.gov/elections/Pages/electionhistory.aspx
*** Go the Right-hand Site and pull a Zip fill by precinct, but at this point only includes 2017 and 2018 Primary date... Go to my Oregon Post for links to County Level Election Results ***
I'll be going through and doing some housekeeping so don't be surprised if some of my posts disappear, I just don't want to lose any critical data, especially stuff like updates which helps give a timeline of how quickly we can expect to see results posted....
Title: Re: NOVA GREEN's Election Analysis Thread
Post by: NOVA Green on January 21, 2019, 05:27:59 PM
I was wondering if anyone knows more about the voting pattern in Louisiana especially around urban / suburban areas. I don't know Louisiana at all, but for an area that has a fairly significant city (New Orleans) I am surprised there was no discussion of any swing towards Hillary in 2016 or possible shifts in congressional seats. Are there any of the high-education / high-income suburbs that swung towards Democrats in 2016 or 2018 in Louisiana?
I only ask because it seems that there was discussion about the Little Rock-based seat in Arkansas moving towards Democrats, in Mississippi Espy had a relatively close election thanks in part to swings in the Jackson area, and obviously Georgia, Texas, and even Oklahoma had some pretty impressive results for Democrats.
So what's up in Louisiana? Can someone with more knowledge explain in more detail what happened in 2016 there? And what are the best pathways forward for Democrats? Also what was John Bel Edwards's path to victory and hopefully to re-election?
I thought this might be interesting to take a peek at and look at some precinct level results for the 2012 and 2016 Presidential Elections in Upper-Income parts of Louisiana....
Haven't made it to New Orleans yet, but pulled the data for the three wealthiest places in Metro Baton Rouge....
Now, the caveat here is that Louisiana does not break down early voting by precinct for a given Parish, so there is always a chance that data could be distorted if there were shifts in early voting patterns in these communities.
Wealthiest Places in Metro Baton Rouge:
1.) Prairieville---- MHI- $ 95.8k/ Yr (Ascension Parish)--- Pop 29.7k
47% of 25+ > 4 Year Degree, 46% HS Degree. 78% Anglo, 10% Black, 5% Latino
2012: 2,643 Obama (18.7%) , 11,272 Romney (79.5%) +60.8% R
2016: 2,756 HRC (18.8%), 11,228 Trump (76.7%) +57.9% R
+2.9% D Swing 2012 > 2016
2.) Westminster--- MHI $ 91.3k/Yr (East Baton Rouge Parish)--- Pop 3.1k
68% of 25+ > 4 Year Degree, 32% HS Degree. 73% Anglo, 12% Black, 11% Asian,
2012: 347 Obama (22.1%), 1,186 Romney (75.4%) +53.3% R
2016: 383 HRC (27.8%), 872 Trump (63.2%) +35.4% R
+ 17.9% D Swing 2012 > 2016
3.) Shenandoah--- MHI $ 86.5k /Yr (East Baton Rouge Parish)--- Pop 20.0k
53% of 25+ > 4 Yr Degree, 43% HS Degree. 73% Ango, 13% Black, 5% Asian, 4% Latino
*** Calculating the exact precincts are trickier because of the GiS mapping app, but I'm including precincts 3-3 A/B, 3-15 A/B, 3-38 A/B, 3-41 A/B, 3-43 A/B, 3-53 A/B ***
2012: 1,213 Obama (19.0%), 5,059 Romney (79.3%) + 60.3% R
2016: 1,403 HRC (23.5%), 4,201 Trump (70.5%) +47.0% R
+ 13.3% D Swing
So what does all of this tell us?
1.) There was minimal shifts in the fast growing exurban Baton Rouge Community of Prairieville between 2012 and 2016. HRC did not gain any increase in % over Obama 2012, and the marginal shifts in Republican vote margins were a result of voters shifting to 3rd Party Candidates.
Although the Democrats gained an additional 113 Votes between '12/'16 and the 'Pubs lost 44 Votes, the overall election day voter pool expanded by 463 Votes.
2.) There was a significant swing in the relatively small and highly educated community of Westminster between '12 and '16, although a good chunk of this came from a relatively high 3rd Party Voting % for an educated and affluent community (9.0% Others)...
Overall in addition to 3rd Party Candidates total election day votes dropped between '12 and '16, which in addition to the 3rd Party Votes accounted for a significant chunk of the '12 > '16 margin swing.
In terms of occupations there is an extremely high % of workers within Westminster in occupations such as Management / Business / Computers,Science & Math / Engineering.
3.) Shenandoah is a cross between Westminster & Prairieville in terms of Ethnic Demographics and Educational attainment, but did experience visible swings between '12 and '16 election day support for the Democratic Presidential candidate.
It does have a significantly higher % of the population working in the Manufacturing Industry (11.9%) and lower % in "Professional" Occupations.
There was a +200 increase in Dem votes between '12 and '16 and a drop of 800 'Pub votes in that same time range. Total election day votes dropped 420 between that time....
4.) So here's where it gets tricky.... without knowing EV /ED combined votes by precinct we don't really know the exact swings in these places.
Shenandoah and Prairieville both have significantly larger Black Populations than many other educated, suburban/exurban Metro areas in parts of the Country outside of the South, so to what extent if any were there variations in EV/ED votes by Ethnicity, since it appears odd that total votes would decrease between '12 and '16 in highly educated upper middle-class communities....
5.) Metro Baton Rouge is interesting, and was the key example of one of the breakdowns Chinni and Gimpel made in their book "Our Patchwork Nation", which they used to dissect the results of the 2008 Presidential Election, as representative of the category they called "Minority Central".
https://www.csmonitor.com/Books/Book-Reviews/2010/1027/Our-Patchwork-Nation
http://www.patchworknation.org/Minority-Central
6.) Obviously any extensive dissection of the 2016 Presidential Election results in Louisiana, should also look at the return of the "Katrina Refugees", including LA residents from a wide variety of backgrounds, and between '12 and '16 there was a huge number of these residents returning, especially from places like Metro Houson, DFW, etc....
Anyways--- hopefully this adds to a starting discussion to swings among Educated / Upper Middle-Class voters in Louisiana between the 2012 and 2016 Presidential Elections....
Title: Re: NOVA GREEN's Election Analysis Thread
Post by: NOVA Green on October 15, 2020, 05:58:43 AM
I wonder if Montgomery County could see some pretty large swings to Biden this year. My county (Forsyth) in GA seems pretty similar (outer suburban, large planned communities similar to the Woodlands) and has a large contingent of Trump'16 voters defecting to Biden this year.
LOL, one of the counties showing no bump is one of the Republican bastions of the state. They'd better hope the voters show up on Election Day now that the rest of Texas is becoming a functioning democracy for the first time.
MONTGOMERY COUNTY (Houston suburbs)
2012: 15,021 5.7%
2016: 20,432 6.6%
2018: 20,158 6.0%
2020: 20,874 5.7%
2012: 15,021 5.7%
2016: 20,432 6.6%
2018: 20,158 6.0%
2020: 20,874 5.7%
LOL, one of the counties showing no bump is one of the Republican bastions of the state. They'd better hope the voters show up on Election Day now that the rest of Texas is becoming a functioning democracy for the first time.
Hi Forsythvoter--- and belated welcome to the Forum!
Not totally in a position to do a complete compare / contrast analysis between both Counties as part of a Senior Project or Grad School Paper.
Still, having lived in NW Harris County for 4-5 Years, places like Magnolia, TX was just right down the road, drop over to Spring (No Prob), The Woodlands fun place to always visit with co-workers and friends that lived all around the area way back roughly from '12> '15, this naturally attracted my attention, and might at least be able to speak a bit on your original question.
Naturally, in order to more properly examine an extremely fast-growing place such as Montgomery County (9th fastest growing in TX by POP and/or % Increase), we must first examine where the voters reside.
The Woodlands gets a lot of sex appeal, as perhaps it is the most well known Community within Montgomery County, because of it's location along I-45, a major Music Venue, where me and my wife saw Black Sabbath reunited back in the early / Mid 2010s, awesome place where "The Villages" was essentially part of a decentralized structure of Municipal Government, and honestly had we been planning in staying in Texas for longer, while well have forked over the $$$ to buy a condo or rent an apartment and deal with the long commutes down the SH's.
Still only one joint in a sprawling county with about 600k residents... almost large enough to get it's own CD if you follow Oregon style districting laws...
Let's just briefly attempt to break down the vote by vote share by place looking at the 2016 GE PRES results and raw votes.
()
Now let's look at it from a % by Place Scenario:
()
These numbers are potentially devastating for DEMs in one the fastest growing counties in Texas...
PUB's grabbing a +100k Raw Vote Margin, not gonna be good, especially if low turnout elsewhere within Metro H-Town / Space City...
Still, maybe we have some good numbers from 2018 to help us continue our rush caused by the '18 GE-TX-SEN numbers?
Here are the Raw Vote Numbers by Place in Montgomery County Texas for US SEN in 2018:
()
Naturally, we also need to look at this in terms of % of the Vote for the 2018 SEN Election:
()
So... maybe potentially some good news for DEMs to cut down PUB margins in Montgomery County significantly, but Cruz holding virtually steady in The Woodlands in '18, and only dropping a few points in the Montgomery County areas around Spring, do not indicate a massive DEM swing here in 2020, unless Biden ends up winning Texas.
Sure the numbers from Magnolia zip codes might suggest some hope for DEMs in 2020 PRES & SEN swings, and help shave a few % off the margins.
Montgomery Area, not sure how many of y'all ever been out there, but +15k Trump>HRC and +15k Cruz>Beto with roughly 68% GE PRES Margins in '16 and +67% PUB Margins in '18, doesn't really look like we will see massive swings, despite COVID and Biden increase support levels among White Catholics and White Evangelicals...
ExtremeRepublican might have some interesting perspectives with compare/contrast, since Montgomery County might perhaps be somewhat similar to Williamson County, TN, which perhaps might even be more portable when it comes to places like Forsyth County, Georgia.