Title: 2020 redistricting with DRA
Post by: cvparty on August 24, 2018, 07:46:14 PM
What is UP Atlas peeps. So the title is pretty self-explanatory, I made data based on 2020 population estimates that you can use in DRA. I made these estimates by applying the 2014-2017 rate of growth in each US county for 2017-2020. Then using Google Sheets, I edited each states csv file from DRA, applying each countys estimated 2010-2020 growth uniformly for all vote districts within each county.*
Notes (important!)
Directions!
My take on 2020 districts :3
Using 2016 PVI, there are
mein districts
()
Trend (change from 2008 lean to 2016 PVI)
(California data wasn't available on DRA, but most districts there trended D)
()
Notes (important!)
- My growth model is pretty simplistic
- Growth was applied uniformly across every county, so districts drawn in very populous counties (Maricopa, Harris, etc.) will be less precise. BUT no growth differences in the country are drastic enough such that the districts will be hugely off
- *The only states where I did estimates by town/municipality are NH, MA, CT, and NJ. The vote districts in these states are actually named by their respective towns, so it was easy to apply town-level estimates.
- I didn't touch the race population data at all, sorry I didn't feel like doing it. The 2010 data is still there though, so you can still use the race view for drawing minority districts and whatnot
- I used spreadsheet formulas to calculate all these estimates so there could be some errors. If you find any populations that seem off, pls let me know and I'll look into it!!
- States without 2020 estimates are AK, WY, ND, SD, VT, and RI, since all are projected to have only one at-large district.
- I only did 2020 estimates for each states main data set, so dont use any weird data sets like special voting districts or whatever.
Directions!
- First, find the folder named DavesRedistrictingFiles on your computer where all the current 2010 data is saved. If youve never loaded state(s) in DRA before, there will obviously be nothing there, so you need to have loaded all the states you want so that the data is loaded and saved onto your computer.
*You can either use the search function or manually go through the file path. The file path for DavesRedistrictingFiles on my computer (Windows 10) is C:\Users\me\AppData\LocalLow\Microsoft\Silverlight\is\pek0eaig.kln\2gsheg05.vod\1\s\mbcuc5y11hatden4rfah5rjgwlpl3hes2ogfqs2jqmkdx103loaaadaa\f\DavesRedistrictingFiles
*AppData is a hidden folder, so make sure you have viewing hidden files enabled. - Mark this folder in your favorites so you can quickly access it every time you go back and forth.
- Download the data: I uploaded the 2020 data files, as well as drf template files for yall to use as a starting point here in Google Drive (https://drive.google.com/drive/folders/1EjrMR9n19jFjx9Flay01TwEEcAGPA0_9?usp=sharing) (its SAFE I promise there is nothing shady lol. also I didnt do a template for California cuz the state kept crashing every 5 minutes and I couldnt save a whole actual file. TXs and ILs files got messed up somehow too so I dont have them)
- Copy/cut and paste the data files accordingly into each states folder, replacing the old data file with the same name. Then you should be good to open DRA and start drawing 2020 districts! If you already have files from 2010 redistricting (which most people do), you can actually just open that old file, and itll load those shapes into the 2020 data. (drf files simply save shapes, csv files save voting district data) But you'll obviously need to adjust the 2010 district lines for 2020 population equality. For states where the number of districts will change, like TX or PA, obviously you should just start from scratch (or use my templates).
- If you ever want to go back to using 2010 data for a state, simply delete the whole states folder. The next time you load the state in DRA, your computer will download the original 2010 data again.
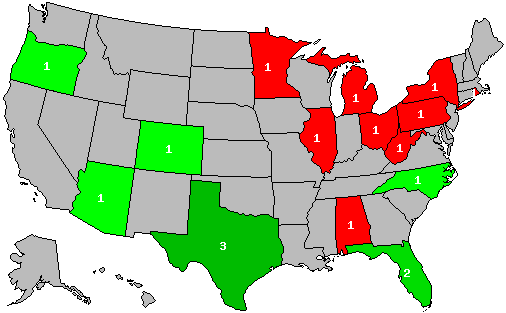
My take on 2020 districts :3
Using 2016 PVI, there are
- 205 D-leaning districts (193 with a >1 PVI)
- 223 R-leaning districts (208 with a >1 PVI)
- 7 even (34 with a <1 PVI)
mein districts
()
Trend (change from 2008 lean to 2016 PVI)
(California data wasn't available on DRA, but most districts there trended D)
()
Title: Re: 2020 redistricting with DRA
Post by: cvparty on August 24, 2018, 07:46:54 PM
Breakdown of (most) states:
Maine: nothing really changes. ME-01 continues to shrink toward the southwest corner of the state.
()
ME-01: Portland area
Obama +23 | Obama +22 | Clinton +12
D+7 | likely D
ME-02: The rest of Maine
Obama +11 | Obama +9 | Trump +7
R+1 | lean R
New Hampshire: NH-01 slightly outpaces NH-02 in growth
()
NH-01: urban
Obama +4 | Romney +1 | Trump +1
R+2 | tossup
NH-02: rural
Obama +15 | Obama +12 | Clinton +1
D+2 | tossup
Massachusetts: The Boston area dominates the states growth in contrast to the west and south
()
MA-01: west
Obama +39 | Obama +41 | Clinton +30
D+17 | solid D
MA-02: central
Obama +12 | Obama +9 | Clinton +6
D+2 | tossup
MA-03: Merrimack Valley
Obama +14 | Obama +10 | Clinton +16
D+5 | likely D
MA-04: south shore/suburbs
Obama +8 | Obama +6 | Clinton +11
D+3 | lean D
MA-05: metrowest
Obama +20 | Obama +16 | Clinton +32 (!)
D+10 | solid D
MA-06: north shore
Obama +24 | Obama +25 | Clinton +28
D+12 | solid D
MA-07: Boston suburbs
Obama +46 | Obama +47 | Clinton +56
D+24 | solid D
MA-08: Boston+Quincy+Randolph
Obama +55 | Obama +59 | Clinton +63
D+29 | solid D
MA-09: south shore
Obama +22 | Obama +18 | 2016: Clinton +12
D+6 | likely D
Connecticut: southwest is basically the only area growing.
()
CT-01: Hartford area
Obama +38 | Obama +35 | Clinton +32
D+15 | solid D
CT-02: east
Obama +19 | Obama +14 | Clinton +3
D+3 | tilt D
CT-03: New Haven/central
Obama +24 | Obama +26 | Clinton +13
D+8 | likely D
CT-04: southwest/Bridgeport
Obama +23 | Obama +15 | Clinton +28
D+9 | solid D
CT-05: northwest
Obama +9 | Obama +3 | Trump +6
R+2 | lean R
New York - loses one district (roughly current NY-22). The City is actually growing at a pretty healthy rate. Its upstate thats rapidly losing representation. Long Island (Nassau+Suffolk) is also stagnant.
()
()
NY-01: eastern Suffolk. R+5 | likely R
NY-02: southern shore. EVEN | tossup
NY-03: northern shore. R+1 | tossup
NY-04: Hempstead. D+10
NY-05: Jamaica. D+38 | solid D *black plurality*
NY-06: Flushing. D+17 | solid D *Asian plurality*
NY-07: Brooklyn Heights. D+41 | solid D *majority-minority*
NY-08: Flatbush. D+44 | solid D *black majority*
NY-09: Sheepshead Bay. D+1 | tossup
NY-10: Lower Manhattan. D+30
NY-11: Staten Island. R+1 | tilt R
NY-12: West Side. D+40 | solid D *majority-minority*
NY-13: Harlem. D+43 | solid D *Hispanic majority*
NY-14: Jackson Heights. D+34 | solid D *Hispanic plurality*
NY-15: Bronx. D+38 | solid D *Hispanic plurality*
NY-16: Yonkers. D+18 | solid D
NY-17: northern NYC suburbs. D+3 | likely D
NY-18: lower Hudson Valley. D+1 | tossup
NY-19: central\Catskills. R+6 | solid R
NY-20: Albany area. D+6 | likely D
NY-21: north. R+3 | likely R
NY-22: Southern Tier\Finger Lakes. R+2 | lean R
NY-23: Syracuse area. D+2 | tossup
NY-24: Rochester. D+7 | solid D
NY-25: Buffalo. D+8 | solid D
NY-26: west NY. R+12 | solid R
New Jersey: The NY area (especially the cities) is basically the only area growing. Also Ocean.
()
NJ-01: Camden/Philly suburbs.
Obama +29 | Obama +31 | Clinton +25
D+12 | solid D
NJ-02: south.
Obama +10 | Obama +10 | Trump +2
D+1 | tossup
NJ-03: central, Delaware Valley.
Obama +28 | Obama +29 | Clinton +28
D+13 | solid D
NJ-04: Jersey shore.
McCain +17 | Romney +19 | Trump +31
R+14 | solid R
NJ-05: NY suburbs.
Obama +10 | Obama +9 | Clinton +15
D+5 | likely D
NJ-06: central Jersey, northern shore.
Obama +3 | Obama +3 | Trump +2
R+1 | tossup
NJ-07: skylands.
McCain +14 | Romney +16 | Trump +18
R+10 | solid R
NJ-08: Newark. *black plurality*
Obama +63 | Obama +72 | Clinton +65
D+33 | solid D
NJ-09: Paterson. *Hispanic plurality*
Obama +30 | Obama +42 | Clinton +34
D+18 | solid D
NJ-10: Elizabeth+Jersey City. *majority-minority*
Obama +46 | Obama +56 | Clinton +50
D+25 | solid D
NJ-11: extremely educated suburbs. swung hard against Trump
Obama +3 | Romney +1 |Clinton +12
D+1 | lean D
NJ-12: central cities. *majority-minority*
Obama +30 | Obama +35 | Clinton +32
D+16 | solid D
Pennsylvania: loses one district (roughly current PA-09). The southeast is basically the only area growing. The rest of the state is generally losing population.
()
PA-01: Bucks. EVEN | tossup
PA-02: Northeast Philly+suburbs. D+15 | solid D
PA-03: North Philly. D+40 | solid D *black plurality*
PA-04: north Montco+Reading. R+1 | tilt R
PA-05: Delaware+South Philly. D+27 | solid D *black plurality*
PA-06: wealthy Philly suburbs. D+2 | lean D
PA-07: Lehigh Valley. R+1 | tossup
PA-08: Scranton+Wilkes-Barre. R+1 | lean R
PA-09: Harrisburg+York. R+6 | likely R
PA-10: Lancaster. R+13 | solid R
PA-11: Williamsport. R+18 | solid R
PA-12: south. R+23 | solid R
PA-13: southwest. R+17 | solid R
PA-14: west. R+15 | solid R
PA-15: Erie. R+9 | solid R
PA-16: Pittsburgh suburbs. R+5 | lean R
PA-17: Pittsburgh. D+12 | solid D
Maryland: The west, east, and Baltimore are lagging in growth. The Washington area leads most of the states growth.
()
MD-01: eastern shore. R+12 | solid R
MD-02: Baltimore suburbs. D+12 | solid D
MD-03: Baltimore suburbs (2). D+5 | likely D
MD-04: Washington suburbs. D+35 | solid D *plurality black*
MD-05: south. D+23 | solid D *majority black*
MD-06: west. R+11 | solid R
MD-07: Baltimore. D+28 | solid D *majority black*
MD-08: Washington suburbs. D+24 | solid D (2)
Virginia: growth is dominated by NOVA and the Richmond area.
()
VA-01: east. R+10 | solid R
VA-02: Virginia Beach. R+1 | tossup
VA-03: Hampton Roads. D+12 | solid D
VA-04: Richmond. D+9 | solid D
VA-05: south. R+6 | likely R
VA-06: Shenandoah Valley. R+17 | solid R
VA-07: Washington exurbs. R+1 | tossup
*I honestly didn't know where else to put Charlottesville, but it actually turned out to fit nicely
VA-08: NOVA. D+20
VA-09: southwest. R+17 | solid R
VA-10: NOVA. D+8 | solid D
VA-11: NOVA. D+13 | solid D
North Carolina: gains a seat (Raleigh-based NC-14). Charlotte and Raleigh areas in particular are growing massively.
()
NC-01: northeast. high black population. D+5 | likely D
NC-02: Raleigh suburbs/exurbs. R+5 | lean R
*very high growth/in-migration here. depending on how the suburbs trend, this could become very competitive*
NC-03: east/north coast. R+11 | solid R
NC-04: Durham. D+14 | solid D
NC-05: northwest. R+19 | solid R
NC-06: triad cities. D+11 | solid D
NC-07: southeast. R+9 | solid R
NC-08: sandhills. D+1 | tossup
NC-09: Charlotte suburbs. R+6 | likely R
NC-10: um, west of Charlotte? R+19 | solid R
NC-11: mountains. R+8 | likely R
NC-12: Charlotte. D+18 | solid D
NC-13: Charlotte/WS suburbs. R+22 | solid R
NC-14: Raleigh. D+10 | solid D
South Carolina: the coast, Greenville, and Charlotte suburbs are growing very quickly.
()
SC-01: Charleston. R+4 | lean R
*could potentially become a tossup
SC-02: Columbia. D+1 | tossup
SC-03: Piedmont. R+19 | solid R
SC-04: Greenville. R+14 | solid R
SC-05: north? R+14 | solid R
SC-06: coastal plain. D+3 | lean D
SC-07: northeast. R+9 | solid R
Georgia: Atlanta continues to skyrocket in population. Most of the rest of the state is stagnant or declining.
()
GA-01: Savannah/coast. R+7 | likely R
GA-02: southwest. D+3 | lean D *plurality black*
GA-03: Atlanta SW?? R+21 | solid R
GA-04: east burbs. D+28 | solid D *majority black*
GA-05: Atlanta. D+33 | solid D *majority black*
GA-06: north burbs. R+2 | lean D?
GA-07: most of Gwinnett
McCain +11 | Romney +11 | Clinton +4
R+3 | tossup (maybe even tilt D)
GA-08: south. R+19 | solid R
GA-09: north exurbs. R+30 | solid R
GA-10: northeast. R+24 | solid R
GA-11: 98% of Cobb.
McCain +9 | Romney +14 | Clinton +4
R+4 | tossup
GA-12: Augusta. R+6 | likely R
GA-13: south burbs. D+5 | likely D
GA-14: northwest. R+27 | solid R
Florida: gains 2 seats | the way I drew the districts, the new 28th and 29th would be based around Ocala and Sarasota. Almost all of the state is growing pretty quickly, but Miami isnt growing very fast compared to the rest of the state. Orlando and the exurbs are growing very quickly.
()
FL-01: west panhandle. R+21 | solid R
FL-02: east panhandle. R+6 | likely R
FL-03: north central. R+12 | solid R
FL-04: Jacksonville suburbs. R+19 | solid R
FL-05: Jacksonville. D+2 | lean D
FL-06: Volusia. R+7 | solid R
FL-07: Orlando suburbs. R+2 | tossup
FL-08: space coast. R+9 | solid R
FL-09: Kissimmee. D+13 | solid D
FL-10: Orlando. D+11 | solid D
FL-11: central coast. R+14 | solid R
FL-12: Tampa suburbs. R+8 | solid R
FL-13: St. Petersburg. D+2 | tilt D
FL-14: Tampa. D+9 | solid D
FL-15: Polk. R+7 | solid R
FL-16: Bradenton/Tampa burbs. R+5 | likely R
FL-17: southwest. R+16 | solid R
FL-18: Port Lucie. R+3 | lean R
FL-19: Cape Coral. R+11 | solid R
FL-20: Fort Lauderdale. D+20 | solid D
FL-21: West Palm Beach. D+10 | solid D
FL-22: Boca Raton. D+7 | likely D
FL-23: Pembroke Pines. D+11 | solid D
FL-24: north Miami. D+27 | solid D
FL-25: Cuban-Americans lol D+1 | tossup
FL-26: south Miami. D+6 | likely D
FL-27: Miami. D+16 | solid D
FL-28: Ocala. R+12 | solid R
FL-29: Sarasota. R+8 | solid R
Ohio: loses 1 district (most of current 15th). Cincinnati is growing somewhat, and Columbus is growing very rapidly. The rest of the state is generally stagnant/declining.
()
OH-01: Cincinnati. D+4 | likely D
OH-02: south. R+17 | solid R
OH-03: Columbus. D+17 | solid D
OH-04: north central. R+16 | solid R
OH-05: west. R+23 | solid R
OH-06: Appalachia. R+13 | solid R
OH-07: east central? R+11 | solid R
OH-08: Cincinnati suburbs. R+18 | solid R
OH-09: Toledo/Erie shore. D+4 | lean D
OH-10: Dayton. R+3 | lean R
OH-11: Cleveland. D+28 | solid D
OH-12: Columbus suburbs. D+1 | lean D
OH-13: Akron. D+3 | tilt D
OH-14: northeast. R+1 | lean R
OH-15: west suburbs. D+1 | tossup
Indiana: little change. Indianapolis in particular is growing quickly.
()
IN-01: northwest. D+7 | likely D
IN-02: north central. R+13 | solid R
IN-03: northeast. R+17 | solid R
IN-04: west. R+16 | solid R
IN-05: Indianapolis suburbs. R+8 | likely R
IN-06: east-central. R+15 | solid R
IN-07: Indianapolis. D+10 | solid D
IN-08: south. R+13 | solid R
IN-09: southeast. R+17 | solid R
Michigan: loses 1 district (most of current 14th). Grand Rapids is growing considerably. Some Detroit suburbs are growing, kind of
()
MI-01: north. R+10 | solid R
MI-02: Grand Rapids. R+7 | likely R
MI-03: southwest. R+12 | solid R
MI-04: central. R+7 | solid R
MI-05: Flint. D+4 | lean D
MI-06: south. R+4 | likely R
MI-07: Ann Arbor. D+10 | solid D
MI-08: Lansing/Detroit exurbs. R+3 | lean R
MI-09: Detroit. D+14 | solid D
MI-10: thumb. R+13 | solid R
MI-11: Detroit suburbs. D+1 | tossup
MI-12: Detroit suburbs. D+8 | solid D
MI-13: Detroit. D+33 | solid D
Wisconsin: little change. Madison is growing quickly. Otherwise there isnt very notable growth.
()
WI-01: south. EVEN | tilt R
WI-02: Madison. D+17 | solid D
WI-03: west. D+1 | tossup
WI-04: Milwaukee. D+24 | solid D
WI-05: Milwaukee suburbs. R+16 | solid R
WI-06: east. R+9 | solid R
WI-07: northwest. R+6 | solid R
WI-08: northeast. R+7 | solid R
Minnesota: loses 1 district (most of current 7th). The Twin Cities metro area is growing healthily. The rest of the state not so much.
()
MN-01: south. R+5 | likely R
MN-02: south suburbs. R+1 | tossup
MN-03: west suburbs. D+3 | likely D
MN-04: north suburbs. EVEN | tossup
MN-05: Twin Cities. D+30 | solid D
MN-06: central. R+15 | solid R
MN-07: north. R+4 | likely R
Alabama: loses 1 district (most of current 6th). Huntsville and Mobile are growing. The rest of the state is kind of meh.
()
AL-01: Mobile/south
McCain +27 | Romney +31 | Trump +35
R+18 | solid R
AL-02: black belt
Obama +6 | Obama +11 | Clinton +3
D+2 | lean D
AL-03: east
McCain +30 | Romney +31 | Trump +36
R+18 | solid R
AL-04: north central
McCain +57 | Romney +63 | Trump +69
R+34 | solid R
AL-05: Huntsville/north.
Obama +26 | Romney +30 | Trump +34
R+18 | solid R
AL-06: Birmingham
McCain +3 | Romney +5 | Clinton +0.3
R+3 | tossup
Illinois: Im not doing this state bc the drf file isnt working rip
Iowa: Des Moines is growing quickly. Also Iowa City and the eastern cities are growing.
()
IA-01: Des Moines. D+2 | tilt D
IA-02: rural east. R+4 | likely R
IA-03: urban east. D+5 | lean D
IA-04: west. R+13 | solid R
Kentucky: Lexington, Louisville, and northern suburbs are growing. The west and east are bleeding population. The more KY-04 becomes concentrated around Lexington, the more competitive itll get.
()
KY-01: west. R+21 | solid R
KY-02. Louisville. D+6 | solid D
KY-03: Ohio River suburbs. R+19 | solid R
KY-04: Lexington. R+8 | likely R
KY-05: east. R+28 | solid R
KY-06: south. R+22 | solid R
West Virginia: loses 1 district. I didnt put much thought into this map honestly, by the 2020s I doubt there will be any actual chance of a Democrat winning one of the seats.
()
WV-01: north. R+19 | solid R
WV-02: south. (more ancestrally D) R+20 | solid R
Texas: gains 2 seats with 2016-2017-based projections. If it gains 3 then rip I have to make a new map. Most growth is happening in the triangle.
IM NOT DOING THIS EITHER BECAUSE THE FILE GOT RUINED TOO
Montana: would gain its 2nd district with 2016-2017-based projections. If not then it just stays one at-large district.
()
MT-01: western cities. growing slightly faster than the 2nd I think. R+4 | tilt R
MT-02: east. (I dont feel like calculating this but its clearly solid R)
Colorado: gains 1 district (southern Denver burbs). might be highly competitive in the 2020s considering high growth and recent trends.
()
CO-01: Adams+north Denver. D+17 | solid D *majority-minority?*
CO-02: Boulder+Fort Collins. D+11 | solid D
CO-03: west. R+7 | likely R
CO-04: east. R+14 | solid R
CO-05: Colorado Springs. R+13 | solid R
CO-06: south Denver+Aurora. D+21 | solid D
CO-07: west Denver burbs. D+2 | lean D
CO-08: south Denver burbs. R+6 | lean R
Nevada: Almost ¾ of the districts are now entirely within Clark County. The map actually turns out very fair, with 1 solid D seat, 1 solid R seat, and 2 tossups. Again, Clark County is very big so this is probably a little off.
()
NV-01: Las Vegas D+19 | solid D
NV-02: not Clarke. R+8 | solid R
NV-03: Vegas suburbs, south. D+1 | tossup
NV-04: Vegas suburbs, north. R+1 | tossup
Arizona: gains 1 district (Glendale). Growth is concentrated in the Phoenix area. Districts here wont be precise like in New Jersey or Massachusetts, so take this with a grain of salt.
()
()
AZ-01: northeast, Indian reservations. R+2 | tilt R
AZ-02: Tucson/southeast. R+4 | tossup
AZ-03: southern border. D+9 | solid D *majority Hispanic*
AZ-04: west. R+19 | solid R
AZ-05: Gilbert. R+17 | solid R
AZ-06: Scottsdale. D+2 | likely D
AZ-07: Phoenix. D+23 | solid D *majority Hispanic*
AZ-08: northern exurbs. R+15 | solid R
AZ-09: Mesa/Chandler. R+4 | tossup
AZ-10: Glendale. R+1 | lean D
Oregon: gains 1 seat in the Portland suburbs.
This is technically a 3/3 map in terms of PVI, but half the districts are very competitive. If Im not mistaken, Oregons Democratic incumbents are all pretty popular, so this could actually end up being a typically 5-1 D delegation lmao.
()
OR-01: northwest/Portland burbs. D+6 | likely D
OR-02: east. R+10 | solid R
OR-03: Portland. D+31 | solid D
OR-04: south. R+2 | lean R
OR-05: central. R+2 | tilt R
OR-06: Portland burbs. D+2 | lean D
Title: Re: 2020 redistricting with DRA
Post by: America Needs a 13-6 Progressive SCOTUS on August 24, 2018, 08:25:39 PM
Issue:
( )
)
This is the projected 2020 apportionment changes. These projections show a confidence level beyond the margin of error too with regards to the difference in priority value between seat 435 and seat 436. Your projections seem to not line up with this.
(
This is the projected 2020 apportionment changes. These projections show a confidence level beyond the margin of error too with regards to the difference in priority value between seat 435 and seat 436. Your projections seem to not line up with this.
Title: Re: 2020 redistricting with DRA
Post by: cvparty on August 24, 2018, 11:14:01 PM
Issue:
()
This is the projected 2020 apportionment changes. These projections show a confidence level beyond the margin of error too with regards to the difference in priority value between seat 435 and seat 436. Your projections seem to not line up with this.
(
This is the projected 2020 apportionment changes. These projections show a confidence level beyond the margin of error too with regards to the difference in priority value between seat 435 and seat 436. Your projections seem to not line up with this.
Title: Re: 2020 redistricting with DRA
Post by: jimrtex on August 25, 2018, 01:42:21 AM
The Census Bureau produces population estimates for congressional districts based on the ACS.
How close do these match the current districts using your estimate data?
How close do these match the current districts using your estimate data?
Title: Re: 2020 redistricting with DRA
Post by: Since I'm the mad scientist proclaimed by myself on August 25, 2018, 04:46:32 AM
It has a pretty significant R lean that should probably be corrected.
Title: Re: 2020 redistricting with DRA
Post by: they don't love you like i love you on August 25, 2018, 07:31:37 AM
Minnesota: loses 1 district (most of current 7th). The Twin Cities metro area is growing healthily. The rest of the state not so much.
()
MN-01: south. R+5 | likely R
MN-02: south suburbs. R+1 | tossup
MN-03: west suburbs. D+3 | likely D
MN-04: north suburbs. EVEN | tossup
MN-05: Twin Cities. D+30 | solid D
MN-06: central. R+15 | solid R
MN-07: north. R+4 | likely R
()
MN-01: south. R+5 | likely R
MN-02: south suburbs. R+1 | tossup
MN-03: west suburbs. D+3 | likely D
MN-04: north suburbs. EVEN | tossup
MN-05: Twin Cities. D+30 | solid D
MN-06: central. R+15 | solid R
MN-07: north. R+4 | likely R
Not going to happen. Even the Republicans don't want to combine the Twin Cities anymore.
Title: Re: 2020 redistricting with DRA
Post by: President Punxsutawney Phil on August 25, 2018, 07:43:23 AM
Minnesota: loses 1 district (most of current 7th). The Twin Cities metro area is growing healthily. The rest of the state not so much.
()
MN-01: south. R+5 | likely R
MN-02: south suburbs. R+1 | tossup
MN-03: west suburbs. D+3 | likely D
MN-04: north suburbs. EVEN | tossup
MN-05: Twin Cities. D+30 | solid D
MN-06: central. R+15 | solid R
MN-07: north. R+4 | likely R
()
MN-01: south. R+5 | likely R
MN-02: south suburbs. R+1 | tossup
MN-03: west suburbs. D+3 | likely D
MN-04: north suburbs. EVEN | tossup
MN-05: Twin Cities. D+30 | solid D
MN-06: central. R+15 | solid R
MN-07: north. R+4 | likely R
Not going to happen. Even the Republicans don't want to combine the Twin Cities anymore.
Title: Re: 2020 redistricting with DRA
Post by: cvparty on August 25, 2018, 12:27:16 PM
It has a pretty significant R lean that should probably be corrected.
Republicans only lead by a narrow 15 seats when counting >1 PVI seats. And thats based on 2016 PVIs! This is for the next decade and a lot will change. There are plenty of narrowly Republican districts that have trended hard D recently (TX, CA, AZ, NC, GA), while there arent as many on the D side. By the 2020s Id expect this to be closer to even (it already is quite close)
Title: Re: 2020 redistricting with DRA
Post by: cvparty on August 25, 2018, 12:36:20 PM
Minnesota: loses 1 district (most of current 7th). The Twin Cities metro area is growing healthily. The rest of the state not so much.
()
MN-01: south. R+5 | likely R
MN-02: south suburbs. R+1 | tossup
MN-03: west suburbs. D+3 | likely D
MN-04: north suburbs. EVEN | tossup
MN-05: Twin Cities. D+30 | solid D
MN-06: central. R+15 | solid R
MN-07: north. R+4 | likely R
()
MN-01: south. R+5 | likely R
MN-02: south suburbs. R+1 | tossup
MN-03: west suburbs. D+3 | likely D
MN-04: north suburbs. EVEN | tossup
MN-05: Twin Cities. D+30 | solid D
MN-06: central. R+15 | solid R
MN-07: north. R+4 | likely R
Not going to happen. Even the Republicans don't want to combine the Twin Cities anymore.
youre prob not wrong about it not happening though. Im just stating my case
Title: Re: 2020 redistricting with DRA
Post by: cvparty on August 25, 2018, 01:50:49 PM
The Census Bureau produces population estimates for congressional districts based on the ACS.
How close do these match the current districts using your estimate data?
How close do these match the current districts using your estimate data?
Title: Re: 2020 redistricting with DRA
Post by: America Needs a 13-6 Progressive SCOTUS on August 25, 2018, 02:10:53 PM
Issue:
()
This is the projected 2020 apportionment changes. These projections show a confidence level beyond the margin of error too with regards to the difference in priority value between seat 435 and seat 436. Your projections seem to not line up with this.
(
This is the projected 2020 apportionment changes. These projections show a confidence level beyond the margin of error too with regards to the difference in priority value between seat 435 and seat 436. Your projections seem to not line up with this.
Title: Re: 2020 redistricting with DRA
Post by: cvparty on August 25, 2018, 02:18:14 PM
Issue:
()
This is the projected 2020 apportionment changes. These projections show a confidence level beyond the margin of error too with regards to the difference in priority value between seat 435 and seat 436. Your projections seem to not line up with this.
(
This is the projected 2020 apportionment changes. These projections show a confidence level beyond the margin of error too with regards to the difference in priority value between seat 435 and seat 436. Your projections seem to not line up with this.
Title: Re: 2020 redistricting with DRA
Post by: America Needs a 13-6 Progressive SCOTUS on August 25, 2018, 02:22:52 PM
Issue:
()
This is the projected 2020 apportionment changes. These projections show a confidence level beyond the margin of error too with regards to the difference in priority value between seat 435 and seat 436. Your projections seem to not line up with this.
(
This is the projected 2020 apportionment changes. These projections show a confidence level beyond the margin of error too with regards to the difference in priority value between seat 435 and seat 436. Your projections seem to not line up with this.
Title: Re: 2020 redistricting with DRA
Post by: windjammer on August 25, 2018, 02:23:50 PM
Wonderful job!
So basically AZ is the state that is the most hostile to republicans geographically?
So basically AZ is the state that is the most hostile to republicans geographically?
Title: Re: 2020 redistricting with DRA
Post by: cvparty on August 25, 2018, 03:24:38 PM
Wonderful job!
So basically AZ is the state that is the most hostile to republicans geographically?
So basically AZ is the state that is the most hostile to republicans geographically?
Title: Re: 2020 redistricting with DRA
Post by: cvparty on August 25, 2018, 03:32:11 PM
Issue:
()
This is the projected 2020 apportionment changes. These projections show a confidence level beyond the margin of error too with regards to the difference in priority value between seat 435 and seat 436. Your projections seem to not line up with this.
(
This is the projected 2020 apportionment changes. These projections show a confidence level beyond the margin of error too with regards to the difference in priority value between seat 435 and seat 436. Your projections seem to not line up with this.
also everyone plz actually use the data once I upload it DKJFKSD I didn't do all this work for nothing
Title: Re: 2020 redistricting with DRA
Post by: America Needs a 13-6 Progressive SCOTUS on August 25, 2018, 04:44:27 PM
In my opinion, keeping Ramsey County, Minnesota whole should be high priority.
Title: Re: 2020 redistricting with DRA
Post by: cvparty on August 25, 2018, 05:17:29 PM
I POSTED THE FILES
Title: Re: 2020 redistricting with DRA
Post by: cvparty on August 25, 2018, 05:18:29 PM
In my opinion, keeping Ramsey County, Minnesota whole should be high priority.
Title: Re: 2020 redistricting with DRA
Post by: Continential on August 26, 2018, 07:52:51 AM
Richard Ojeda though
Title: Re: 2020 redistricting with DRA
Post by: President Punxsutawney Phil on August 26, 2018, 08:52:08 AM
I POSTED THE FILES
How do you access the new numbers?
Also, it looks like the current FL-25 is destined to flip next decade. Only a matter of time. Same with MN-7/8 too. Also, NV-3 should become much safer with Clark County being able to support virtually all of three CD's.
Title: Re: 2020 redistricting with DRA
Post by: President Punxsutawney Phil on August 26, 2018, 09:20:54 AM
()
This is a possible alternative - though it would have to be tweaked based off 2020 census numbers.
MN-01: 51-46 Obama, R+4.86
MN-02: 50-48 Obama, R+1.44
MN-03: 53-46 McCain, R+6.72
MN-04: 61-37 Obama, D+11.7
MN-05: 71-27 Obama, D+23.56
MN-06: 53-45 McCain, R+13.79
MN-07: 54-43 Obama, R+3.57
This is a possible alternative - though it would have to be tweaked based off 2020 census numbers.
MN-01: 51-46 Obama, R+4.86
MN-02: 50-48 Obama, R+1.44
MN-03: 53-46 McCain, R+6.72
MN-04: 61-37 Obama, D+11.7
MN-05: 71-27 Obama, D+23.56
MN-06: 53-45 McCain, R+13.79
MN-07: 54-43 Obama, R+3.57
Title: Re: 2020 redistricting with DRA
Post by: President Punxsutawney Phil on August 26, 2018, 09:51:04 AM
Based off 2017 census estimates...MN-01 has 769,492 people, under quota by around 27,000 people. Add Brown County in and now it's within range. this makes it R+5.22, and 50.9-46.7 Obama.
MN-02 has around 814,700 or so people. It is over quota by 17,000 people. If it cedes Cedar Lake, Helena, and Sand Creek townships in Scott County, it is within quota. It now is R+1.15, and 50.6-47.5 Obama.
MN-02 has around 814,700 or so people. It is over quota by 17,000 people. If it cedes Cedar Lake, Helena, and Sand Creek townships in Scott County, it is within quota. It now is R+1.15, and 50.6-47.5 Obama.
Title: Re: 2020 redistricting with DRA
Post by: cvparty on August 26, 2018, 11:19:34 AM
I POSTED THE FILES
How do you access the new numbers?
Also, it looks like the current FL-25 is destined to flip next decade. Only a matter of time. Same with MN-7/8 too. Also, NV-3 should become much safer with Clark County being able to support virtually all of three CD's.
let me know if you run into any problems
Title: Re: 2020 redistricting with DRA
Post by: Former Dean Phillips Supporters for Haley (I guess???!?) 👁️ on August 26, 2018, 11:37:14 AM
Impressive work. Regardless of any possible nitpicks, well done!
Title: Re: 2020 redistricting with DRA
Post by: Nyvin on August 26, 2018, 03:12:05 PM
Will you be making one for Illinois?
Title: Re: 2020 redistricting with DRA
Post by: cvparty on August 26, 2018, 03:26:13 PM
Impressive work. Regardless of any possible nitpicks, well done!
Will you be making one for Illinois?
Title: Re: 2020 redistricting with DRA
Post by: Sol on August 26, 2018, 09:15:22 PM
I POSTED THE FILES
How do you access the new numbers?
Also, it looks like the current FL-25 is destined to flip next decade. Only a matter of time. Same with MN-7/8 too. Also, NV-3 should become much safer with Clark County being able to support virtually all of three CD's.
let me know if you run into any problems
Sorry, I'm a bit of a dunce with computer stuff--would it be possible to a very ELI5 tutorial with this?
Title: Re: 2020 redistricting with DRA
Post by: cvparty on August 27, 2018, 09:52:23 AM
I just added separate 2012 and 2016 prez results to New Jersey and Massachusetts >:3 more states to come soon. I might integrate it with the data to see in DRA if I can figure that out
Title: Re: 2020 redistricting with DRA
Post by: cvparty on August 27, 2018, 09:59:21 AM
I POSTED THE FILES
How do you access the new numbers?
Also, it looks like the current FL-25 is destined to flip next decade. Only a matter of time. Same with MN-7/8 too. Also, NV-3 should become much safer with Clark County being able to support virtually all of three CD's.
let me know if you run into any problems
Sorry, I'm a bit of a dunce with computer stuff--would it be possible to a very ELI5 tutorial with this?
Title: Re: 2020 redistricting with DRA
Post by: KingSweden on August 27, 2018, 10:17:56 AM
Do you have breakdowns of your WA map?
Title: Re: 2020 redistricting with DRA
Post by: jimrtex on August 31, 2018, 01:14:34 AM
The Census Bureau produces population estimates for congressional districts based on the ACS.
How close do these match the current districts using your estimate data?
How close do these match the current districts using your estimate data?
You should be able to compare a projection of the growth from the 2010 Census to the 2016 ACS projected to 2020 - and compare with your alternate projection.
Incidentally, the 2017 ACS will be released on September 1.
Title: Re: 2020 redistricting with DRA
Post by: catographer on September 10, 2018, 06:49:16 PM
Where'd u get 2012 and 2016 result estimates for your districts?
Title: Re: 2020 redistricting with DRA
Post by: Nyvin on September 10, 2018, 06:57:57 PM
Where'd u get 2012 and 2016 result estimates for your districts?
They're in DRA now for most states (maybe all of them?)
Title: Re: 2020 redistricting with DRA
Post by: America Needs a 13-6 Progressive SCOTUS on September 10, 2018, 07:27:26 PM
Where'd u get 2012 and 2016 result estimates for your districts?
They're in DRA now for most states (maybe all of them?)
How do I access them? All I see right now is a vague 2012/2016 PVI tab.
Title: Re: 2020 redistricting with DRA
Post by: cvparty on September 17, 2018, 06:36:04 AM
Where'd u get 2012 and 2016 result estimates for your districts?
They're in DRA now for most states (maybe all of them?)
How do I access them? All I see right now is a vague 2012/2016 PVI tab.
Title: Re: 2020 redistricting with DRA
Post by: catographer on September 18, 2018, 03:11:09 PM
Where'd u get 2012 and 2016 result estimates for your districts?
They're in DRA now for most states (maybe all of them?)
How do I access them? All I see right now is a vague 2012/2016 PVI tab.
how did u put DK data for 2016 into the DRA files/datasets? looks complicated.
Title: Re: 2020 redistricting with DRA.
Post by: cvparty on September 18, 2018, 03:52:21 PM
Where'd u get 2012 and 2016 result estimates for your districts?
They're in DRA now for most states (maybe all of them?)
How do I access them? All I see right now is a vague 2012/2016 PVI tab.
how did u put DK data for 2016 into the DRA files/datasets? looks complicated.
Title: Re: 2020 redistricting with DRA
Post by: Lachi on November 13, 2018, 03:10:08 AM
Just copy and pasting isn't working for me, I'm still seeing the 2010 data
Title: Re: 2020 redistricting with DRA
Post by: Lachi on November 14, 2018, 03:35:16 AM
Hello? anyone able to help here?
Title: Re: 2020 redistricting with DRA
Post by: cvparty on November 14, 2018, 07:35:38 AM
Hello? anyone able to help here?
Title: Re: 2020 redistricting with DRA
Post by: Former Dean Phillips Supporters for Haley (I guess???!?) 👁️ on November 14, 2018, 05:54:42 PM
Hello? anyone able to help here?
Did you try re-starting DRA? Be sure to close your browser and then re-load it after replacing the file. That may be an obvious thing, but just in case you didn't do that, try that.
Title: Re: 2020 redistricting with DRA
Post by: Bidenworth2020 on November 14, 2018, 06:16:22 PM
dude can you add pictures im hella confused
Title: Re: 2020 redistricting with DRA
Post by: Lachi on November 14, 2018, 07:15:12 PM
Hello? anyone able to help here?
Did you try re-starting DRA? Be sure to close your browser and then re-load it after replacing the file. That may be an obvious thing, but just in case you didn't do that, try that.
Title: Re: 2020 redistricting with DRA
Post by: cvparty on November 14, 2018, 08:30:12 PM
dude can you add pictures im hella confused
Title: Re: 2020 redistricting with DRA
Post by: Sol on November 19, 2018, 01:56:07 PM
Hey so I figured out how to use this, but some of the precincts in NC are blank, with no data or population. Why would this be so? I redid it twice.
Title: Re: 2020 redistricting with DRA
Post by: Lachi on November 22, 2018, 04:11:36 AM
cv, any progress on a guide?
Title: Re: 2020 redistricting with DRA
Post by: Lachi on December 23, 2018, 07:33:23 PM
Still waiting :P
Title: Re: 2020 redistricting with DRA
Post by: cvparty on December 24, 2018, 06:22:00 PM
im applying to college pls hold
Title: Re: 2020 redistricting with DRA
Post by: Lachi on December 24, 2018, 06:50:36 PM
im applying to college pls hold
Title: Re: 2020 redistricting with DRA
Post by: Idaho Conservative on March 09, 2019, 01:53:05 AM
Pretty good but a couple of the states need improvement. AZ is probably the one most needing change, waaaay too many swing districts. 1 or 2 would be appropriate but 5? AZ should have at minimum 5 solidly R seats and 3 or 4 solidly D seats. Most likely giving the state a 5-5 or 6R-4D delegation depending on the year. Also, 3 swing seats in the north Atlanta suburbs are way too much, basically a gerrymander that will result in greater Atlanta being represented by 6 Dems in Congress. Atlanta metro should have 4 solidly Democratic seats (3 being black) and 3 Republican seats in the suburbs. That would be representative of the overall Democratic lean of metro Atlanta without a potential 6-0 or 5-1 blowout. Oregon is actually gerrymandered for Republicans, no way a Dem leaning state should have half R leaning districts. Even if they are competitive. OR should have 3 soldiy D seats, 2 solidly R, and 1 even seat that would likely be won by Dem considering both of Oregon's "swing" seats have gone Dem every cycle. The resulting 4D-2R delegation would be representative of the state. Finally, Clark county should be divided into 1 safe Dem seat (around D+20), a likely Dem seat (around D+8) and a lean Rep seat (around R+6). Since the county generally votes Dem 55-45, or 60-40, having 2 Dems in the city and a Republican in the outer ring suburbs would represent Vegas area well, resulting in a split delegation from NV. Which is the fairest possible delegation for a state that is pretty 50-50.
Title: Re: 2020 redistricting with DRA
Post by: Cokeland Saxton on March 09, 2019, 12:16:08 PM
What's wrong with swing seats? At least they're competitive.
Title: Re: 2020 redistricting with DRA
Post by: Idaho Conservative on March 09, 2019, 06:00:14 PM
I never said we shouldn't have them, but having 5/10 swing seats is absurd and would end up being a Democratic gerrymander. AZ is trending blue, so it would result in a 7 D- 3 R delegation by the end of the decade, maybe sooner. If AZ had a Dem trifecta, that would make sense. If you control the process, you get to draw. But AZ has a nonpartisan commission. No way should they draw a Dem gerrymander that brazen. AZ currently has 4 red seats, after gaining a seat in 2022, that number shouldn't go down.
Title: Re: 2020 redistricting with DRA
Post by: diptheriadan on March 10, 2019, 12:41:40 AM
I really hope that the 7th becomes a Clarksville-based district instead of being largely based around Williamson County.
Title: Re: 2020 redistricting with DRA
Post by: Ex-Assemblyman Steelers on March 11, 2019, 06:29:13 AM
Looks like WV could not be competitive. This is my first map.
http://dra.indirect.cc/join/c4c72833-204a-4b3b-8cd0-c5cf1a3b02b8
http://dra.indirect.cc/join/c4c72833-204a-4b3b-8cd0-c5cf1a3b02b8
Title: Re: 2020 redistricting with DRA
Post by: Lachi on March 11, 2019, 08:42:08 AM
Looks like WV could not be competitive. This is my first map.
http://dra.indirect.cc/join/c4c72833-204a-4b3b-8cd0-c5cf1a3b02b8
http://dra.indirect.cc/join/c4c72833-204a-4b3b-8cd0-c5cf1a3b02b8
Title: Re: 2020 redistricting with DRA
Post by: Ex-Assemblyman Steelers on March 11, 2019, 09:04:10 AM
http://dra.indirect.cc/join/414d0d03-3b42-414f-8a37-fc0252d69b65