Title: Does the 1972 map resemble 2000-2016 maps?
Post by: darklordoftech on September 20, 2019, 12:05:34 PM
If you look at where and with what demographics Nixon and McGovern did best/worst, does it resemble 2000-2016?
Title: Re: Does the 1972 map resemble 2000-2016 maps?
Post by: OSR stands with Israel on September 20, 2019, 12:16:15 PM
Nixons worst major state was also CA in 1972
Title: Re: Does the 1972 map resemble 2000-2016 maps?
Post by: Calthrina950 on September 20, 2019, 01:58:17 PM
If you look at where and with what demographics Nixon and McGovern did best/worst, does it resemble 2000-2016?
In many ways, yes. With the exceptions of South Dakota and Montana, every state where McGovern did better than his national average in 1972 was won by Obama in 2008 and 2012. Though of course, there were several states where McGovern did worse than his national average that Obama won either once or twice-Virginia, North Carolina, Florida, Indiana, Colorado, New Mexico, Nevada, Maryland, New Jersey, Vermont, New Hampshire, Maine, and Hawaii.
Title: Re: Does the 1972 map resemble 2000-2016 maps?
Post by: Calthrina950 on September 20, 2019, 02:05:31 PM
If you look at where and with what demographics Nixon and McGovern did best/worst, does it resemble 2000-2016?
Another similarity is that McGovern in 1972 did very well in college towns, winning counties such as Washtenaw County, Michigan, Alexander County, Illinois, Johnson County, Iowa, and Athens County, Ohio, and outperforming Hubert Humphrey in many other college-town counties that he did not carry. College students were also a critical factor as regards to McGovern's victory in Massachusetts. McGovern, even in his landslide loss, accelerated the Democratic trend among college students and among postgraduates that has reached fruition in this century. However, one difference is that Nixon managed to garner nearly 20% of the black vote, winning many Black Belt counties that no Republican has carried since, and coming close in several others. This is part of the reason why McGovern did so badly in the South, performing worse than every Democratic candidate after him, including Mondale, Kerry, and Obama.
Title: Re: Does the 1972 map resemble 2000-2016 maps?
Post by: Beefalow and the Consumer on September 20, 2019, 02:44:09 PM
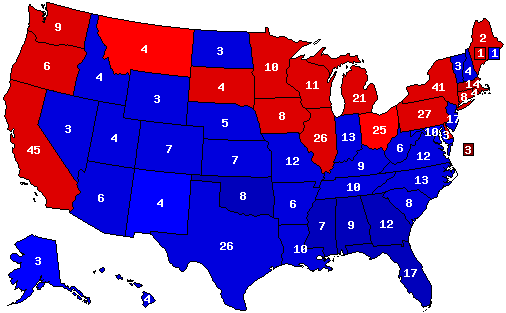
If you shift every state to their vote relative to the nation, simulating a 49%/49%/2% popular result, you get this:
( )
)
That doesn't look much like a 2000-2016 map to me.
(
That doesn't look much like a 2000-2016 map to me.
Title: Re: Does the 1972 map resemble 2000-2016 maps?
Post by: darklordoftech on September 20, 2019, 02:50:26 PM
If you shift every state to their vote relative to the nation, simulating a 49%/49%/2% popular result, you get this:
( )
)
That doesn't look much like a 2000-2016 map to me.
(
That doesn't look much like a 2000-2016 map to me.
Title: Re: Does the 1972 map resemble 2000-2016 maps?
Post by: Politician on September 20, 2019, 02:55:44 PM
If you shift every state to their vote relative to the nation, simulating a 49%/49%/2% popular result, you get this:
( )
)
That doesn't look much like a 2000-2016 map to me.
(
That doesn't look much like a 2000-2016 map to me.
Title: Re: Does the 1972 map resemble 2000-2016 maps?
Post by: Beefalow and the Consumer on September 20, 2019, 02:59:12 PM
Closest states:
Maine (0.17% D)
Alaska (0.36% R)
Maryland (0.75% R)
New Mexico (1.34% R)
Missouri (1.44% R)
Ohio (1.59% D)
New Jersey (1.65% R)
Hawaii (1.81% R)
Delaware (2.74% D)
Vermont (3.05% R)
Montana (3.07% D)
North Dakota (3.13% R)
Pennsylvania (3.17% D)
Maine (0.17% D)
Alaska (0.36% R)
Maryland (0.75% R)
New Mexico (1.34% R)
Missouri (1.44% R)
Ohio (1.59% D)
New Jersey (1.65% R)
Hawaii (1.81% R)
Delaware (2.74% D)
Vermont (3.05% R)
Montana (3.07% D)
North Dakota (3.13% R)
Pennsylvania (3.17% D)
Title: Re: Does the 1972 map resemble 2000-2016 maps?
Post by: Beefalow and the Consumer on September 20, 2019, 03:00:52 PM
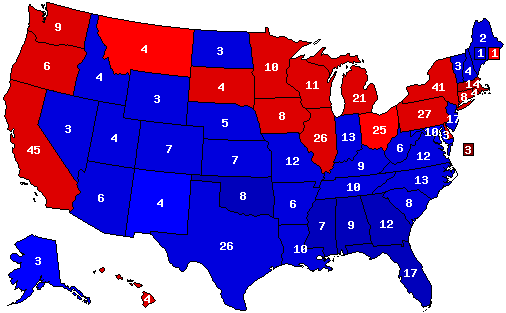
If you shift every state to their vote relative to the nation, simulating a 49%/49%/2% popular result, you get this:
()
That doesn't look much like a 2000-2016 map to me.
(
That doesn't look much like a 2000-2016 map to me.
I messed up Hawaii. So it's 39 out of 50 states.
Title: Re: Does the 1972 map resemble 2000-2016 maps?
Post by: Beefalow and the Consumer on September 20, 2019, 03:08:18 PM
The differences between 1972 and 2000-2016:
1. Northeastern liberal/moderate Republicans were still a thing
2. BosNyWash suburbs hadn't spread as far into CT/NJ/MD/VA/DE
3. Northern Plains farmer-progressives were a much larger group, covering a much larger territory
By 2000 the liberal Republicans were Democrats, Northeastern states were much more diverse, and all that remained of the northern farmer-progressives was the northern-Mississippi-Valley anomaly, which itself was almost extinct.
Title: Re: Does the 1972 map resemble 2000-2016 maps?
Post by: Sumner 1868 on September 21, 2019, 01:44:54 PM
If you shift every state to their vote relative to the nation, simulating a 49%/49%/2% popular result, you get this:
()
That doesn't look much like a 2000-2016 map to me.
(
That doesn't look much like a 2000-2016 map to me.
Democrats would have been much better off creating the coalition this map shows than chasing southern votes for another quarter century.
Title: Re: Does the 1972 map resemble 2000-2016 maps?
Post by: OSR stands with Israel on September 21, 2019, 02:13:41 PM
If you shift every state to their vote relative to the nation, simulating a 49%/49%/2% popular result, you get this:
()
That doesn't look much like a 2000-2016 map to me.
(
That doesn't look much like a 2000-2016 map to me.
Democrats would have been much better off creating the coalition this map shows than chasing southern votes for another quarter century.
CA wasnt there yet , as SoCal was still very conservative and the NoCal rural areas were trending GOP fast which made the 1980s probably the best decade for Conservative Republicans in The state of CA . Gerrymandering basically is what saved the CA Dems from losing their state legislative majorities and House delegation advantage (as in 1980 ,84 I believe the GOP got more overall votes in CA).
https://en.m.wikipedia.org/wiki/1980_United_States_House_of_Representatives_elections_in_California
https://en.m.wikipedia.org/wiki/1984_United_States_House_of_Representatives_elections_in_California
In 1988 things started to change but it still wasnt their for the Dems till 92 . Reagan for one outperformed Nixon in much of SoCal
Title: Re: Does the 1972 map resemble 2000-2016 maps?
Post by: Beefalow and the Consumer on September 23, 2019, 10:27:03 AM
If you shift every state to their vote relative to the nation, simulating a 49%/49%/2% popular result, you get this:
()
That doesn't look much like a 2000-2016 map to me.
(
That doesn't look much like a 2000-2016 map to me.
Democrats would have been much better off creating the coalition this map shows than chasing southern votes for another quarter century.
If Roe v Wade had never happened the following year, the New Deal Coalition probably could have been rebuilt, and you'd have a much broader battleground. Things were better off when voters in places like Texas and Tennessee mattered.
I'd rather have an alignment with 35 battleground states than one with 10. Regardless of who is winning elections, that's healthier for the nation as a whole.
Title: Re: Does the 1972 map resemble 2000-2016 maps?
Post by: Sumner 1868 on September 23, 2019, 11:25:50 PM
If you shift every state to their vote relative to the nation, simulating a 49%/49%/2% popular result, you get this:
()
That doesn't look much like a 2000-2016 map to me.
(
That doesn't look much like a 2000-2016 map to me.
Democrats would have been much better off creating the coalition this map shows than chasing southern votes for another quarter century.
If Roe v Wade had never happened the following year, the New Deal Coalition probably could have been rebuilt, and you'd have a much broader battleground. Things were better off when voters in places like Texas and Tennessee mattered.
I'd rather have an alignment with 35 battleground states than one with 10. Regardless of who is winning elections, that's healthier for the nation as a whole.
I disagree. First, while Roe probably killed the Democrats already weak stance in the Plains, it didn't really have much impact in the South. Busing and desegregation efforts toward private schools had more impact. The evangelicals were even united on that issue until Jerry Falwell started courting Catholics.
While I agree on paper that it's best to have across-the-board representation, Democrats fixation on the South in the late 20th century led to many negative political trends - mass incineration the most blatant example. It also meant that a badly needed de-Confederateization never occurred after Jim Crow, as the South's racial bigotry, militarism, and televangelism was pandered to by Jimmy Carter and Bill Clinton as much as by the GOP. Making matters worse, the fixation of giving the South pork and appeasing it's bad prejudices occurred at the expense of the rest of the nation (look at how little help the Rust Belt, family farms, inner cities, etc, got under Carter and Clinton).
Title: Re: Does the 1972 map resemble 2000-2016 maps?
Post by: morgankingsley on September 24, 2019, 08:11:20 PM
I could see how it could show some extremely early signs of what was to come, but on the whole, no
Title: Re: Does the 1972 map resemble 2000-2016 maps?
Post by: 538Electoral on September 25, 2019, 01:07:44 PM
Not at all.
Title: Re: Does the 1972 map resemble 2000-2016 maps?
Post by: VPH on September 25, 2019, 05:28:56 PM
1972 reflected the initial failure of the Democrats' attempt to break free from their New Deal coalition roots and pull together a "Social Change coalition" based on young people, minorities, and middle to upper-middle-class liberals (Mark Stricherz summarizes this well in "Why the Democrats Are Blue"). That tactic fell really flat in 1972 when organized labor was a large base for the party and found itself suddenly cast aside. However, with the decline of organized labor and the increasing adoption of cultural liberalism, it's become the Democratic strategy since.
Title: Re: Does the 1972 map resemble 2000-2016 maps?
Post by: 538Electoral on September 26, 2019, 01:33:45 AM
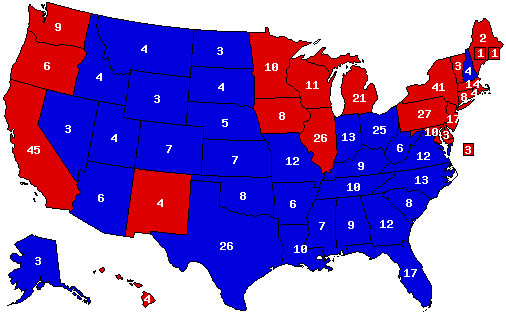
Fun fact: Republicans lose in 1972 with the 2000 map as the proper redistricting wouldn't have happened yet.
( )
)
278-260
Not even one of IA, NM or OR would've given Bush a victory in 1972. Republicans probably would've needed WI in this scenario.
(
278-260
Not even one of IA, NM or OR would've given Bush a victory in 1972. Republicans probably would've needed WI in this scenario.
Title: Re: Does the 1972 map resemble 2000-2016 maps?
Post by: morgankingsley on September 26, 2019, 03:47:37 AM
Fun fact: Republicans lose in 1972 with the 2000 map as the proper redistricting wouldn't have happened yet.
()
278-260
Not even one of IA, NM or OR would've given Bush a victory in 1972. Republicans probably would've needed WI in this scenario.
(
278-260
Not even one of IA, NM or OR would've given Bush a victory in 1972. Republicans probably would've needed WI in this scenario.
I actually did not know that.
Title: Re: Does the 1972 map resemble 2000-2016 maps?
Post by: darklordoftech on October 01, 2019, 08:11:59 PM
What I had in mind with the OP is that Nixon did better with working class, rural, and evangelical voters than in 1972 than he did in 1960 and 1968 or any other Republican did in 1932-1996. Also, Nixon won West Virginia, one of three times WV voted Republican in 1932-1996.
Title: Re: Does the 1972 map resemble 2000-2016 maps?
Post by: mianfei on October 02, 2019, 06:26:47 AM
What I had in mind with the OP is that Nixon did better with working class, rural, and evangelical voters in 1972 than he did in 1960 and 1968 or any other Republican did in 1932-1996. Also, Nixon won West Virginia, one of three times WV voted Republican in 1932-1996.
I read about a week ago that Hilary Clinton won only a third of the poorest white voters nationwide, and given that McGovern won 31 percent of the white vote and carried certain poor white rural counties where Hilary could not get a quarter of the vote, its not impossible McGovern did better than 31 percent amongst these lowest-income whites, many of whom have supported his anti-war stance even if they did not like his other policies.