Title: Gay marriage map
Post by: bgwah on December 27, 2005, 05:49:18 AM
updated 2/16
This is a map of all the states that have voted on gay marriage. Blue=ban.
()
These counties are the biggest homo-lovers
77% Charlottesville, VA
74% Arlington, VA
71% San Miguel, CO
70% Alexandria, VA
70% Pitkin, CO
69% Richmond City, VA
67% Dane, WI
66% Blaine, ID
65% Petersburg, VA
65% Clay, SD
65% Shannon, SD
65% Boulder, CO
Title: Re: Gay marriage map
Post by: opebo on December 27, 2005, 06:48:50 AM
Nice map, Jesus, though of course it is a very sad indictment.
It would be neat to see a county map of the same civil rights violation as well!
It would be neat to see a county map of the same civil rights violation as well!
Title: Re: Gay marriage map
Post by: © tweed on December 27, 2005, 06:52:19 AM
What are the different shades? %ages that voted for the ban?
Title: Re: Gay marriage map
Post by: True Democrat on December 27, 2005, 10:34:01 AM
What are the different shades? %ages that voted for the ban?
It's how strongly that state voted to ban gay marriage. For example, over 50% of Oregon voted that way.
Title: Re: Gay marriage map
Post by: minionofmidas on December 27, 2005, 11:34:27 AM
Summit is one of the Dem's two bets to pick up a county in Utah (unless their old strength in Carbon revives, in that case it's one of their three bets). It's fairly touristic, but since the county town is called Coaldale I suppose it's got some old mining traditions as well. It's just across the mountains from Utah's most densely populated parts.
Title: Re: Gay marriage map
Post by: MaC on December 27, 2005, 02:40:45 PM
Nice map, Jesus, though of course it is a very sad indictment.
It would be neat to see a county map of the same civil rights violation as well!
It would be neat to see a county map of the same civil rights violation as well!
Only two democratic states voted for the ban. Wait a bit for the rest-I'd be interested in seeing how the New England states vote.
Title: Re: Gay marriage map
Post by: J-Mann on December 27, 2005, 02:55:17 PM
I'm not sure what your requirement is for a "ban," but Kansas has a constitutional amendment defining marriage which was approved in April, which is effectively a ban on gay marriage.
Title: Re: Gay marriage map
Post by: The Duke on December 27, 2005, 02:59:58 PM
California voted 65% to ban gay marriage in 2000.
Title: Re: Gay marriage map
Post by: bgwah on December 27, 2005, 03:36:30 PM
Okay John, I'll take your word for it.
I looked up Kansas, it was 69.9% for a ban.
Updated the map for California and Kansas.
I looked up Kansas, it was 69.9% for a ban.
Updated the map for California and Kansas.
Title: Re: Gay marriage map
Post by: © tweed on December 27, 2005, 03:37:42 PM
Didn't Alaska and Colorado also ban gay marraige in 2000? I remember reading that in Time magazine as a ten-year-old in the post-Election issue and wondering why 70% of people would want to ban gay marraige.
Title: Re: Gay marriage map
Post by: Starbucks Union Thug HokeyPuck on December 27, 2005, 03:40:26 PM
What fine states, true American ones.
What exactly about a gay marriage ban makes them more "American"?
Thankfully most of the Northeast is good, tolerant people.
Title: Re: Gay marriage map
Post by: 7,052,770 on December 27, 2005, 03:45:51 PM
how terribly unforunate, though not surprising
Title: Re: Gay marriage map
Post by: Bleeding heart conservative, HTMLdon on December 27, 2005, 04:02:58 PM
Tennessee will have the ban on the ballot this year.
Banning gay marriage is fine. The problem are the resolutions that ban civil unions or any other form of recognized partnerships as well.
Banning gay marriage is fine. The problem are the resolutions that ban civil unions or any other form of recognized partnerships as well.
Title: Re: Gay marriage map
Post by: Sam Spade on December 27, 2005, 04:10:56 PM
Travis County voted 59.94%-40.05% (81,170 to 54,246) against the Texas gay marriage amendment (only county to do so).
The amendment passed 76.25%-23.75% statewide (1,723,782 to 536,913)
Amusingly, if you remove Travis County from the results, the percentage would increase to 78.56%-21.44% statewide.
The amendment passed 76.25%-23.75% statewide (1,723,782 to 536,913)
Amusingly, if you remove Travis County from the results, the percentage would increase to 78.56%-21.44% statewide.
Title: Re: Gay marriage map
Post by: opebo on December 27, 2005, 04:20:26 PM
Travis County voted 59.94%-40.05% (81,170 to 54,246) against the Texas gay marriage amendment (only county to do so).
The amendment passed 76.25%-23.75% statewide (1,723,782 to 536,913)
Amusingly, if you remove Travis County from the results, the percentage would increase to 78.56%-21.44% statewide.
The amendment passed 76.25%-23.75% statewide (1,723,782 to 536,913)
Amusingly, if you remove Travis County from the results, the percentage would increase to 78.56%-21.44% statewide.
Similarly - and also amusing - if you remove Travis county from Texas the state's average IQ drops from 87 to 59! :)
Title: Re: Gay marriage map
Post by: Frodo on December 27, 2005, 04:28:54 PM
I was unable to find the exact figures, but Virginia banned gay marriage as early as 1997 -and even banned civil unions, and forbade private companies from extending health insurance benefits to unmarried couples -especially impacting homosexuals. Given that the amendment defining marriage as being exclusively between a man and a woman -as with a civil unions ban- passed the House of Delegates by a 4 to 1 margin, and the state Senate by a 3 to 1 margin, I would have to assume that the gay marriage ban in 1997 also passed by margins as solid as those in Texas and Mississippi.
Title: Re: Gay marriage map
Post by: A18 on December 27, 2005, 04:45:57 PM
I don't think there was a referendum.
Title: Re: Gay marriage map
Post by: Ben. on December 27, 2005, 06:07:11 PM
What fine states, true American ones.
And in what way is it fine or indicative of being true American to ban gay marriage.
I mean fair enough some folks dislike the concept of gay marriage but I dont think its indicative of anything either way, Im sure there are plenty of fine, true Americans who favour gay marriage.
I should certainly hope so as I for one would vote to legalise gay marriage its simply not right that same sex couples in loving monogamous relationships not be allowed the same rights as similar heterosexual couples in stable loving relationships, faiths and churchs are free to have their own polices concerning marriage and they certainly should have but I simply dont see why states should ban civil marriages for same sex couples.
Its really is rather sad and I think most folks know that I speak as a fairly conservative Democrat.
Title: Re: Gay marriage map
Post by: A18 on December 27, 2005, 06:14:32 PM
They do have the same rights. Each member of each has the right to marry someone of the opposite sex.
How about incestuous couples?
How about incestuous couples?
Title: Re: Gay marriage map
Post by: Frodo on December 27, 2005, 06:50:05 PM
I don't think there was a referendum.
No, there wasn't -but then Jesus didn't specify whether he wanted us to give figures on those states that did, specifically, pass referendums banning gay marriage, or whether those gay marriage bans were passed by state legislatures.
Either way, the gay marriage ban in Virginia probably passed solidly.
Title: Re: Gay marriage map
Post by: Speed of Sound on December 27, 2005, 06:53:42 PM
Nice map, Jesus, though of course it is a very sad indictment.
Title: Re: Gay marriage map
Post by: A18 on December 27, 2005, 07:43:49 PM
I don't think there was a referendum.
No, there wasn't -but then Jesus didn't specify whether he wanted us to give figures on those states that did, specifically, pass referendums banning gay marriage, or whether those gay marriage bans were passed by state legislatures.
Either way, the gay marriage ban in Virginia probably passed solidly.
I mean the people didn't vote on it, which is of course what he's using, given that it's a shaded map and such.
Title: Re: Gay marriage map
Post by: bgwah on December 27, 2005, 08:37:06 PM
I don't think there was a referendum.
No, there wasn't -but then Jesus didn't specify whether he wanted us to give figures on those states that did, specifically, pass referendums banning gay marriage, or whether those gay marriage bans were passed by state legislatures.
Either way, the gay marriage ban in Virginia probably passed solidly.
I do mean referendums.
I can't find election results to California's vote, can anyone help? I'll have to put it back to grey if I can't confirm it!
Title: Re: Gay marriage map
Post by: Emsworth on December 27, 2005, 08:41:50 PM
I can't find election results to California's vote, can anyone help? I'll have to put it back to grey if I can't confirm it!
Title: Re: Gay marriage map
Post by: Bandit3 the Worker on December 28, 2005, 12:57:32 AM
In Kentucky, I think Fayette County was the closest to not banning it. Jeffferson and Rowan (of all places) also came damn close.
I think Magoffin County was the worst, even though Kerry won that county. This is especially unusual because even on social issues like this, there are usually quite a few counties that are well to the right of Magoffin (such as Jackson or Monroe).
I think Magoffin County was the worst, even though Kerry won that county. This is especially unusual because even on social issues like this, there are usually quite a few counties that are well to the right of Magoffin (such as Jackson or Monroe).
Title: Re: Gay marriage map
Post by: Frodo on December 28, 2005, 12:59:29 AM
I don't think there was a referendum.
No, there wasn't -but then Jesus didn't specify whether he wanted us to give figures on those states that did, specifically, pass referendums banning gay marriage, or whether those gay marriage bans were passed by state legislatures.
Either way, the gay marriage ban in Virginia probably passed solidly.
I do mean referendums.
Great -then say so at the beginning of this thread.
Title: Re: Gay marriage map
Post by: Cubby on December 28, 2005, 02:02:53 AM
Tennessee will have the ban on the ballot this year.
Banning gay marriage is fine. The problem are the resolutions that ban civil unions or any other form of recognized partnerships as well.
Banning gay marriage is fine. The problem are the resolutions that ban civil unions or any other form of recognized partnerships as well.
No its not fine, people's lives are destroyed. Its so easy for others to just casually say "gay marriage should be banned", they don't have to worry about it, they can marry anyone they like.
And civil unions are a joke. Connecticut legalized them this year and less than 300 have been done, in a state with 3.5 million people. They are "separate but equal" (equal to the rights of marriage but separate in name) and not worth the effort. Those thousands of marriages in California and Oregon last year took place b/c people thought they were getting a meaningful contract, not a poll-tested compromise.
Christmas Cookies- A poll last spring (sorry I don't have source) of Connecticut residents/voters said that they were split 50/50 on legalizing same-sex marriage, but a big majority (somewhere around 65-75%) were for civil unions. Thats why the State Assembly took the latter route. The sad thing is 50% in favor of full marriage rights would be one of the highest rates in the country.
Title: Re: Gay marriage map
Post by: GOP = Terrorists on December 28, 2005, 02:08:07 AM
And civil unions are a joke.
Would you accept the state declaring state involvement in marriage a violation of the establishment clause? So civil unions all around?
Title: Re: Gay marriage map
Post by: Cubby on December 28, 2005, 02:12:17 AM
And civil unions are a joke.
Would you accept the state declaring state involvement in marriage a violation of the establishment clause? So civil unions all around?
No
I don't want to change the entire concept of marriage, I just want to include same-sex couples. Polygamy and other forms would still be off limits. This debate is about including gays into the mainstream of society, and changing gov't involvement just avoids that question.
Title: Re: Gay marriage map
Post by: Bleeding heart conservative, HTMLdon on December 28, 2005, 02:35:12 AM
Tennessee will have the ban on the ballot this year.
Banning gay marriage is fine. The problem are the resolutions that ban civil unions or any other form of recognized partnerships as well.
Banning gay marriage is fine. The problem are the resolutions that ban civil unions or any other form of recognized partnerships as well.
No its not fine, people's lives are destroyed.
WTF? How can people's lives be "destroyed" by not having gay marriage. We dont' currently have gay marriage in the state of Tennessee, so I really don't understand how banning a change the status quo changes anything.
Connecticut legalized them this year and less than 300 have been done, in a state with 3.5 million people. They are "separate but equal" (equal to the rights of marriage but separate in name) and not worth the effort.
So let me see if I understand your point:
You don't want the legal protections and civil rights that come with marriage -- you just want to steal the religious tradition called "marriage". Interesting. That really screws up those of us who argue that gays deserve the rights of hospital visitation, insurance sharing, etc. You don't want equality, you just want to take something that isn't yours.
Those thousands of marriages in California and Oregon last year took place b/c people thought they were getting a meaningful contract, not a poll-tested compromise.
Civil unions are not a poll-tested compromise, they extend the civil rights that come with marriage to gay and lesbian couples.
Title: Re: Gay marriage map
Post by: Dan on December 28, 2005, 07:41:28 AM
Quote from: TakeOurCountryBack
Thankfully most of the Northeast is good, tolerant people.
No, they just haven't voted on it yet, states in the northeast lack initiative rights.
Title: Re: Gay marriage map
Post by: A18 on December 28, 2005, 11:25:34 AM
I don't want to change the entire concept of marriage, I just want to include same-sex couples. Polygamy and other forms would still be off limits. This debate is about including gays into the mainstream of society, and changing gov't involvement just avoids that question.
Why should gays be included, but not incestuous couples?
More importantly, why should government decide what should or should not be "mainstream?" You are apparently a fascist.
Title: Re: Gay marriage map
Post by: MODU on December 28, 2005, 11:47:33 AM
I don't want to change the entire concept of marriage, I just want to include same-sex couples. Polygamy and other forms would still be off limits. This debate is about including gays into the mainstream of society, and changing gov't involvement just avoids that question.
Why should gays be included, but not incestuous couples?
More importantly, why should government decide what should or should not be "mainstream?" You are apparently a fascist.
Last time I checked, gays were in the mainstream of society. Of course, so are poker players, drug dealers, and school kids.
Title: Re: Gay marriage map
Post by: Emsworth on December 28, 2005, 11:52:02 AM
Would you accept the state declaring state involvement in marriage a violation of the establishment clause?
Quote
So civil unions all around?
Better than having civil unions for everyone, the government should simply separate itself completely from the institution of marriage. The government give official recognition to "marriages," "civil unions," or anything else. Instead, the institution should be completely private. I don't want to change the entire concept of marriage, I just want to include same-sex couples. Polygamy and other forms would still be off limits.
Title: Re: Gay marriage map
Post by: TexasPatriot2024 on December 28, 2005, 11:39:38 PM
Travis County voted 59.94%-40.05% (81,170 to 54,246) against the Texas gay marriage amendment (only county to do so).
The amendment passed 76.25%-23.75% statewide (1,723,782 to 536,913)
Amusingly, if you remove Travis County from the results, the percentage would increase to 78.56%-21.44% statewide.
The amendment passed 76.25%-23.75% statewide (1,723,782 to 536,913)
Amusingly, if you remove Travis County from the results, the percentage would increase to 78.56%-21.44% statewide.
Similarly - and also amusing - if you remove Travis county from Texas the state's average IQ drops from 87 to 59! :)
Opebo have you ever been to Texas? I can smell the ignorance from here, you reek of it.
Title: Re: Gay marriage map
Post by: Flying Dog on December 29, 2005, 06:06:03 PM
I believe in michigan it was 59-41
Title: Re: Gay marriage map
Post by: Schmitz in 1972 on December 29, 2005, 08:39:39 PM
I was stunned when the ban passed in Oregon. I was sure they would reject it and then follow the lead of MA. So gay marriage has never been rejected in a popular vote. Dare we conclude that this might mean something?
Title: Re: Gay marriage map
Post by: Swing low, sweet chariot. Comin' for to carry me home. on December 29, 2005, 10:51:00 PM
Travis County voted 59.94%-40.05% (81,170 to 54,246) against the Texas gay marriage amendment (only county to do so).
The amendment passed 76.25%-23.75% statewide (1,723,782 to 536,913)
Amusingly, if you remove Travis County from the results, the percentage would increase to 78.56%-21.44% statewide.
The amendment passed 76.25%-23.75% statewide (1,723,782 to 536,913)
Amusingly, if you remove Travis County from the results, the percentage would increase to 78.56%-21.44% statewide.
Similarly - and also amusing - if you remove Travis county from Texas the state's average IQ drops from 87 to 59! :)
Travis county also has the highest STD rates in Texas.
Title: Re: Gay marriage map
Post by: Joe Republic on December 29, 2005, 11:09:12 PM
Athens County was the only one to vote against the amendment here last year. Not too surprising. And people still talk about Cuyahoga being the most socially liberal....
()
Green = Yes
Red = No
()
Green = Yes
Red = No
Title: Re: Gay marriage map
Post by: MasterJedi on December 30, 2005, 09:22:44 AM
Now we just need to spread that around the country. I suspect gay marraige would be banned in most states, New England would be the places I'd look for it to pass though.
Title: Re: Gay marriage map
Post by: Frodo on December 30, 2005, 09:24:22 AM
Now we just need to spread that around the country. I suspect gay marraige would be banned in most states, New England would be the places I'd look for it to pass though.
And Hawai'i.
Title: Re: Gay marriage map
Post by: MasterJedi on December 30, 2005, 09:29:20 AM
Now we just need to spread that around the country. I suspect gay marraige would be banned in most states, New England would be the places I'd look for it to pass though.
And Hawai'i.
That's also a possibility but I believe it will be passed there as well though by a much reduced margin.
Title: Re: Gay marriage map
Post by: MODU on December 30, 2005, 09:36:20 AM
Now we just need to spread that around the country. I suspect gay marraige would be banned in most states, New England would be the places I'd look for it to pass though.
And Hawai'i.
That's also a possibility but I believe it will be passed there as well though by a much reduced margin.
I remember when Hawaii passed their legislation to allow gay marriage, and then turned right around and cancelled it. hehehe . . . gotta love states that can't make up their mind. :)
Title: Re: Gay marriage map
Post by: opebo on December 30, 2005, 09:38:38 AM
Travis County voted 59.94%-40.05% (81,170 to 54,246) against the Texas gay marriage amendment (only county to do so).
The amendment passed 76.25%-23.75% statewide (1,723,782 to 536,913)
Amusingly, if you remove Travis County from the results, the percentage would increase to 78.56%-21.44% statewide.
The amendment passed 76.25%-23.75% statewide (1,723,782 to 536,913)
Amusingly, if you remove Travis County from the results, the percentage would increase to 78.56%-21.44% statewide.
Similarly - and also amusing - if you remove Travis county from Texas the state's average IQ drops from 87 to 59! :)
Travis county also has the highest STD rates in Texas.
Sounds like a fun place, jmfcst. Young people having sex - I like it!
Title: Re: Gay marriage map
Post by: Gustaf on December 30, 2005, 10:57:11 AM
They do have the same rights. Each member of each has the right to marry someone of the opposite sex.
How about incestuous couples?
How about incestuous couples?
I think this is one of the worse arguments ever thought up for anything.
Title: Re: Gay marriage map
Post by: A18 on December 30, 2005, 11:15:25 AM
Then I'm sorry your reasoning skills are so poor.
Title: Re: Gay marriage map
Post by: A18 on December 30, 2005, 04:59:57 PM
They should. I was simply pointing out his hypocrisy.
Title: Re: Gay marriage map
Post by: Alcon on December 30, 2005, 05:01:15 PM
They should. I was simply pointing out his hypocrisy.
What hypocrisy? You were complaining about his argument.
Title: Re: Gay marriage map
Post by: A18 on December 30, 2005, 06:00:28 PM
What hypocrisy?
He refuses to endorse incestuous marriage, while whining about "equal rights" for homosexual couples.
Quote
You were complaining about his argument.
What are you talking about?
Title: Re: Gay marriage map
Post by: Alcon on December 30, 2005, 06:28:29 PM
What hypocrisy?
He refuses to endorse incestuous marriage, while whining about "equal rights" for homosexual couples.
Quote
You were complaining about his argument.
What are you talking about?
Oh, somehow I managed to read only the first sentence of your post and missed the question about incestuous couples. I'm a moron. Sorry.
Title: Re: Gay marriage map
Post by: Starbucks Union Thug HokeyPuck on December 31, 2005, 12:31:14 PM
And why shouldn't incestuous couples be allowed to get married?
really, really, screwed up kids. no one should have to live with somehting like your parents being brother and sister
Title: Re: Gay marriage map
Post by: A18 on December 31, 2005, 07:05:28 PM
And why shouldn't incestuous couples be allowed to get married?
really, really, screwed up kids. no one should have to live with somehting like your parents being brother and sister
Why? Not all couples have kids anyway.
Title: Re: Gay marriage map
Post by: ?????????? on January 01, 2006, 09:28:40 AM
And why shouldn't incestuous couples be allowed to get married?
really, really, screwed up kids. no one should have to live with somehting like your parents being brother and sister
That's your subjective preference. See..Opebo logic works well!
Title: Re: Gay marriage map
Post by: bgwah on February 17, 2007, 12:14:02 AM
Updated w/ 2006 elections
Title: Re: Gay marriage map
Post by: nclib on February 17, 2007, 07:39:26 PM
updated 2/16
This is a map of all the states that have voted on gay marriage. Blue=ban.
()
These counties are the biggest homo-lovers
77% Charlottesville, VA
74% Arlington, VA
71% San Miguel, CO
70% Alexandria, VA
70% Pitkin, CO
69% Richmond City, VA
67% Dane, WI
66% Blaine, ID
65% Petersburg, VA
65% Clay, SD
65% Shannon, SD
65% Boulder, CO
This is a map of all the states that have voted on gay marriage. Blue=ban.
()
These counties are the biggest homo-lovers
77% Charlottesville, VA
74% Arlington, VA
71% San Miguel, CO
70% Alexandria, VA
70% Pitkin, CO
69% Richmond City, VA
67% Dane, WI
66% Blaine, ID
65% Petersburg, VA
65% Clay, SD
65% Shannon, SD
65% Boulder, CO
Most gay-friendly county in each state:
Arizona - Coconino (Flagstaff) 60%
Arkansas - Pulaski (Little Rock) 35%
Colorado - San Miguel (Telluride) 71%
Georgia - Clarke (Athens, U. of Georgia) 48%
Idaho - Blaine 66%
Kansas - Douglas (Lawrence, U. Of Kansas) 63%
Kentucky - Fayette (Lexington, U. of Kentucky) 43%
Louisiana - Orleans (New Orleans) 45%
Michigan - Washtenaw (Ann Arbor, U. of Mich.) 59%
Mississippi - Tunica 27%
Missouri - St. Louis City 53%
Montana - Missoula (U. of Montana) 49%
Nevada - Washoe (Reno) 37% the first time, 40% the second time
North Dakota - Grand Forks (U. of N.D.) 38%
Ohio - Athens (Ohio U.) 56%
Oklahoma - Cleveland (Norman, U. of Okla.) 31%
Oregon - Multnomah (Portland) 60%
South Carolina- Charleston 35%
South Dakota - Clay (U. of S.D) 65%
Tennessee - Davidson (Nashville) 32%
Texas - Travis (Austin, U of Texas) 60%
Utah - Summit (Park City) 61%
Virginia - Charlottesville (U. of Virginia) 77%
Wisconsin - Dane (Madison, U of Wisc.) 67%
Title: Re: Gay marriage map
Post by: they don't love you like i love you on February 17, 2007, 08:47:25 PM
Grand Forks is home to UND, where my brother goes.
Title: Re: Gay marriage map
Post by: RBH on February 17, 2007, 09:22:07 PM
Louisiana amendment map
() (https://uselectionatlas.org/RESULTS/state.php?year=2004&off=50&elect=7&fips=22&f=0)
The Amendment only passed 55/45 in Orleans Parish.
() (https://uselectionatlas.org/RESULTS/state.php?year=2004&off=50&elect=7&fips=22&f=0)
The Amendment only passed 55/45 in Orleans Parish.
Title: Re: Gay marriage map
Post by: angus on February 17, 2007, 10:06:26 PM
77% Charlottesville, VA
74% Arlington, VA
71% San Miguel, CO
70% Alexandria, VA
70% Pitkin, CO
69% Richmond City, VA
67% Dane, WI
66% Blaine, ID
65% Petersburg, VA
65% Clay, SD
65% Shannon, SD
65% Boulder, CO
five out of ten are in virginia. no surprise there, given the ubiquitous bumper stickers. I haven't read the thread, so someone may have beaten me to the punch, but in case they haven't, you do know what the official Virginia tourism board motto says I assume.
Title: Re: Gay marriage map
Post by: nclib on February 17, 2007, 10:08:48 PM
Most gay-friendly county in each state:
Arizona - Coconino (Flagstaff) 60%
Arkansas - Pulaski (Little Rock) 35%
Colorado - San Miguel (Telluride) 71%
Georgia - Clarke (Athens, U. of Georgia) 48%
Idaho - Blaine 66%
Kansas - Douglas (Lawrence, U. of Kansas) 63%
Kentucky - Fayette (Lexington, U. of Kentucky) 43%
Louisiana - Orleans (New Orleans) 45%
Michigan - Washtenaw (Ann Arbor, U. of Mich.) 59%
Mississippi - Tunica 27%
Missouri - St. Louis City 53%
Montana - Missoula (U. of Montana) 49%
Nevada - Washoe (Reno) 37% the first time, 40% the second time
North Dakota - Grand Forks (U. of N.D.) 38%
Ohio - Athens (Ohio U.) 56%
Oklahoma - Cleveland (Norman, U. of Okla.) 31%
Oregon - Multnomah (Portland) 60%
South Carolina- Charleston 35%
South Dakota - Clay (U. of S.D.) 65%
Tennessee - Davidson (Nashville) 32%
Texas - Travis (Austin, U of Texas) 60%
Utah - Summit (Park City) 61%
Virginia - Charlottesville (U. of Virginia) 77%
Wisconsin - Dane (Madison, U of Wisc.) 67%
Looks like University towns were the most supportive in 12/24 states.
In only 3 states was the largest county the most supportive.
Title: Re: Gay marriage map
Post by: nclib on February 17, 2007, 10:12:28 PM
77% Charlottesville, VA
74% Arlington, VA
71% San Miguel, CO
70% Alexandria, VA
70% Pitkin, CO
69% Richmond City, VA
67% Dane, WI
66% Blaine, ID
65% Petersburg, VA
65% Clay, SD
65% Shannon, SD
65% Boulder, CO
five out of ten are in virginia. no surprise there, given the ubiquitous bumper stickers. I haven't read the thread, so someone may have beaten me to the punch, but in case they haven't, you do know what the official Virginia tourism board motto says I assume.
Virginia has independent cities, which explains why the ind. cities are more liberal because they don't have rural areas mixed in with them to form a county.
Title: Re: Gay marriage map
Post by: Undisguised Sockpuppet on February 17, 2007, 10:21:09 PM
We'll see civil unions on a large scale by the late 2010s and gay marriage by the 2030s.
Title: Re: Gay marriage map
Post by: angus on February 17, 2007, 10:25:19 PM
77% Charlottesville, VA
74% Arlington, VA
71% San Miguel, CO
70% Alexandria, VA
70% Pitkin, CO
69% Richmond City, VA
67% Dane, WI
66% Blaine, ID
65% Petersburg, VA
65% Clay, SD
65% Shannon, SD
65% Boulder, CO
five out of ten are in virginia. no surprise there, given the ubiquitous bumper stickers. I haven't read the thread, so someone may have beaten me to the punch, but in case they haven't, you do know what the official Virginia tourism board motto says I assume.
Virginia has independent cities, which explains why the ind. cities are more liberal because they don't have rural areas mixed in with them to form a county.
ah, yeah, that's why their election maps always have little dots of one color surrounded by counties of a different color on most election maps. actually, I'd forgotten that.
Still, I couldn't resist: Virginia is for Lovers. :)
Title: Re: Gay marriage map
Post by: RRB on February 17, 2007, 11:27:10 PM
Voting for a gay marriage ban gets rid of all of those pesky gay people and sets the agenda for good values, now doesn't it. That's right, no more gay people fighting for rights. Now these states can all go back to the good old days when gay people didn't exist. Right!!!
Gay marriage bans are an insult to the brains of those who have one, and a Godsend to those whose head is deep in the sand.
Government needs to get it's business out of people's bedrooms, and start legislating with its pants on.
Gay marriage bans are an insult to the brains of those who have one, and a Godsend to those whose head is deep in the sand.
Government needs to get it's business out of people's bedrooms, and start legislating with its pants on.
Title: Re: Gay marriage map
Post by: RBH on February 18, 2007, 08:21:30 PM
() (https://uselectionatlas.org/RESULTS/state.php?year=2005&off=50&elect=7&fips=20&f=0)
Douglas County votes no by a 63/37 margin while the amendment passes 70/30
Douglas County votes no by a 63/37 margin while the amendment passes 70/30
Title: Re: Gay marriage map
Post by: nclib on February 22, 2007, 07:22:58 PM
updated 2/16
This is a map of all the states that have voted on gay marriage. Blue=ban.
()
This is a map of all the states that have voted on gay marriage. Blue=ban.
()
Have any of the gray states had statewide referenda on any other gay rights issue. If so, does anyone have maps or results?
I think Maine has had anti-workplace discrimination in a referendum, but I forget the year.
Title: Re: Gay marriage map
Post by: angus on February 23, 2007, 11:08:40 AM
Now, ten years after China decriminalized homosexuality and six years after officials removed it from a state list of mental disorders, gay men and lesbians say one of their biggest obstacles is parental pressure to get married.
exerpt from today's Washington post. I know it seems a bit off-topic, but I just found it interesting and thought you might as well, nclib. Read the article here (http://www.washingtonpost.com/wp-dyn/content/article/2007/02/22/AR2007022201899.html?sub=AR).
exerpt from today's Washington post. I know it seems a bit off-topic, but I just found it interesting and thought you might as well, nclib. Read the article here (http://www.washingtonpost.com/wp-dyn/content/article/2007/02/22/AR2007022201899.html?sub=AR).
Title: Re: Gay marriage map
Post by: Small Business Owner of Any Repute on February 23, 2007, 11:40:12 AM
Quote
Have any of the gray states had statewide referenda on any other gay rights issue. If so, does anyone have maps or results?
I think Maine has had anti-workplace discrimination in a referendum, but I forget the year.
I think Maine has had anti-workplace discrimination in a referendum, but I forget the year.
The year was 2005, and Maine voters chose to uphold the anti-discrimination law. From the Maine SoS:
Question 1: PEOPLES VETO
Do you want to reject the new law that would protect people from discrimination in employment, housing, education, public accommodations and credit based on their sexual orientation?
Number of Votes in Favor 181,926 (44.9%)
Number of Votes Opposed 223,274 (55.1%)
Title: Re: Gay marriage map
Post by: nclib on February 23, 2007, 06:21:42 PM
Quote
Have any of the gray states had statewide referenda on any other gay rights issue. If so, does anyone have maps or results?
I think Maine has had anti-workplace discrimination in a referendum, but I forget the year.
I think Maine has had anti-workplace discrimination in a referendum, but I forget the year.
The year was 2005, and Maine voters chose to uphold the anti-discrimination law. From the Maine SoS:
Question 1: PEOPLE’S VETO
Do you want to reject the new law that would protect people from discrimination in employment, housing, education, public accommodations and credit based on their sexual orientation?
Number of Votes in Favor 181,926 (44.9%)
Number of Votes Opposed 223,274 (55.1%)
So the pro-gay rights side won?
Do you have a link to the results?
Title: Re: Gay marriage map
Post by: Alcon on February 23, 2007, 06:25:04 PM
http://www.maine.gov/sos/cec/elec/2005/ref05.htm
Question 1 here.
Question 1 here.
Title: Re: Gay marriage map
Post by: Alcon on February 23, 2007, 06:39:20 PM
The map (https://uselectionatlas.org/RESULTS/state.php?year=2005&off=50&elect=0&fips=23&f=0):
()
Green counties voted to repeal the anti-discrimination law; red ones kept it.
Range was 35% (Cumberland) to 60% (Aroostook).
Interestingly, French Canadians seemed to have narrowly voted yes.
()
Green counties voted to repeal the anti-discrimination law; red ones kept it.
Range was 35% (Cumberland) to 60% (Aroostook).
Interestingly, French Canadians seemed to have narrowly voted yes.
Title: Re: Gay marriage map
Post by: Gabu on February 23, 2007, 06:40:51 PM
Question 1: PEOPLES VETO
Do you want to reject the new law that would protect people from discrimination in employment, housing, education, public accommodations and credit based on their sexual orientation?
Number of Votes in Favor 181,926 (44.9%)
Number of Votes Opposed 223,274 (55.1%)
Do you want to reject the new law that would protect people from discrimination in employment, housing, education, public accommodations and credit based on their sexual orientation?
Number of Votes in Favor 181,926 (44.9%)
Number of Votes Opposed 223,274 (55.1%)
Asking people whether or not they're opposed to rejection? Even I'd probably be slightly confused by that one.
Title: Re: Gay marriage map
Post by: nclib on February 23, 2007, 06:48:09 PM
Alcon,
Have any other states had any statewide referenda on any gay rights issue other than marriage?
Have any other states had any statewide referenda on any gay rights issue other than marriage?
Title: Re: Gay marriage map
Post by: J.G.H. on February 23, 2007, 07:17:33 PM
In 2006, while approving a gay marriage ban 55-45, Colorado also rejected an initiative to provide for domestic parnerships, 48-52.
See http://www.sos.state.co.us/pubs/electionresults2006G/ (http://www.sos.state.co.us/pubs/electionresults2006G/)
and http://www.state.co.us/gov_dir/leg_dir/lcsstaff/bluebook/Bluebook2006.htm (http://www.state.co.us/gov_dir/leg_dir/lcsstaff/bluebook/Bluebook2006.htm)
See http://www.sos.state.co.us/pubs/electionresults2006G/ (http://www.sos.state.co.us/pubs/electionresults2006G/)
and http://www.state.co.us/gov_dir/leg_dir/lcsstaff/bluebook/Bluebook2006.htm (http://www.state.co.us/gov_dir/leg_dir/lcsstaff/bluebook/Bluebook2006.htm)
Title: Re: Gay marriage map
Post by: Alcon on February 23, 2007, 07:55:37 PM
Alcon,
Have any other states had any statewide referenda on any gay rights issue other than marriage?
Have any other states had any statewide referenda on any gay rights issue other than marriage?
I'll be uploading some more maps related to the homosexual conspiracy this afternoon. It's one of my favourite issues to track.
Title: Re: Gay marriage map
Post by: Alcon on February 23, 2007, 08:16:47 PM
2006: Colorado narrowly rejects domestic partnerships
()
Data here (https://uselectionatlas.org/RESULTS/state.php?year=2006&off=50&elect=0&fips=8&f=0)
Gains versus Bush performance
Costilla +103.6% (67%)
Conejos +52.8% (59%)
Las Animas +40.7% (41%)
Pueblo +38.5% (38%)
Otero +23.4% (38%)
I think everyone can pretty much figure out what the second number I gave was, and why this measure failed.
On the other hand...
Losses versus Bush performance
Pitkin -21.6%
Summit -17.0%
Eagle -16.3%
Douglas -13.6%
Routt -8.9%
I doubt I need to explain that either.
Title: Re: Gay marriage map
Post by: Alcon on February 23, 2007, 08:31:42 PM
2006: Colorado passes gay marriage ban
()
Data here (https://uselectionatlas.org/RESULTS/state.php?year=2006&off=60&elect=0&fips=8&f=0)
Worst performances versus Bush
Jackson -27.7
Rio Blanco -12.0%
Kiowa -8.5%
Routt -8.2%
Custer -7.7%
Best performances versus Bush
Costilla +97.5%
Conejos +56.1%
Las Animas +43.4%
Pueblo +43.2%
Denver +28.6%
If anyone can explain to me why Jackson County voted like this:
President - 76% Bush
Domestic partnerships - 76% no
Gay marriage ban - 55% yes
...I'd be interested in hearing it.
Title: Re: Gay marriage map
Post by: Alcon on February 23, 2007, 08:49:06 PM
This is kind of neat: the user-made Colorado maps are on the first page for a Google result for Colorado election results (http://www.google.com/search?hl=en&safe=off&client=firefox-a&rls=org.mozilla%3Aen-GB%3Aofficial&hs=fE6&q=colorado+election+results&btnG=Search).
Anyway...
2000: Oregon narrowly avoids banning ballroom dancing classes, or whatever a ban on encouraging homosexuality in public schools would do
()
Data here (https://uselectionatlas.org/RESULTS/state.php?year=2000&off=60&elect=0&fips=41&f=0). An interesting examination of how attitudes about homosexuality aren't entirely partisan line, and how the inland west isn't nearly as conservative Christian as many people assume based on its Republicanness.
Title: Re: Gay marriage map
Post by: Alcon on February 23, 2007, 08:59:58 PM
Oregon: Difference between Measure 9 performance and 2000 Bush performance
Grant -19.2%
Wallowa -18.9%
Sherman -16.3%
Gilliam -15.6%
Union -14.5%
Harney -12.9%
Lake -12.2%
Benton -11.6%
Baker -9.8%
Malheur -7.6%
Klamath -7.4%
Wheeler -6.8%
Deschutes -5.6%
Morrow -5.5%
Washington -5.0%
Umatilla -4.4%
Jackson -3.6%
Polk -1.0%
Douglas -0.3%
Yamhill -0.2%
Crook +0.5%
Jefferson +0.5%
Curry +2.0%
Coos +2.0%
Wasco +2.1%
Marion +2.3%
Clackamas +2.7%
Josephine +2.9%
Linn +3.2%
Clatsop +4.7%
Lane +4.8%
Tillamook +6.2%
Hood River +6.6%
Lincoln +7.2%
Multnomah +16.2%
Columbia +21.7%
Columbia County makes sense - it's a working-class area with socially conservative, economically liberal leans. What's interesting is that this measure performed relatively better in areas that hardly seem to have those sort of leans (liberal Multnomah, liberal touristy Lincoln and Hood River) - the only explanation I can offer there is old-school, elderly Democrats (especially in Lincoln) and Hispanics (Hood River). And the measures tend to perform relatively better than Dems in ultra-liberal areas and relatively worse than Republicans in ultra-conservative ones.
What really surprised me is how poorly it performed in the Columbia River counties, which have a Democratic union(?) tradition. They were solidly Republican by 2000. Another thing that I just can't explain.
Title: Re: Gay marriage map
Post by: Filuwaúrdjan on February 23, 2007, 09:10:21 PM
How come Coos county was that close?
Btw, could you explain the patterns in this map?
()
Btw, could you explain the patterns in this map?
()
Title: Re: Gay marriage map
Post by: Colin on February 23, 2007, 09:15:14 PM
How come Coos county was that close?
Btw, could you explain the patterns in this map?
()
Btw, could you explain the patterns in this map?
()
What map is that anyway?
Title: Re: Gay marriage map
Post by: Alcon on February 23, 2007, 09:16:34 PM
How come Coos county was that close?
Coos has a solid economically liberal union base, but it's not socially conservative. The socially conservative union base has since become Republican. It's a moderate county. It's pretty much a standard 55% Republican, 45% Democratic county at this point. It's lost the interestingness that came from being a union county.
Btw, could you explain the patterns in this map?
()
()
I might be able to, if I knew what it was a map of. :P
Title: Re: Gay marriage map
Post by: Filuwaúrdjan on February 23, 2007, 09:17:24 PM
Referendum on exempting death sentences from protections to do with cruel and vindictive punishment.
Title: Re: Gay marriage map
Post by: Alcon on February 23, 2007, 09:19:29 PM
Referendum on exempting death sentences from protections to do with cruel and vindictive punishment.
Ohhh, I remember talking to Bob about this.
No - I have NO idea. It's among the weirdest maps I've ever seen. Malheur County is literally the last county in Oregon I would have expected to vote no. The single most confusing election result I've ever seen.
Title: Re: Gay marriage map
Post by: Rob on February 23, 2007, 09:29:54 PM
1992's infamous Measure 9 (http://en.wikipedia.org/wiki/Oregon_Ballot_Measure_9_(1992)):
()
Would have amended the state Constitution to read:
All governments in Oregon may not use their monies or properties to promote, encourage or facilitate homosexuality, pedophilia, sadism or masochism. All levels of government, including public education systems, must assist in setting a standard for Oregon's youth which recognizes that these behaviors are abnormal, wrong, unnatural and perverse and they are to be discouraged and avoided.
It lost 56-44.
Title: Re: Gay marriage map
Post by: Alcon on February 23, 2007, 09:32:14 PM
Bob, two quick questions:
1. Where did you get those county results? (I can do a quick data upload so we can see sexy percentages and stuff)
2. Anything you can tell me about why the Columbia River counties are so Republican if they aren't exactly fully right-winged on either social or economic issues? More of an institiutional Republican shift, kind of like in Coos County?
I don't know much about them, but in my summer driving tour (after which I'll have been to every county in the state except for San Juan), I'll be right across the stateline. It doesn't seem to share much in common with our side of the River.
Title: Re: Gay marriage map
Post by: Rob on February 23, 2007, 09:37:18 PM
Where did you get those county results? (I can do a quick data upload so we can see sexy percentages and stuff)
From a print source. I don't have access to the data at the moment. :(
Anything you can tell me about why the Columbia River counties are so Republican if they aren't exactly fully right-winged on either social or economic issues?
Environmental issues probably play a big role.
Title: Re: Gay marriage map
Post by: Alcon on February 23, 2007, 10:02:42 PM
Environmental issues probably play a big role.
Hmm, interesting. Logging areas? I've always wondered if areas that are hyper-Republican due to anti-environmentalism (like Forks, WA) are also very socially conservative. I guess it isn't necessarily so.
Title: Re: Gay marriage map
Post by: nclib on March 22, 2007, 04:36:37 PM
Looks like about half the states have had a statewide referendum on gay marriage. I made a list earlier this thread about the most gay friendly county in each state. Does anyone want to take a stab at guessing for the other states, what would be each state's best county for opposing gay marriage bans?
Title: Re: Gay marriage map
Post by: Alcon on March 22, 2007, 05:05:21 PM
Looks like about half the states have had a statewide referendum on gay marriage. I made a list earlier this thread about the most gay friendly county in each state. Does anyone want to take a stab at guessing for the other states, what would be each state's best county for opposing gay marriage bans?
My guesses:
AL: Who knows...probably one of the Kerry counties, though, if MS is an indicator
CT: New Haven, maybe? Hartford?
DE: New Castle
FL: Broward?
IA: Johnson?
IL: Cook, obviously
IN: Monroe
ME: Cumberland
MA: Berkshire
MN: Ramsey
NE: Already voted in 2000, and Douglas
NH: Probably Cheshire
NJ: Essex, maybe Hudson
NM: Taos, maybe Santa Fe
NC: Durham?
PA: Philadelphia
RI: Providence
VT: Windham
WA: San Juan
WV: No real idea
WY: Teton, obviously
Title: Re: Gay marriage map
Post by: nclib on March 22, 2007, 05:18:37 PM
Looks like about half the states have had a statewide referendum on gay marriage. I made a list earlier this thread about the most gay friendly county in each state. Does anyone want to take a stab at guessing for the other states, what would be each state's best county for opposing gay marriage bans?
I missed that. Do you have a link to the results or map?
Title: Re: Gay marriage map
Post by: Alcon on March 22, 2007, 05:25:17 PM
Looks like about half the states have had a statewide referendum on gay marriage. I made a list earlier this thread about the most gay friendly county in each state. Does anyone want to take a stab at guessing for the other states, what would be each state's best county for opposing gay marriage bans?
I missed that. Do you have a link to the results or map?
https://uselectionatlas.org/RESULTS/state.php?year=2000&off=61&elect=0&fips=31&f=0
It was later overturned.
Title: Re: Gay marriage map
Post by: nclib on July 15, 2007, 06:46:02 PM
I compared the results of these bans with the results of the Kerry/Bush election. I calculated the difference between ban support and Bush support, using large counties (over 100,000 votes in the 2004 Pres. election). I've broken it down by state:
Ban - Bush
Virginia
Prince Wm. Bush 9
Fairfax Kerry 0
Loudoun Bush -2
Va. Beach Bush -2
Henrico Bush -3
Chesterfield Bush -3
Louisiana
Orleans Kerry 33
Caddo Bush 30
E. Baton Rouge Bush 20
Jefferson Bush 11
St. Tammany Bush 2
Nevada
Clark Kerry 21
Washoe Bush 9
Wisconsin
Milwaukee Kerry 18
Racine Bush 12
Brown Bush 7
Waukesha Bush 1
Dane Kerry 0
Missouri
City of St. Louis Kerry 28
St. Louis County Kerry 21
Jackson Kerry 19.5
St. Charles Bush 13
Greene Bush 10
Nebraska
Lancaster Bush 5
Douglas Bush 1
California
Los Angeles Kerry 23
Solano Kerry 23
San Mateo Kerry 22
Alameda Kerry 21
Contra Costa Kerry 20
San Joaquin Bush 20
San Bernardino Bush 19.5
Santa Clara Kerry 19
Fresno Bush 19
Monterey Kerry 18
San Francisco Kerry 17
Santa Cruz Kerry 16
Sonoma Kerry 16
Stanislaus Bush 16
Riverside Bush 15
Kern Bush 14
Sacramento Kerry 13
Ventura Bush 13
Marin Kerry 12
Santa Barbara Kerry 12
San Diego Bush 10.5
San Luis Obispo Bush 9
Orange Bush 9
Placer Bush 6
Colorado
Adams Kerry 13
Denver Kerry 9
Arapahoe Bush 5
Jefferson Bush 3
Boulder Kerry 1
Larimer Bush 0
El Paso Bush -1
Douglas Bush -5
Tennessee
Shelby Kerry 38
Davidson Kerry 23
Hamilton Bush 23
Knox Bush 9
Oklahoma
Oklahoma Bush 7
Tulsa Bush 7
Texas
Hidalgo Kerry 37
Fort Bend Bush 26
El Paso Kerry 25
Nueces Bush 18
Harris Bush 17
Galveston Bush 17
Dallas Bush 16
Tarrant Bush 15
Bexar Bush 14
Montgomery Bush 8
Williamson Bush 5
Denton Bush 5
Collin Bush 3
Travis Kerry -2
Ohio
Mahoning Kerry 26
Trumbull Kerry 24
Cuyahoga Kerry 20
Lucas Kerry 18
Lorain Kerry 16
Summit Kerry 15
Stark Kerry 15
Montgomery Kerry 9
Franklin Kerry 7
Lake Bush 7
Hamilton Bush 3
Butler Bush 2
Idaho
Ada Bush -9
Oregon
Multnomah Kerry 13
Lane Kerry 10
Clackamas Bush 10
Marion Bush 10
Washington Kerry 8
Jackson Bush 7
Utah
Utah Bush -4
Salt Lake Bush -6
Davis Bush -8
Michigan
Wayne Kerry 25
Genesee Kerry 19
Saginaw Kerry 13
Macomb Bush 11
Washtenaw Kerry 6
Ingham Kerry 6
Kalamazoo Kerry 6
Kent Bush 4
Oakland Kerry 3
Ottawa Bush 1
Arizona
Pima Kerry -5
Maricopa Bush -9
Kansas
Sedgwick Bush 8
Johnson Bush -1
Note: Mississippi, Montana, and the Dakotas don't have any counties with over 100,000 votes. Also, I don't have the maps for Arkansas, Kentucky, Georgia, and South Carolina.
Title: Re: Gay marriage map
Post by: nclib on May 21, 2008, 07:38:20 PM
Bump for comparison to the Democratic primary results. It appears the vast majority of counties that voted against a ban on gay marriage, are voting for Obama.
Title: Re: Gay marriage map
Post by: nclib on February 26, 2009, 11:13:12 PM
bump
It looks like Obama picked a lot of the pro-gay counties that voted for Bush:
Maricopa, AZ - McCain
Ouray, CO - Obama
Latah, ID - Obama
Bennett, SD - McCain
Brookings, SD - Obama
Custer, SD - McCain
Fall River, SD - McCain
Hughes, SD - McCain
Kingsbury, SD - McCain
Lawrence, SD - McCain
Lyman, SD - McCain
Marshall, SD - Obama
Stanley, SD - McCain
Grand, UT - Obama
Summit, UT - Obama
-------
Can anyone explain those SD counties?
Title: Re: Gay marriage map
Post by: ○∙◄☻¥tπ[╪AV┼cVê└ on February 26, 2009, 11:50:49 PM
Gap between no and Obama in California. Smaller gaps seemed to be in low population counties, where the megachurches aren't so active. The Mormons in Mono like gay marriage.
Imperial 32.0
Merced 24.2
San Joaquin 20.0
Solano 19.4
Los Angeles 19.3
Fresno 19.0
San Bernardino 18.6
Stanislaus 17.8
Alameda 16.8
Tulare 16.6
Monterey 16.6
Madera 15.9
Kings 15.8
Kern 15.5
San Benito 15.3
Riverside 15.0
Santa Clara 13.7
Contra Costa 12.6
Sacramento 12.4
San Mateo 11.7
Colusa 11.6
Sutter 11.2
Lake 10.2
Napa 9.6
Tehama 9.5
Yuba 9.1
San Francisco 9.0
Yolo 8.4
Ventura 8.2
San Diego 8.0
Sonoma 7.2
Trinity 7.0
Santa Barbara 6.8
Glenn 6.5
Mendocino 6.4
Santa Cruz 6.2
Butte 6.0
Shasta 5.7
Amador 5.6
Del Norte 5.5
Orange 5.4
Calaveras 5.3
Tuolumne 5.1
Alpine 4.6
Mariposa 4.6
Inyo 4.5
Modoc 4.0
Siskiyou 3.3
Placer 3.2
Marin 2.9
Lassen 2.8
Plumas 2.8
San Luis Obispo 2.5
Humboldt 2.2
El Dorado 2.0
Nevada 1.6
Sierra 1.6
Mono -0.2
Title: Re: Gay marriage map
Post by: Alcon on February 27, 2009, 01:50:09 AM
South Dakota's (like Arizona's) banned domestic partnerships and civil unions. Those kind of bans just aren't really viable outside of conservative states anymore.
Title: Re: Gay marriage map
Post by: Associate Justice PiT on February 27, 2009, 04:31:10 AM
South Dakota's (like Arizona's) banned domestic partnerships and civil unions. Those kind of bans just aren't really viable outside of conservative states anymore.
Explains how it failed in so many McCain counties in South Dakota.
Title: Re: Gay marriage map
Post by: nclib on April 26, 2009, 09:47:34 PM
Gap between Obama and 'no' in Florida
Gadsden 43.57%
Madison 31.94%
Osceola 27.24%
Hamilton 26.20%
Jefferson 24.98%
Hendry 24.89%
Glades 20.29%
St. Lucie 20.13%
DeSoto 20.03%
Jackson 19.80%
Orange 19.25%
Broward 19.08%
Hardee 18.83%
Polk 18.51%
Duval 17.25%
Highlands 17.04%
Leon 16.76%
Okeechobee 16.62%
Putnam 15.60%
Miami-Dade 15.52%
Taylor 14.87%
Marion 13.91%
Hernando 13.87%
Flagler 13.62%
Volusia 13.38%
Calhoun 12.95%
Escambia 12.69%
Lake 12.64%
Palm Beach 12.63%
Levy 12.28%
Hillsborough 12.18%
Bradford 11.86%
Suwannee 11.41%
Washington 11.17%
Alachua 11.17%
Charlotte 11.15%
Union 10.99%
Gulf 10.74%
Dixie 10.22%
Liberty 10.02%
Pasco 9.52%
Sumter 9.47%
Lee 8.97%
Citrus 8.90%
Seminole 8.47%
Wakulla 7.83%
Columbia 7.71%
Baker 7.64%
Pinellas 7.64%
Manatee 7.62%
Brevard 7.62%
Indian River 7.56%
Franklin 7.54%
Lafayette 7.43%
Gilchrist 7.24%
Holmes 6.17%
Sarasota 5.99%
Martin 5.91%
Bay 3.99%
Clay 3.10%
Nassau 3.03%
Okaloosa 1.84%
Walton 1.61%
Santa Rosa 1.37%
Collier 1.07%
Monroe -0.31%
St. Johns -1.22%
-------
Pretty expected, though surprised to see some panhandle counties towards the bottom.
Title: Re: Gay marriage map
Post by: bgwah on August 19, 2009, 05:37:05 AM
Tried updating the map with the latest numbers... Am I missing anything?
()
()
Title: Re: Gay marriage map
Post by: RI on August 19, 2009, 10:23:25 AM
Tried updating the map with the latest numbers... Am I missing anything?
()
()
Yes, Alabama (https://uselectionatlas.org/RESULTS/state.php?fips=1&year=2006&f=0&off=50&elect=7).
Title: Re: Gay marriage map
Post by: Hash on August 19, 2009, 04:41:17 PM
()
Title: Re: Gay marriage map
Post by: Torie on August 19, 2009, 09:32:13 PM
65% Shannon, SD
Who would have guessed that the Sioux are gay friendly? Is the gay gene out of control there, or what? :)
Who would have guessed that the Sioux are gay friendly? Is the gay gene out of control there, or what? :)
Title: Re: Gay marriage map
Post by: nclib on September 02, 2012, 04:10:07 PM
bump for recent analysis/predictions
My county (Orange, NC) may now be at the top of this list:
My county (Orange, NC) may now be at the top of this list:
These counties are the biggest homo-lovers
77% Charlottesville, VA
74% Arlington, VA
71% San Miguel, CO
70% Alexandria, VA
70% Pitkin, CO
69% Richmond City, VA
67% Dane, WI
66% Blaine, ID
65% Petersburg, VA
65% Clay, SD
65% Shannon, SD
65% Boulder, CO
77% Charlottesville, VA
74% Arlington, VA
71% San Miguel, CO
70% Alexandria, VA
70% Pitkin, CO
69% Richmond City, VA
67% Dane, WI
66% Blaine, ID
65% Petersburg, VA
65% Clay, SD
65% Shannon, SD
65% Boulder, CO
Title: Re: Gay marriage map
Post by: Free Palestine on September 02, 2012, 08:30:11 PM
That map sure doesn't help make America look like it's not a right-wing hellhole.
Title: Re: Gay marriage map
Post by: danny on September 02, 2012, 08:53:03 PM
Tried updating the map with the latest numbers... Am I missing anything?
()
()
Maine question 1 (2009).
Title: Re: Gay marriage map
Post by: World politics is up Schmitt creek on September 02, 2012, 10:16:01 PM
Tried updating the map with the latest numbers... Am I missing anything?
()
()
Maine question 1 (2009).
Also North Carolina.
Title: Re: Gay marriage map
Post by: morgieb on September 02, 2012, 11:27:28 PM
Tried updating the map with the latest numbers... Am I missing anything?
()
()
Maine question 1 (2009).
Also North Carolina.
That post was from 2009.
When will a gay marriage referendum succeed?
Title: Re: Gay marriage map
Post by: MaxQue on September 03, 2012, 12:02:35 AM
Tried updating the map with the latest numbers... Am I missing anything?
()
()
Maine question 1 (2009).
Also North Carolina.
That post was from 2009.
When will a gay marriage referendum succeed?
Didn't something passed in Washington?
Title: Re: Gay marriage map
Post by: Alcon on September 03, 2012, 04:47:12 AM
Arizona rejected an unusually draconian ban in 2006.
In 2009, Washington State passed a referendum that gave gay domestic partnerships all the civil rights of straight marriages.
In 2009, Washington State passed a referendum that gave gay domestic partnerships all the civil rights of straight marriages.
Title: Re: Gay marriage map
Post by: greenforest32 on September 03, 2012, 10:05:43 PM
bump for recent analysis/predictions
I've given this some thought after following the polling thread.
I think this is what the map is going to look like after this year's elections (counting the most recent vote in each state) though I'm not too sure about Minnesota:
()
I think North Carolina's ban would have slipped below 60% had the measure been on the November general election ballot instead of the May primary.
Looking forward, a federal constitutional ban is dead even if it makes it out of Congress as the following 20 state legislatures won't ratify such an amendment in 2013 and on:
()
The focus would then shift to getting a majority of the states to legalize gay marriage (lawsuits in New Mexico and Pennsylvania are probably coming) if the Supreme Court doesn't want to overturn the state bans until a majority of the states have already done so. Not every state is going to have a public vote (they shouldn't in the first place but maybe you could argue it would be a good thing in a situation like New Jersey circa 2012) and some will never get the chance to undo their state amendments. I think the public votes we'll see in the near future, say 4-6 years, will be these:
()
Legalization initiatives in Oregon, Nevada, and Colorado (maybe Arizona too) and the state legislature referring a ban in Indiana and possibly Wyoming. I used to think the Republicans in Pennsylvania would follow Indiana as both states require constitutional amendments to pass in two sessions before being referred to the ballot but that didn't happen:
http://en.wikipedia.org/wiki/Recognition_of_same-sex_unions_in_Indiana#Constitutional_Amendment_Proposals
Quote
Since 2004, there has been an effort every year to push forward for a constitutional amendment to ban same-sex marriage in Indiana.
As of 2011, there was a proposal for another amendment. The proposal passed in the house 70-26 and in the senate 40-10.[5][6]
As of 2011, there was a proposal for another amendment. The proposal passed in the house 70-26 and in the senate 40-10.[5][6]
http://en.wikipedia.org/wiki/Recognition_of_same-sex_unions_in_Pennsylvania#2011
Quote
In 2011, House Bill 1434 was introduced by Pennsylvania State Representative Daryl Metcalfe with 36 cosponsors on May 3, 2011.[1] It was referred to the Committee of State Government. The bill would amend the state constitutional stating to ban same-sex marriage and any substantial equivalent.[14] On March 13, 2012, a committee vote on the bill was stopped.[4]
While the gerrymanders in IN and PA most likely mean continued Republican majorities, I get the impression the Pennsylvania initiative is dead because by the time they refer it to the ballot (2014 at the earliest?), public support will be even higher. I could be wrong though and I'm not sure why they killed the ban in committee.
West Virginia is kind of a weird waiting game. I think the state legislature would refer a constitutional ban if the state supreme court overturned the statutory ban but otherwise I expect WV Democrats would hold off on doing anything. A lawsuit here would probably not be a good idea compared to Pennsylvania or New Mexico. If WV Republicans really wanted to troll, they could be the ones to sue :P
Title: Re: Gay marriage map
Post by: Holmes on September 04, 2012, 07:49:35 AM
Supreme Court Justices in West Virginia are elected, are they not?
Title: Re: Gay marriage map
Post by: bgwah on September 04, 2012, 11:12:21 AM
I didn't "miss" those states, as that post is several years old. :P
But here's an updated version:
()
Now you can point out any missed votes. ;)
But here's an updated version:
()
Now you can point out any missed votes. ;)
Title: Re: Gay marriage map
Post by: bgwah on September 04, 2012, 11:24:19 AM
Arizona rejected an unusually draconian ban in 2006.
A less draconian measure passed in 2008, IIRC. The map reflects the most recent vote.
bump for recent analysis/predictions
My county (Orange, NC) may now be at the top of this list:
My county (Orange, NC) may now be at the top of this list:
These counties are the biggest homo-lovers
77% Charlottesville, VA
74% Arlington, VA
71% San Miguel, CO
70% Alexandria, VA
70% Pitkin, CO
69% Richmond City, VA
67% Dane, WI
66% Blaine, ID
65% Petersburg, VA
65% Clay, SD
65% Shannon, SD
65% Boulder, CO
77% Charlottesville, VA
74% Arlington, VA
71% San Miguel, CO
70% Alexandria, VA
70% Pitkin, CO
69% Richmond City, VA
67% Dane, WI
66% Blaine, ID
65% Petersburg, VA
65% Clay, SD
65% Shannon, SD
65% Boulder, CO
That seems possible. Orange was 78.94%, while San Francisco was only 75.19%.
Title: Re: Gay marriage map
Post by: Starbucks Union Thug HokeyPuck on September 05, 2012, 05:10:47 PM
Based on just straight support/oppose gay marriage and ignoring any measures, statutes, or propositions, I'd think it looks a lot like this.
Green- for
Red - against
(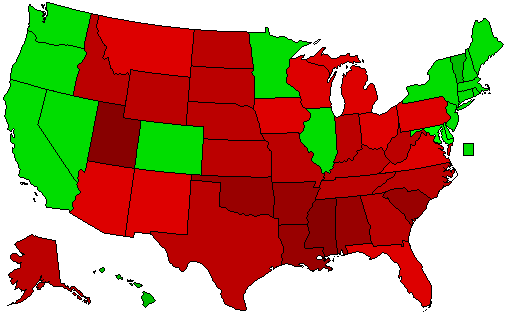 )
)
Delaware and Maryland I think are right at a 50/50, given green because that's the direction they are almost certainly moving.
Green- for
Red - against
(
Delaware and Maryland I think are right at a 50/50, given green because that's the direction they are almost certainly moving.
Title: Re: Gay marriage map
Post by: Lief 🗽 on September 05, 2012, 06:31:37 PM
Based on just straight support/oppose gay marriage and ignoring any measures, statutes, or propositions, I'd think it looks a lot like this.
Green- for
Red - against
()
Delaware and Maryland I think are right at a 50/50, given green because that's the direction they are almost certainly moving.
Green- for
Red - against
(
Delaware and Maryland I think are right at a 50/50, given green because that's the direction they are almost certainly moving.
For gay marriage is tied or ahead nationally, so it would definitely be ahead in more states than that.
Title: Re: Gay marriage map
Post by: nclib on November 14, 2012, 11:07:52 PM
bump
4/4 At least the anti-gay crowd will no longer be able to use the states' referenda always being anti-gay, as an excuse.
Five best counties by state:
Maine
Cumberland 65% - Portland
York 57%
Hancock 56%
Knox 55.1%
Sagadahoc 54.8%
Maryland
Montgomery 65%
Howard 59%
Baltimore City 57%
Anne Arundel 52%
Baltimore County 51%
Minnesota (blanks also included in totals)
Hennepin 64%-35% - Minneapolis
Ramsey 62%-36% - St. Paul
Cook 59%-40%
St. Louis 54.8%-44.1% - Duluth
Dakota 54.3%-44.6%
Washington
San Juan 71%
King 67% - Seattle
Jefferson 63%
Thurston 56%
Whatcom 54%
Title: Re: Gay marriage map
Post by: Lief 🗽 on November 15, 2012, 01:58:14 AM
()
That looks a little better. :)
That looks a little better. :)
Title: Re: Gay marriage map
Post by: Gass3268 on November 15, 2012, 02:09:14 AM
This was in the Marquette University Poll the last week of the campaign:
Q27
Which comes closes to your view? Gay couples should be allowed to legally marry? Or, Gay
couples should be allowed to form civil unions but not legally marry? Or, There should be no
legal recognition of a gay couples relationship.
N %
Allowed to legally marry 547 44%
Civil unions 360 29%
No legal recognition 278 22%
Don't know (v) 44 4%
Refused (v) 14 1%
This has been consistant throughout all of Marquette's polling during the presidential campaign
Title: Re: Gay marriage map
Post by: Skill and Chance on November 15, 2012, 04:03:34 PM
()
That looks a little better. :)
That looks a little better. :)
Really surprised about WV.
Title: Re: Gay marriage map
Post by: morgieb on November 15, 2012, 04:43:20 PM
()
That looks a little better. :)
That looks a little better. :)
Really surprised about WV.
Title: Re: Gay marriage map
Post by: nclib on November 16, 2012, 09:45:55 PM
Minnesota by CD:
Yes % (from pro-gay to anti-gay):
MN-5: 28.55%
MN-4: 38.19%
MN-3: 43.32%
MN-2: 45.95%
MN-6: 53.40%
MN-8: 54.42%
MN-1: 54.92%
MN-7: 63.53%
Maine by CD:
(Yes %, again from pro-gay to anti-gay, though yes is pro-gay here):
ME-1: 59.03%
ME-2: 45.43%
Anyone want to guess at Maryland or Washington (or another state)?
Title: Re: Gay marriage map
Post by: Marokai Backbeat on November 16, 2012, 10:58:06 PM
Really surprised about WV.
tbf it is controlled by Democrats.
Don't expect that to last much longer.
Title: Re: Gay marriage map
Post by: Frodo on November 16, 2012, 11:09:00 PM
()
That looks a little better. :)
That looks a little better. :)
How come New England isn't more red? I thought the one state still holding out against gay marriage was Rhode Island.
Title: Re: Gay marriage map
Post by: nclib on November 16, 2012, 11:23:24 PM
()
That looks a little better. :)
That looks a little better. :)
How come New England isn't more red? I thought the one state still holding out against gay marriage was Rhode Island.
The map only includes states that have had a statewide referendum.
Title: Re: Gay marriage map
Post by: Alcon on November 16, 2012, 11:54:50 PM
()
That looks a little better. :)
That looks a little better. :)
How come New England isn't more red? I thought the one state still holding out against gay marriage was Rhode Island.
Voting results, not legal status. The Northeast doesn't do many public referendums
Title: Re: Gay marriage map
Post by: Skill and Chance on November 17, 2012, 12:05:51 AM
Guess on MD without exact numbers, from most pro-gay to most anti-gay and with ranked Obama 2008 performance:
MD-08: Yes (could be 60%), 4th
MD-07: Yes, 2nd
MD-03: Yes, 5th
MD-06: Likely Yes, 7th
MD-04: Lean No, 1st
MD-02: Lean No, 6th
MD-05: Likely No, 3rd
MD-01: No, 8th
I'm most unsure about MD-04. Both counties narrowly passed it, but the most socially liberal parts are in other districts. It passed in 2 Romney counties and failed in 2 Obama counties. The business conservatives apparently voted for gay marriage, like we saw in NC-09 back in May.
Title: Re: Gay marriage map
Post by: nclib on November 17, 2012, 06:17:11 PM
Maryland Presidential Margin vs. Gay Marriage (from Obama/anti-gay to Romney/pro-gay):
Prince George's 40.66%
Balt City 30.68%
Charles 20.10%
Somerset 15.25%
Dorchester 8.98%
Wicomico 7.72%
Balt Co 6.56%
Montgomery 6.38%
Washington 2.40%
Howard 1.86%
Caroline 1.27%
Kent 0.76%
Calvert 0.47%
Allegany -0.28%
Worcester -1.18%
St. Mary's -1.65%
Anne Arundel -2.55%
Frederick -2.57%
Garrett -2.65%
Harford -3.66%
Cecil -3.99%
Talbot -4.36%
Queen Anne's -8.82%
Carroll -10.28%
The top four are the only ones that are > 40% black. Can anyone explain Carroll and Queen Anne's?
Title: Re: Gay marriage map
Post by: Ebowed on November 17, 2012, 06:45:36 PM
Carroll is the most Republican county in the state, I believe Romney got over 75% there. It is not surprising that support for marriage equality would be higher than Obama's dismal performance.
Title: Re: Gay marriage map
Post by: nclib on November 18, 2012, 10:17:46 PM
Carroll is the most Republican county in the state, I believe Romney got over 75% there. It is not surprising that support for marriage equality would be higher than Obama's dismal performance.
Carroll is actually only 65% Romney; Garrett is the most GOP, though hyper-Republican areas do often outperform on gay marriage compared to the Dems.
Title: Re: Gay marriage map
Post by: they don't love you like i love you on November 19, 2012, 02:29:25 PM
Carroll is Baltimore exurbs. Exactly the type of places where gay marriage always overperforms Democrats now.