Title: Map of Best GOP Performance vs Best Dem Performance in each state since 2000
Post by: OSR stands with Israel on October 07, 2019, 02:59:44 AM
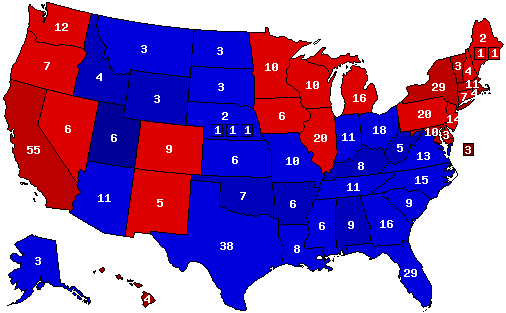
If you compare the result of the best Republican performance in each state since 2000 vs Best Dem performance in each state this is how the map would look like:
( )
)
Dems 272
GOP 266
If you go by margin IA, CO, and ME-2 are super close but the Democrats narrowly win the states to get over the 270 mark
(
Dems 272
GOP 266
If you go by margin IA, CO, and ME-2 are super close but the Democrats narrowly win the states to get over the 270 mark
Title: Re: Map of Best GOP Performance vs Best Dem Performance in each state since 2000
Post by: OSR stands with Israel on October 07, 2019, 03:01:10 AM
So Lol OC's Dem 272 Firewall theory from 2016 holds true here
Title: Re: Map of Best GOP Performance vs Best Dem Performance in each state since 2000
Post by: Gustaf on October 07, 2019, 08:45:47 AM
Is this best result in % terms?
Title: Re: Map of Best GOP Performance vs Best Dem Performance in each state since 2000
Post by: OSR stands with Israel on October 07, 2019, 10:14:09 AM
Is this best result in % terms?
Both actually
Title: Re: Map of Best GOP Performance vs Best Dem Performance in each state since 2000
Post by: Skye on October 07, 2019, 11:46:29 AM
TBF, the best Dem performance was D+7.3 while the best GOP one was R+2.4.
Title: Re: Map of Best GOP Performance vs Best Dem Performance in each state since 2000
Post by: Vosem on October 07, 2019, 02:25:47 PM
This is 2008 but adjusted to a national popular vote tie (or polling over the summer in 2008, when Obama led McCain by 1-2 in the PV and had converted those four states -- CO/IA/NM, usually also NV -- from the Bush 2004 coalition). Makes sense.
Title: Re: Map of Best GOP Performance vs Best Dem Performance in each state since 2000
Post by: Beefalow and the Consumer on October 09, 2019, 06:19:13 AM
()
Title: Re: Map of Best GOP Performance vs Best Dem Performance in each state since 2000
Post by: One Term Floridian on October 11, 2019, 10:03:45 AM
The only state that could conceivably flip in this map next year is VA, and it should