Title: Fivethirtyeight.com's performances
Post by: Antonio the Sixth on March 25, 2009, 08:55:07 AM
During the presidential campaign, I consulted this site frequently to follow the trend of the election and I think it's one of the most reliable websites.
But, over that, I think it's more interesting to see fivethirtyeight's margin of error by state ( those where it had a democratic leaning, those where it had a republican one ), and try to explain why.
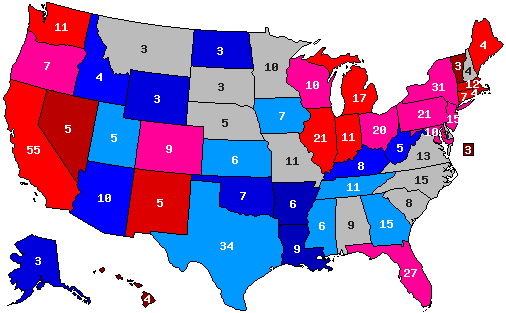
So, here is my map of the 2008 presidential election results compared with the fivethirtyeight's latest prediction ( November 4, afternoon ). Red states are those where Obama got a better margin of victory than expected, Blue are those where he got a worse one. The legend is as following :
- Grey : within 1%
- Between 1% and 2,5%
- Between 2,5% and 5%
- Between 5% and 7,5%
- Between 7,5% and 10%
- More than 10%
( )
)
So what does this map show us ? First, FTE's prediction were quite correct, because for only 12 states he was wrong by more than 5 points. Now, I've the impression that FTE underestimated Obama in the states where he won, and overestimated him in those where he lost ( that's rigth for every state excepted Iowa ), maybe due to an excessive ponderation of the polls. Moreover, if you except this fact, I think that FTE's margin of error corresponds to 2004-2008 trends : we can see that in states like Arkansas, Louisiana or Vermont. So, maybe FTE gives too much importance to past elections for its projections.
What do you think about it ?
But, over that, I think it's more interesting to see fivethirtyeight's margin of error by state ( those where it had a democratic leaning, those where it had a republican one ), and try to explain why.
So, here is my map of the 2008 presidential election results compared with the fivethirtyeight's latest prediction ( November 4, afternoon ). Red states are those where Obama got a better margin of victory than expected, Blue are those where he got a worse one. The legend is as following :
- Grey : within 1%
- Between 1% and 2,5%
- Between 2,5% and 5%
- Between 5% and 7,5%
- Between 7,5% and 10%
- More than 10%
(
So what does this map show us ? First, FTE's prediction were quite correct, because for only 12 states he was wrong by more than 5 points. Now, I've the impression that FTE underestimated Obama in the states where he won, and overestimated him in those where he lost ( that's rigth for every state excepted Iowa ), maybe due to an excessive ponderation of the polls. Moreover, if you except this fact, I think that FTE's margin of error corresponds to 2004-2008 trends : we can see that in states like Arkansas, Louisiana or Vermont. So, maybe FTE gives too much importance to past elections for its projections.
What do you think about it ?
Title: Re: Fivethirtyeight.com's performances
Post by: Landslide Lyndon on March 25, 2009, 11:32:28 AM
I love Nate.
Plus, his feuds with Zogby, Drudge and Ziegler are epic.
Plus, his feuds with Zogby, Drudge and Ziegler are epic.
Title: Re: Fivethirtyeight.com's performances
Post by: Sbane on March 25, 2009, 07:57:00 PM
I think he understated the trends that happened/relied too much on old elections. Still he was as accurate as anybody out there.
Title: Re: Fivethirtyeight.com's performances
Post by: Husker on March 25, 2009, 10:44:20 PM
I thought they were pretty good. The states he underestimated Obama in were generally states that had an urban population or a significant liberal rural population (i.e., Vermont). Plus 538 was about the only site I saw after early summer that gave any of NE's CD's a shot for Obama. Many of us here knew it was a realistic possibility but very few outside the state did.
Title: Re: Fivethirtyeight.com's performances
Post by: pbrower2a on March 27, 2009, 03:54:55 PM
The 2008 election was never a stable situation. Those who followed the polling trends saw states like Michigan and North Carolina make wild swings during the summer. By September (immediately after the Republican National Convention) the Presidential nominees were about even in popular votes even though Obama had a huge structural advantage -- a bunch of states, nearly enough to win with a bunch of states in easy reach for Obama.
Poll results were unstable because situations were changing. Places that seemed to get close got the attention of McCain (not too bad) and Palin (dreadful). States that the GOP thought vulnerable (like Michigan, Wisconsin, New Hampshire, and Iowa) suddenly went out of reach. So McCain/Palin went after the states that were close but had to be won -- like Colorado, Virginia, Ohio, and Florida. Palin got overexposed in Colorado and Virginia, and that likely ensured an Obama victory.
In the end, one thing that was certain but whose timing wasn't -- the economic meltdown -- created an electoral disaster. Most people thought New Mexico and Nevada would be close, and they weren't.
Title: Re: Fivethirtyeight.com's performances
Post by: minionofmidas on March 27, 2009, 03:58:09 PM
The most reliable, but not very reliable. :)
Title: Re: Fivethirtyeight.com's performances
Post by: Antonio the Sixth on March 28, 2009, 04:42:23 AM
The 2008 election was never a stable situation. Those who followed the polling trends saw states like Michigan and North Carolina make wild swings during the summer. By September (immediately after the Republican National Convention) the Presidential nominees were about even in popular votes even though Obama had a huge structural advantage -- a bunch of states, nearly enough to win with a bunch of states in easy reach for Obama.
Poll results were unstable because situations were changing. Places that seemed to get close got the attention of McCain (not too bad) and Palin (dreadful). States that the GOP thought vulnerable (like Michigan, Wisconsin, New Hampshire, and Iowa) suddenly went out of reach. So McCain/Palin went after the states that were close but had to be won -- like Colorado, Virginia, Ohio, and Florida. Palin got overexposed in Colorado and Virginia, and that likely ensured an Obama victory.
In the end, one thing that was certain but whose timing wasn't -- the economic meltdown -- created an electoral disaster. Most people thought New Mexico and Nevada would be close, and they weren't.
Poll results were unstable because situations were changing. Places that seemed to get close got the attention of McCain (not too bad) and Palin (dreadful). States that the GOP thought vulnerable (like Michigan, Wisconsin, New Hampshire, and Iowa) suddenly went out of reach. So McCain/Palin went after the states that were close but had to be won -- like Colorado, Virginia, Ohio, and Florida. Palin got overexposed in Colorado and Virginia, and that likely ensured an Obama victory.
In the end, one thing that was certain but whose timing wasn't -- the economic meltdown -- created an electoral disaster. Most people thought New Mexico and Nevada would be close, and they weren't.
You're right but, as I already said, I used FTE's latest projection, who was done november 4 afternoon, so it should have considered facts that you mentionned. Actually, he did it quite good, but that's anyways interesting to see where it under/overestimated Obama.
Title: Re: Fivethirtyeight.com's performances
Post by: muon2 on March 28, 2009, 07:10:39 AM
So what does this map show us ? First, FTE's prediction were quite correct, because for only 12 states he was wrong by more than 5 points. Now, I've the impression that FTE underestimated Obama in the states where he won, and overestimated him in those where he lost ( that's rigth for every state excepted Iowa ), maybe due to an excessive ponderation of the polls. Moreover, if you except this fact, I think that FTE's margin of error corresponds to 2004-2008 trends : we can see that in states like Arkansas, Louisiana or Vermont. So, maybe FTE gives too much importance to past elections for its projections.
What do you think about it ?
What do you think about it ?
I think your observation may be pointing to some of the statistical nature of a poll of polls. I think 538 had a solid, predictable method to their projections. However, even as 538 was prone to note the systematic leaning of some of their component polls, they also may have succumbed to some systematics.
As you note, the 538 projections tended too much toward the middle. This might be due to their averaging techniques, and this would be an interesting statistical study. A second factor may be the failure to identify undecideds and soft decideds as breaking more towards their state's eventual result than towards an even split.
Title: Re: Fivethirtyeight.com's performances
Post by: Antonio the Sixth on November 03, 2010, 08:54:49 AM
Bump. Expect the 2010 Senate edit of 538.com's performances as soon as we have certified results everywhere.
Title: Re: Fivethirtyeight.com's performances
Post by: minionofmidas on November 03, 2010, 01:06:45 PM
Senate performance was pretty good, I think. House was dreadful until quite late - that model needs some work.
Title: Re: Fivethirtyeight.com's performances
Post by: Antonio the Sixth on November 04, 2010, 12:55:50 PM
Quote from: your imaginary friend whose posts happen to be visible on November 03, 2010, 01:06:45 PM
Senate performance was pretty good, I think. House was dreadful until quite late - that model needs some work.
Yeah, indeed. He gave me a fake hope that democrats could retain the House or lose it quite honorably... :(
The gubernatorial performance was somewhat erratic too (look at South Carolina, Illinois, Minnesota, Maine, Connecticut or RI), but this is mostly due to pollster's errors.
Title: Re: Fivethirtyeight.com's performances
Post by: Antonio the Sixth on November 06, 2010, 03:43:52 PM
Also, funny to look at its old projections to see how the races evolved.
For example, his december 2009 old model (http://www.fivethirtyeight.com/2009/12/senate-rankings-decemeber-2009-edition.html), in which he basically predicts that GOP would take DE, CT and NV and that dems would take MO : he proved to be 100% wrong ! ;D Of course, the 3 rep non-gains were all due to a "candidate effect" : Dodd was expected to run (and lose), and nobody knew who were Sharron Angle and Christine O'Donnel. Also, the general pic moving toward republicans easily explains Missouri.
Now let's look at his first elaborate model on Jan 22 (http://www.fivethirtyeight.com/2010/01/senate-rankings-post-masspocalypse.html). It had democrats losing 7 seats : ND (99% odds), AR (73%), NV (73%), PA (72%), CO (70%), DE (66%) and IL (51%). However, it expected Giannoulias to win in Illinois. It also gave Bayh 63% chances to hold IN and Feingold 84% to hold WI (:(). On average, it gave dems 54.7 seats, but that was only because of the high uncertainty.
Mar 10 : (http://www.fivethirtyeight.com/2010/03/senate-race-rankings-update-310.html) Democrats lose ND (100%), DE (93%), AR (87%), IN (77%), NV (69%), CO (55%) and PA (51%). IL had 67% chances to go dem and WI 78%. 54.9 dem seats in average.
July 18 (http://www.fivethirtyeight.com/2010/07/senate-forecast-718-republican-outlook.html) still had dems losing 7 seats : ND (100%), AR (100%), IN (95%), CO (73%), DE (64%), PA (62%) and NV (58%). Dem odds were 51% in IL and 74% in WI. Dem seats were expected to be 53.4.
All "old" Senate forecasts can be found here (http://www.fivethirtyeight.com/search/label/senate%20rankings).
Also, here is something that makes more sense. It's the retrospective projection made by 538.com, NY Times version. They re-calculated what would have been their projections using their ultimate model since February 2010. Here are their month-by month projections, starting with Feb 1st and ending at Oct 7. The most important thing is that those projections are based on actual candidates : that means you can see how evolved the Delaware race between Coons and O'Donnel since February. The shades go from tossup (lightest) to safe (darkest). Grey States are those for which predictions were not yet available at the time.
() (https://uselectionatlas.org/FORUM/index.php?action=gallery;sa=view;id=3492)
And here is the final projection, still available on the website :
() (https://uselectionatlas.org/FORUM/index.php?action=gallery;sa=view;id=3493)
As you can see, Nevada and PA were clearly overconfident, but you can blame Mr Rasmussen for that.
Title: Re: Fivethirtyeight.com's performances
Post by: nclib on November 06, 2010, 05:19:39 PM
I voted 'very reliable'. Most are pretty close.
Here are the underdogs according to their model, that won:
House Dems
McNerney, CA-11 31.9%
Murphy, CT-5 40.2%
Bishop, GA-2 40.5%
Schrader, OR-5 43.0%
Owens, NY-23 43.7%
Costa, CA-20 46.4%
Kissell, NC-8 46.6%
GOP
Buerkle, NY-25 6.8%
Grimm, NY-13 10.4%
Walsh, IL-8 11.8%
Farenthold, TX-27 23.4%
Cravaack, MN-8 26.5%
Dold, IL-10 31.6%
Gibbs, OH-18 35.5%
Labrador, ID-1 38.7%
Griffith, VA-9 38.9%
Hanna, NY-24 39.7%
Bass, NH-2 45.4%
Johnson, OH-6 49.4%
Senate
Reid, NV 16.6%
Murkowski, AK 21.0%
Bennet, CO 34.9%
Governor
Quinn, IL 18.3%
Title: Re: Fivethirtyeight.com's performances
Post by: Antonio the Sixth on November 07, 2010, 05:57:47 AM
Governor
(Emmer, MN) 11.5%
Quinn, IL 18.3%
(Dubie, VT) 20.2%
(Emmer, MN) 11.5%
Quinn, IL 18.3%
(Dubie, VT) 20.2%
Emmer and Dubie both trail in the final count. While Emmer has some (very small) chances if he asks for a recount, Shumlin beat Dubie by 1.5 points and will be chosen by the legislature.
Quote
As you can see, Nevada and PA were clearly overconfident, but you can blame Mr Rasmussen for that.
No, you can't.
37% of the database was made of Rasmussen polls. Without them, the races would have appeared far closer.
Title: Re: Fivethirtyeight.com's performances
Post by: Fuzzybigfoot on November 27, 2010, 12:47:07 AM
Although I got the margins wrong, I'm a little surprised my Senate Outcome Model was more accurate than his. The only state he got correct and that I got wrong was Illinois.
I don't blame him much. He couldn't adjust the polls too much for probable bias (without being accused of personal bias himself), and he didn't do too poorly.
I don't blame him much. He couldn't adjust the polls too much for probable bias (without being accused of personal bias himself), and he didn't do too poorly.
Title: Re: Fivethirtyeight.com's performances
Post by: Mr. Morden on November 27, 2010, 04:39:41 PM
I'd be curious to see an analysis that looks at his probabilities for each race going one way or the other, and compares them to the actual outcomes. For example, you take the races where he says the Democrat has a probability of victory of between 20% and 30%. What %age of those races does the Democrat actually win? Is it somewhere between 20% and 30%? You could do that for various time steps, how does he do one month out, three months out, six months out, etc?
Because really, that's the test of whether his probabilities mean anything. If events that he rates as having a 30% probability don't actually happen 30% of the time, then he's doing something wrong.
Because really, that's the test of whether his probabilities mean anything. If events that he rates as having a 30% probability don't actually happen 30% of the time, then he's doing something wrong.
Title: Re: Fivethirtyeight.com's performances
Post by: Antonio the Sixth on November 27, 2010, 05:30:09 PM
You know what ? You're right. ;) I'm doing that immediately.
Let's see for Senate :
States with >90% chances to go dem : 9/9 = 100%
States within 75% and 90% chances to go dem : 2/2 = 100%
States within 60% and 75% chances to go dem : none
States within 50% and 60% chances to go dem : none
States within 50% and 60% chances to go rep : none
States within 60% and 75% chances to go rep : 1/3 = 33%
States within 75% and 90% chances to go rep : 0/1 = 0%
States with >90% chances to go rep : 22/22 = 100%
Then for governors :
States with >90% chances to go dem : 6/6 = 100%
States within 75% and 90% chances to go dem : 5/5 = 100%
States within 60% and 75% chances to go dem : 1/1 = 100%
States within 50% and 60% chances to go dem : none
States within 50% and 60% chances to go rep : 1/1 = 100%
States within 60% and 75% chances to go rep : 1/1 = 100%
States within 75% and 90% chances to go rep : 0/1 = 0%
States with >90% chances to go rep : 21/21 = 100%
If you add them up (to have a bigger sample) :
States with >90% chances to go dem : 15/15 = 100%
States within 75% and 90% chances to go dem : 7/7 = 100%
States within 60% and 75% chances to go dem : 1/1 = 100%
States within 50% and 60% chances to go dem : none
States within 50% and 60% chances to go rep : 1/1 = 100%
States within 60% and 75% chances to go rep : 2/4 = 50%
States within 75% and 90% chances to go rep : 0/2 = 0%
States with >90% chances to go rep : 43/43 = 100%
Funny to see how republicans won in only one third of races where they were favored with 60% to 90% odds.
Title: Re: Fivethirtyeight.com's performances
Post by: Mr. Morden on November 27, 2010, 06:10:49 PM
Cool. If you like, you can also fold together the cases for both parties, and look at how many times the guy who was favored with X % chance of winning won, regardless of party.
So:
Favorites who were given a 50-75% chance of winning won: 4 out of 6 times, or 67% of the time
Favorites who were given a 75-90% chance of winning won: 7 out of 9 times, or 78% of the time
Favorites who were given a 90-100% chance of winning won: 58 out of 58 times, or 100% of the time
Of course, that's from his last update before the election. It'd be more interesting to look at his projections from many months out, when not so many of the races are going to be in the 90-100% range.
Title: Re: Fivethirtyeight.com's performances
Post by: Antonio the Sixth on November 28, 2010, 04:46:31 AM
Favorites who were given a 50-75% chance of winning won: 4 out of 6 times, or 67% of the time
Favorites who were given a 75-90% chance of winning won: 7 out of 9 times, or 78% of the time
Favorites who were given a 90-100% chance of winning won: 58 out of 58 times, or 100% of the time
Favorites who were given a 75-90% chance of winning won: 7 out of 9 times, or 78% of the time
Favorites who were given a 90-100% chance of winning won: 58 out of 58 times, or 100% of the time
You're right, those numbers look far more consistent. As for previous models, it's a pretty harder work to do, even though something can be done with the Senate maps I've made.
Title: Re: Fivethirtyeight.com's performances
Post by: Antonio the Sixth on January 16, 2011, 02:07:50 PM
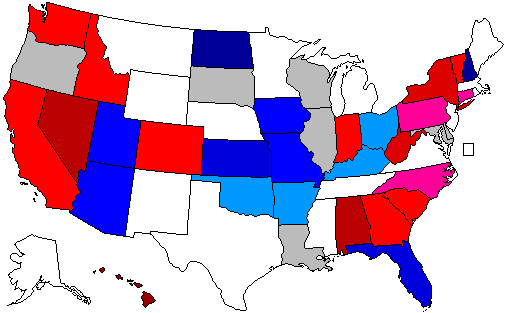
Since the official rsults have now been published everywhere except in Alaska, here is the map showing 538.com's performance for Senatorial races.
( )
)
The map indicates which party overperformed and by how many points. Grey means the difference between the forecast and the actual results is inferior to 1%. The 30% shade means between 1 and 2.5%, then between 2.5-5, 5-7.5, 7.5-10, and finally over 10%.
A little comparison with 2008 is interesting :
A first conclusion is that 538 performed far worse this time. In 2008, more than half of the States (27/51) were guessed with an error of less than 2.5%, and only a quarter (12/51) were off by more than 5 points. For 2010 Senate elections, less than three fifths (14/36) were in the first case, and over one third (10/36) in the second (not counting Alaska). Are Senate elecitons inherently harder to polls, or were polls particularly poor in this cycle ?
Another interesting thing is that the pattern looks a lot more random this time. Of course, democrats seem to have overperformed more often in democratic States and republicans in republican States, but there are huge exceptions like Alabama or New Hampshire. Last but not the least, there is an important similarity between the two maps : all seem to bie slightly biased against democrats (ie dems did better than expected). It's certainly something to note, though two electoral cycles are not sufficient to draw a conclusion.
PS : For the analysis of gubernatorial races, I'm waiting to get the official result from Maine, Tennessee, Texas and Iowa, which still lack them for some reason.
(
The map indicates which party overperformed and by how many points. Grey means the difference between the forecast and the actual results is inferior to 1%. The 30% shade means between 1 and 2.5%, then between 2.5-5, 5-7.5, 7.5-10, and finally over 10%.
A little comparison with 2008 is interesting :
A first conclusion is that 538 performed far worse this time. In 2008, more than half of the States (27/51) were guessed with an error of less than 2.5%, and only a quarter (12/51) were off by more than 5 points. For 2010 Senate elections, less than three fifths (14/36) were in the first case, and over one third (10/36) in the second (not counting Alaska). Are Senate elecitons inherently harder to polls, or were polls particularly poor in this cycle ?
Another interesting thing is that the pattern looks a lot more random this time. Of course, democrats seem to have overperformed more often in democratic States and republicans in republican States, but there are huge exceptions like Alabama or New Hampshire. Last but not the least, there is an important similarity between the two maps : all seem to bie slightly biased against democrats (ie dems did better than expected). It's certainly something to note, though two electoral cycles are not sufficient to draw a conclusion.
PS : For the analysis of gubernatorial races, I'm waiting to get the official result from Maine, Tennessee, Texas and Iowa, which still lack them for some reason.
Title: Re: Fivethirtyeight.com's performances
Post by: Antonio the Sixth on January 18, 2011, 10:04:43 AM
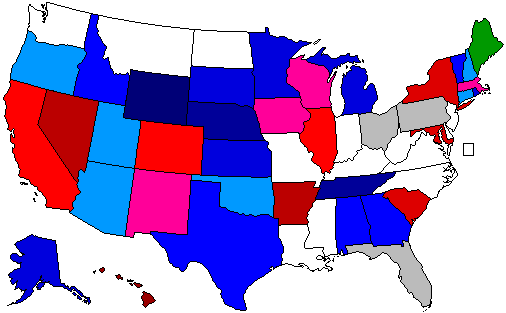
Ok, now let's finish with the governor map (the key is the same) :
( )
)
This time the bias seems to lean more toward democrats, and the forecast seems to be even more inaccurate than in the Senate. Wyoming, Nebraska and Tennessee are particularly far off.
(
This time the bias seems to lean more toward democrats, and the forecast seems to be even more inaccurate than in the Senate. Wyoming, Nebraska and Tennessee are particularly far off.
Title: Re: Fivethirtyeight.com's performances
Post by: minionofmidas on January 18, 2011, 04:28:42 PM
Of course, that's from his last update before the election. It'd be more interesting to look at his projections from many months out, when not so many of the races are going to be in the 90-100% range.
Title: Re: Fivethirtyeight.com's performances
Post by: albaleman on January 18, 2011, 06:41:35 PM
Since the official rsults have now been published everywhere except in Alaska, here is the map showing 538.com's performance for Senatorial races.
()
The map indicates which party overperformed and by how many points. Grey means the difference between the forecast and the actual results is inferior to 1%. The 30% shade means between 1 and 2.5%, then between 2.5-5, 5-7.5, 7.5-10, and finally over 10%.
(
The map indicates which party overperformed and by how many points. Grey means the difference between the forecast and the actual results is inferior to 1%. The 30% shade means between 1 and 2.5%, then between 2.5-5, 5-7.5, 7.5-10, and finally over 10%.
Interesting. It appears that Nate projected most races as closer than they actually were.
Title: Re: Fivethirtyeight.com's performances
Post by: Nichlemn on January 22, 2011, 01:21:16 AM
I think evaluation of prognosticators needs to take more account of early predictions (as I post about on 538 here (http://community.nytimes.com/comments/fivethirtyeight.blogs.nytimes.com/2011/01/07/how-not-to-take-responsibility-for-a-failed-forecast/?permid=16#comment16)). If you only focus on your final forecast, what stops from you posting garbage until shortly before election day?
Title: Re: Fivethirtyeight.com's performances
Post by: Antonio the Sixth on January 22, 2011, 07:06:38 AM
I think evaluation of prognosticators needs to take more account of early predictions (as I post about on 538 here (http://community.nytimes.com/comments/fivethirtyeight.blogs.nytimes.com/2011/01/07/how-not-to-take-responsibility-for-a-failed-forecast/?permid=16#comment16)). If you only focus on your final forecast, what stops from you posting garbage until shortly before election day?
But races can change dramatically until the election day. So if for example you see a big difference between an early forecast and the final results it doesn't necessarily mean 538 was wrong, just that things have changed.
Quote
Last but not the least, there is an important similarity between the two maps : all seem to bie slightly biased against democrats (ie dems did better than expected).
Vote fraud.
Go away please.
Title: Re: Fivethirtyeight.com's performances
Post by: Antonio the Sixth on January 22, 2011, 07:08:55 AM
Since the official rsults have now been published everywhere except in Alaska, here is the map showing 538.com's performance for Senatorial races.
()
The map indicates which party overperformed and by how many points. Grey means the difference between the forecast and the actual results is inferior to 1%. The 30% shade means between 1 and 2.5%, then between 2.5-5, 5-7.5, 7.5-10, and finally over 10%.
(
The map indicates which party overperformed and by how many points. Grey means the difference between the forecast and the actual results is inferior to 1%. The 30% shade means between 1 and 2.5%, then between 2.5-5, 5-7.5, 7.5-10, and finally over 10%.
Interesting. It appears that Nate projected most races as closer than they actually were.
Yeah. Actually, it was already the case (even more so) in the 2008 presidentials. Every State where dems were underestimated voted for Obama, and every State where democrats were overestimated voted McCain except Iowa.
Title: Re: Fivethirtyeight.com's performances
Post by: Nichlemn on January 22, 2011, 07:37:09 AM
I think evaluation of prognosticators needs to take more account of early predictions (as I post about on 538 here (http://community.nytimes.com/comments/fivethirtyeight.blogs.nytimes.com/2011/01/07/how-not-to-take-responsibility-for-a-failed-forecast/?permid=16#comment16)). If you only focus on your final forecast, what stops from you posting garbage until shortly before election day?
But races can change dramatically until the election day. So if for example you see a big difference between an early forecast and the final results it doesn't necessarily mean 538 was wrong, just that things have changed.
Sure, you have to take that into account. But it's really just another form of uncertainty that exists in other ways right until Election Day (for instance polling errors). Your 20% predictions two years out or two days out should still be right 20% of the time. The big problem for evaluating predictions, early or late, is the small sample size of elections 538 has covered thus far.
Title: Re: Fivethirtyeight.com's performances
Post by: Antonio the Sixth on January 22, 2011, 07:41:06 AM
I think evaluation of prognosticators needs to take more account of early predictions (as I post about on 538 here (http://community.nytimes.com/comments/fivethirtyeight.blogs.nytimes.com/2011/01/07/how-not-to-take-responsibility-for-a-failed-forecast/?permid=16#comment16)). If you only focus on your final forecast, what stops from you posting garbage until shortly before election day?
But races can change dramatically until the election day. So if for example you see a big difference between an early forecast and the final results it doesn't necessarily mean 538 was wrong, just that things have changed.
Sure, you have to take that into account. But it's really just another form of uncertainty that exists in other ways right until Election Day (for instance polling errors). Your 20% predictions two years out or two days out should still be right 20% of the time. The big problem for evaluating predictions, early or late, is the small sample size of elections 538 has covered thus far.
Indeed, that's the big problem. I think we will be able to give some meaningful evaluation only after 10 election cycles, ie 20 years. :P
Title: Re: Fivethirtyeight.com's performances
Post by: Antonio the Sixth on May 27, 2013, 05:53:18 AM
I waited a bit to make sure the results I used were the final ones, but here is finally the Presidential map of over/underperformance compared to 538.com forecasts. Here is it! :)
( )
)
I have tweaked the color coding a bit so as to have more shades. The thresholds are 10 (only WV was off by more than 10 points - sigh...), 7.5, 5, and then it's increments of 1 point (in grey States, Nate was off by less than 1 point).
A quite different map from 2008, anyhow. The pattern seems messier, and with a few areas that clearly stand out (appalachia, the inland northwest, CA, AK, the coastal northeast and the Deep South).
Also, here is another interesting map. It says which component of Nate's forecast (red is the polling average, blue is the "fundamentals" model, and green is the final forecast) was the most accurate in predicting the result. It must be noted that the final forecast is an average of the previous two, which means that it can only be more accurate indicator if the two others skew in different directions. That doesn't mean averaging the two factor isn't the best system.
( )
)
While in many States the fundamentals were a much better predictor of the result in most States, the polling average tends to be more predictive in the swing States - the States where more polls are conducted. Thus, despite appearances, this actually confirms the validity of Nate's system (which gives a greater weigh to the polling average based on the number of polls).
The same maps will be up for the Senate races soon.
(
I have tweaked the color coding a bit so as to have more shades. The thresholds are 10 (only WV was off by more than 10 points - sigh...), 7.5, 5, and then it's increments of 1 point (in grey States, Nate was off by less than 1 point).
A quite different map from 2008, anyhow. The pattern seems messier, and with a few areas that clearly stand out (appalachia, the inland northwest, CA, AK, the coastal northeast and the Deep South).
Also, here is another interesting map. It says which component of Nate's forecast (red is the polling average, blue is the "fundamentals" model, and green is the final forecast) was the most accurate in predicting the result. It must be noted that the final forecast is an average of the previous two, which means that it can only be more accurate indicator if the two others skew in different directions. That doesn't mean averaging the two factor isn't the best system.
(
While in many States the fundamentals were a much better predictor of the result in most States, the polling average tends to be more predictive in the swing States - the States where more polls are conducted. Thus, despite appearances, this actually confirms the validity of Nate's system (which gives a greater weigh to the polling average based on the number of polls).
The same maps will be up for the Senate races soon.
Title: Re: Fivethirtyeight.com's performances
Post by: minionofmidas on May 27, 2013, 06:30:21 AM
This is basically a map of the fact that nobody good polled the safe states in 2012.
Title: Re: Fivethirtyeight.com's performances
Post by: Snowstalker Mk. II on May 27, 2013, 10:14:18 AM
Yeah, it's honestly disappointing how safe states were looked at even less than usual.
Title: Re: Fivethirtyeight.com's performances
Post by: Antonio the Sixth on May 29, 2013, 05:36:28 AM
If you are disappointed by the polls' performance for the Presidential race, wait until you see the Senate map.
( )
)
Also here, there is a clear global tendency. It's impressive to see how democrats almost everywhere did better than expected. Wow.
As for the components.
( )
)
Here polling averages actually did a bit better, though you really find situations of all kind
(
Also here, there is a clear global tendency. It's impressive to see how democrats almost everywhere did better than expected. Wow.
As for the components.
(
Here polling averages actually did a bit better, though you really find situations of all kind
Title: Re: Fivethirtyeight.com's performances
Post by: Snowstalker Mk. II on May 29, 2013, 06:03:52 AM
Clearly FiveThirtyEight has a radical leftist bias.
Title: Re: Fivethirtyeight.com's performances
Post by: Antonio the Sixth on May 29, 2013, 10:46:24 AM
Also, it's interesting how little correlation there is between the errors between Presidential and Senate races. The two seem almost unconnected.
Title: Re: Fivethirtyeight.com's performances
Post by: Oldiesfreak1854 on May 29, 2013, 04:51:28 PM
Clearly FiveThirtyEight has a radical leftist bias.