


Note: The Google advertisement links below may advocate political positions that this site does not endorse.
|
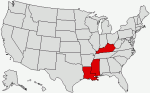
Date of Prediction: 2007-09-02 Version:1
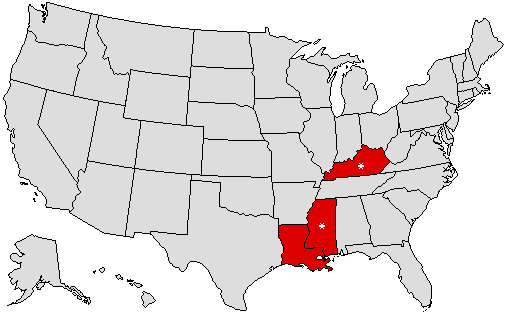
Prediction Map
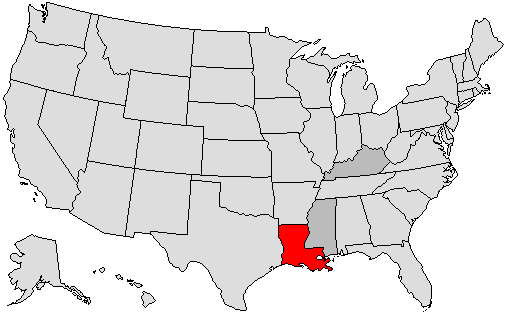
* = Pickup via defeat of incumbent; ^ = Pickup of an open seat Confidence Map
Prediction States Won
Confidence States Won
State Pick-ups
Prediction Score (max Score = 6)
Comments
Without looking in detail at the 2003 results, that's a complete and utter guess! Member Comments By: HarryHayfield (G-GBR) - 2007-11-07 @ 03:51:59
User's Predictions
Links
|
||||||||||||||||||||||||||||||||||||||||||||||||||||||||||||||||||||||||||||||||||||||||||||||||||||||||||||||||||||||||||||||||||||||||||||||||||||||||||||||||||||||||||||||||||||||||||||||||||||||||||||||||||||||||||||||||||||||||||||||||||||||||||||||||||||||||||||||||||||||||||||||||||||||||||||||||||||||||||||||||||||||||||||||||||||||||||||||||||||||||||||||||||||||||||||||||||||||||||||||||||||||||||||||||||||||||||||||||||||||||||||||||||||||
 2024 President
 2023 Governor
 2022 Senate
 2020 President
 2020 Senate
 2020 Governor
 2016 President
 2015 Governor
 2014 Senate
 2014 Governor
 2013 Governor
 2012 President
 2012 Senate
 2012 Governor
 2012 Rep Primary
 2011 Governor
 2010 Senate
 2010 Governor
 2009 Governor
 2008 President
 2008 Senate
 2008 Governor
 2008 Dem Primary
 2008 Rep Primary
 2007 Governor
 2006 U.S. Senate
 2006 Governor
 2004 President
Back to 2007 Gubernatorial Prediction Home - Predictions Home
© Dave Leip's Atlas of U.S. Elections, LLC 2019 All Rights Reserved